The Center for Jobs and the Economy has released our full analysis of the October Employment Report from the California Employment Development Department. For additional information and data about the California economy visit www.centerforjobs.org/ca.
Key Takeaways
- Rising Unemployment: California’s unemployment rate rose to 5.4%, the second highest in the U.S., with over 1 million unemployed for the 10th consecutive month, matching levels last seen in the pre-pandemic period in mid-2016.
- Nonfarm Job Losses: In October, California lost 5,500 nonfarm jobs, ranking 45th among states.
- Government Job Growth: Job growth in California continues to be driven primarily by government and government-supported industries, especially Healthcare and Social Assistance, while the private sector faces pressures from rising costs and regulatory constraints.
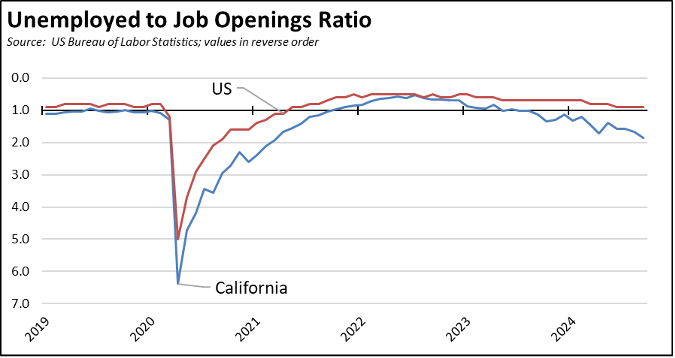
- Fewer Job Openings: California saw a sharp decline in job openings, falling to 554,000 in September 2024, the lowest in the pre-pandemic period since 2015. The state’s job-to-opening ratio is now at its highest, with 1.9 unemployed per job opening.
- Industry Strain: Key industries like tech, biotech, and entertainment are struggling with layoffs, while many companies are relocating out of state due to higher costs and regulatory challenges, intensifying California’s economic pressures.
Second Highest Unemployment Rate Among the States
California’s unemployment rate (seasonally adjusted) continued rising by 0.1 point to 5.4%, while the number of unemployed again was above 1 million for the 10th month in a row. The number of unemployed essentially matched the level previously seen in mid-2016 during the pre-pandemic period. California had the second highest rate among the states, behind Nevada at 5.7%. DC also came in at 5.7%.
After 6 months of modest expansion, the number of employed fell by 5,900. Overall, total employment was down by 82,700 since the near term high in May 2023. In contrast to nonfarm jobs, employment has never returned to pre-pandemic levels and remains 372,900 short of the previous series high in February 2020.
Nonfarm Jobs Drop 5,500
In October, California lost 5,500 nonfarm jobs, coming in 45th highest among the states. Overall, the October results for most states were comparatively weak, reflecting reduced job levels due to strikes and the weather but also coming as the result of softer labor conditions in many areas. Nationally, jobs growth was led by Colorado (9,000), Louisiana (7,700), and Ohio (6,400).
To date in 2024, California has now posted job losses in 3 of the 10 months, basically matching the results in 2023 of losses in 3 of the 12 months.
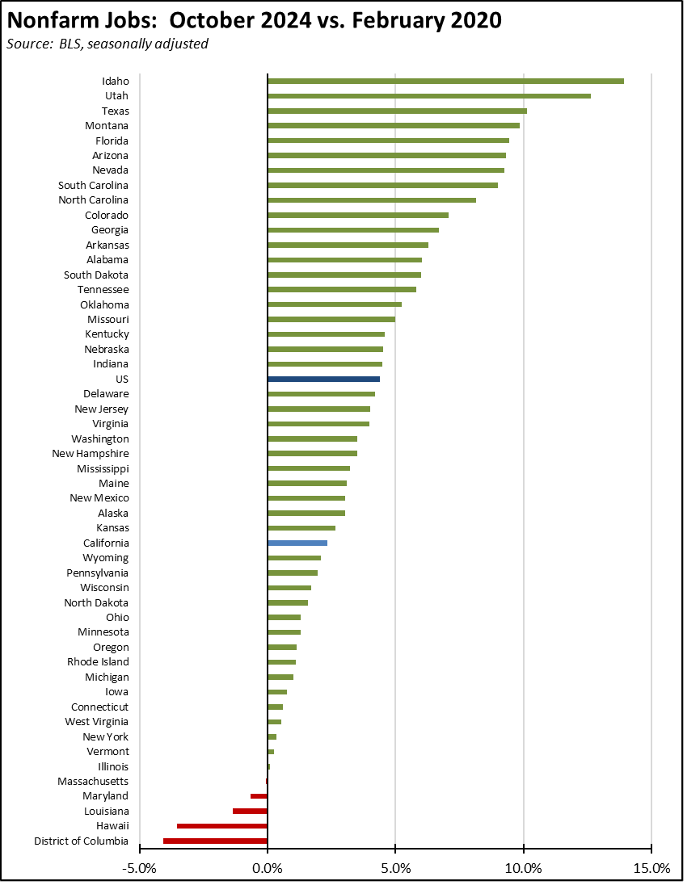
Looking at the longer term trend, California continued to show the 3rd highest net gain with 413,700 nonfarm jobs since the pre-pandemic peak in February 2020, behind Texas with more than triple the gains (1.3 million) and Florida with over double (858,900) and just ahead of much smaller North Carolina (379,100). Note that in the chart below, California is the only one of the 5 states shown not affected by weather events in October. The November results consequently are likely to show an additional rebound in the other 4.

Adjusting for population size, California’s overall job performance since February 2020 remained at 31st highest among the states.
Job losses were driven primarily by the results coming from Southern California, while the Central Valley was the primary area reporting growth. Note that because the data in the table is seasonally adjusted, the regional numbers represent totals for the constituent counties rather than a modeled regional outcome.
Nonfarm Jobs by Industry
Government and government supported jobs continued to be the primary source of growth within the state, posting a marginal rise over the month and comprising 85% of nonfarm jobs growth over the year as the state’s labor conditions and rising costs of doing business held back growth in other private industries.
This reliance on public funding to support jobs growth is reflected in the governor’s recent announcement highlighting California’s selection for the new National Semiconductor Technology Center funded by US Department of Commerce. According to press reports, this Center is expected to create 200 jobs spread over 10 years.
But while spending increases may produce job creation, reliance on budget vagaries for economic development also means spending cuts can result in job losses as illustrated by another announcement receiving less attention. The week following the Technology Center news, the Jet Propulsion Laboratory at Caltech announced layoffs for 325 positions due to funding shortfalls. These latest cuts are in addition to the 530 job reduction in February.
And while government-supported jobs follow the shifts in budget trends, private jobs in the state remain subject to state and local policy factors such as state energy policies that led to the recent announced closure of the Phillips 66 refinery in Los Angeles in Q4 of 2025. Further counterbalancing the 200 government-supported jobs over 10 years coming from the new Technology Center, the refinery closure is expected to eliminate 600 employees and 300 contractors on an ongoing basis. Using the IMPLAN model for California (2022 data), the total direct, indirect, and induced impacts from the closure itself include (due to the high multiplier effects from this industry): 9,960 job losses, $1.02 billion reduction in labor income (wages and benefits), $4.1 billion reduction in state GDP, and $580 million loss to state and local taxes.
Other key industries also remain under pressure:
- High tech layoffs continue as the industry restructures especially to a greater focus on AI operations generally employing fewer employees than the industry’s previous iterations. Through November 13, Layoffs.fyi reports layoffs from tech companies headquartered in California affecting 54,960 jobs in 2024. As the transition continues to AI, however, the health of this industry in the state will become increasingly dependent on the success of the state’s current vampire energy policies. Rather than facilitate this growth itself, California now relies on other states to instead maintain policies to generate the reliable and affordable energy supply needed to support the data center development essential to the expansion of AI jobs.
- Through November, 170 biotech companies have announced layoffs so far in 2024, compared to 187 in all of 2022 and 119 in 2022. This tracker does not break down how many of these are in California.
- As entertainment and media similarly are in the midst of a consolidation phase, over 30 companies have announced layoffs in 2024 through mid-November. Within California, employment in Motion Picture & Sound Recording and in Broadcasting & Content Providers remains 70,400 below (27% below) their pre-strikes average in 2022. Nationally, these two industries have contracted by only 18,100 (2%), indicating the extent to which these California jobs have been affected more by production moving out of the state. Rather than address the underlying cost and regulatory constraints that have contributed to this exodus, the governor instead has proposed moving this industry more into the “government-supported” category.
Hourly Wages Up Marginally—Average Hours Worked Drop
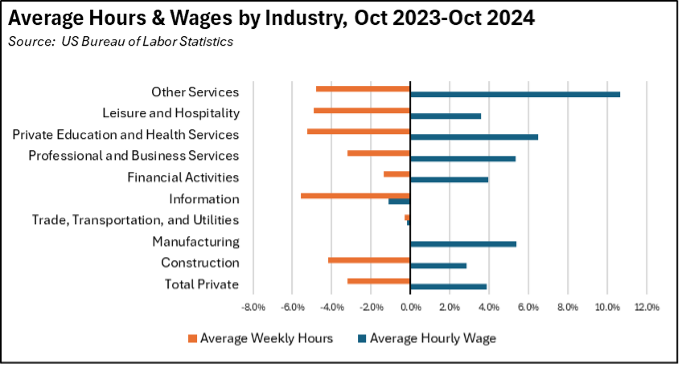
Over the 12 months ending October 2024, average hourly wage in all private industries saw growth of 3.9%. Much of these gains were offset by a drop in average weekly hours worked of 3.2% as employers adjusted to higher labor, energy, and other rising costs.
The results, however, varied widely by industry. Other Services and Private Education and Healthcare had the strongest hourly wage gains at 10.7% and 6.5%. All industries, however, saw offsetting reductions in hours except Manufacturing at no change and Trade, Transportation and Utilities at only a marginal shift of 0.3%.
Unfilled Job Openings Constrict Further
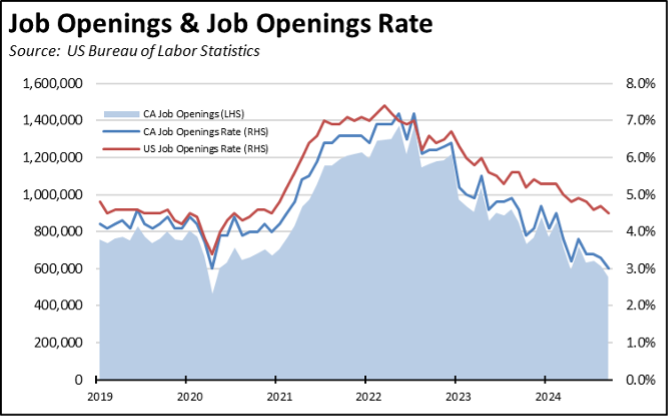
Weakness in current job numbers continues to be matched by declining potential for future jobs expansion as reflected in the JOLTS (Job Openings & Labor Turnover Survey) estimates. In the latest numbers for September, California employers again cut back on their hiring plans but at a somewhat accelerated pace.
The number of unfilled job openings at the end of September fell to 554,000, a level not seen since mid-2015 in the pre-pandemic period. US job openings were also down, but at 5.3% compared to California’s 9.8% drop. Comparing the job opening rates (job openings as a share of job openings plus total employment), California’s steeper decline is seeing the state diverge more from the overall more shallow national downward trend.
California’s high unemployment numbers combined with declining job openings puts the state at 1.9 unemployed for every available job opening. The US overall remains just within labor shortage conditions with 0.9 unemployed per job opening. California has been the worst state as measured by this metric since September 2023, and currently is well above the next two worst states (Washington and Nevada) reporting only 1.3 unemployed per job opening.
CaliFormer Businesses
Additional CaliFormer companies identified since our last report are shown below. The listed companies include those that have announced: (1) moving their headquarters or full operations out of state, (2) moving business units out of state (generally back office operations where the employees do not have to be in a more costly California location to do their jobs), (3) California companies that expanding out of state rather than locate those facilities here, and (4) companies turning to permanent telework options, leaving it to their employees to decide where to work and live. The list is not exhaustive but is drawn from a monthly search of sources in key cities.
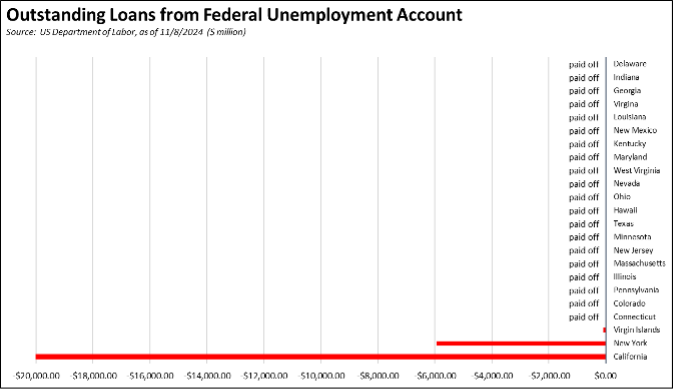
State UI Fund Debt Above $20 Billion
The state’s continuing failure to address its burgeoning Unemployment Insurance debt saw the level remaining above $20 billion. Current projections remain unknown as EDD has yet to release their October 2024 Unemployment Fund Forecast.
All other states other than New York have paid off their pandemic period debt, in large part using the federal funds provided for that purpose. California instead chose to use those funds on other expenditures.
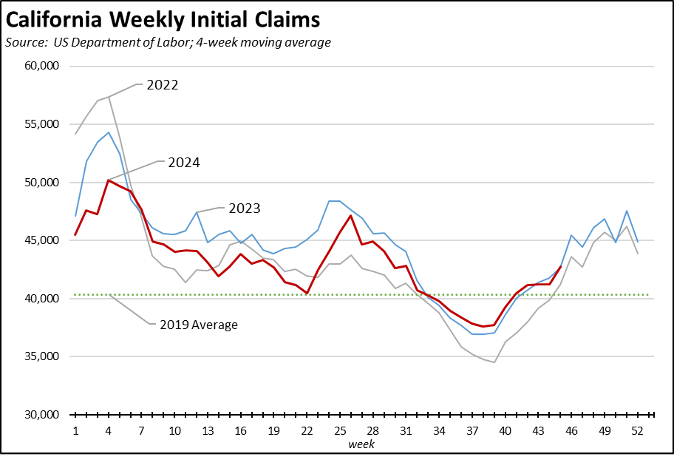
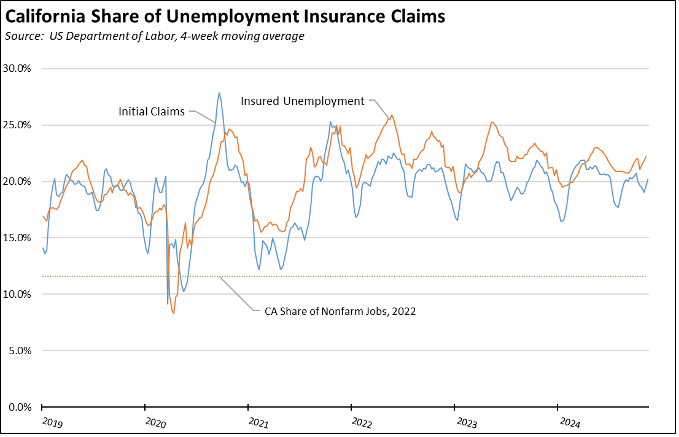
Measured on a 4-week moving average basis, the number of initial claims continues to rise but largely in tune with the trend from 2023. Claims, however, remain above the 2022 levels at this time of year, reflecting the surge in unemployment levels over the past two years.
The number of workers receiving unemployment—as measured by insured unemployed (a proxy for continuing claims)—is now tracking near the 2023 levels, and also remains substantially above the levels in 2022.
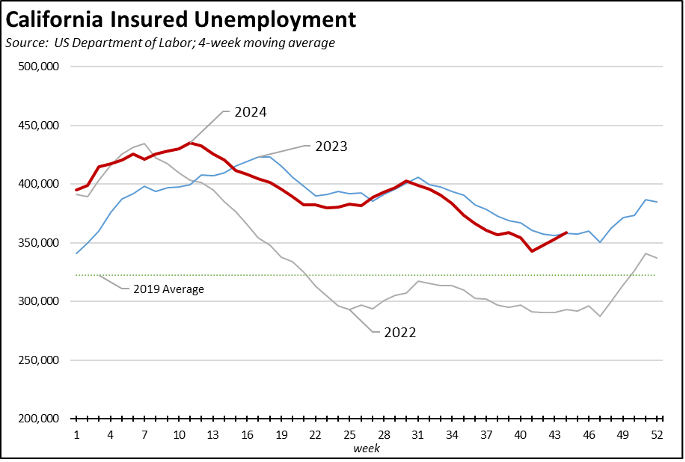
Reflecting California’s outsized share of total benefit payments, insured unemployment contained 22.2% of the national total in the latest results (4 week moving average), while initial claims were at 20.2%.
State Revenue Base Returned to Moderate Growth in 2023
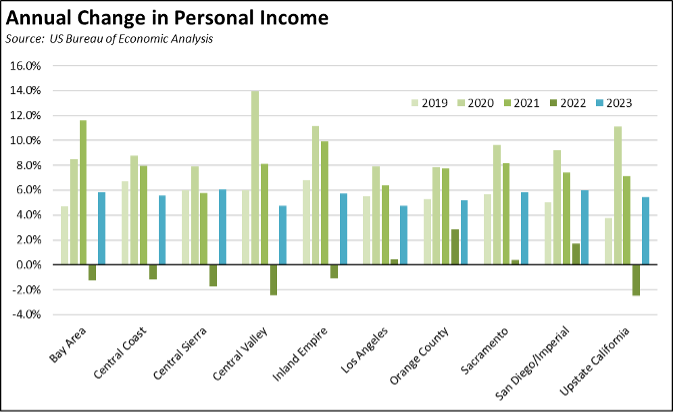
In a typical year, the Bay Area is responsible for 40-44% of the state’s personal income tax revenues, the primary revenue base for the state general fund. Consequently, when Bay Area businesses and residents are doing well, the budget is in surplus. When they are not, deficits arise.
In the latest data release from US Bureau of Economic Analysis, Bay Area personal income growth returned to moderate levels in 2023 after retreating in 2022. At 5.8%, however, the Bay Area differed little from the other regions in the state, which ranged from 6.1% in Central Sierra, to 4.8% in Los Angeles and Central Valley regions. Much of this growth, however, was eaten up by inflation. As measured by the California CPI, inflation rose 3.9% in this period.
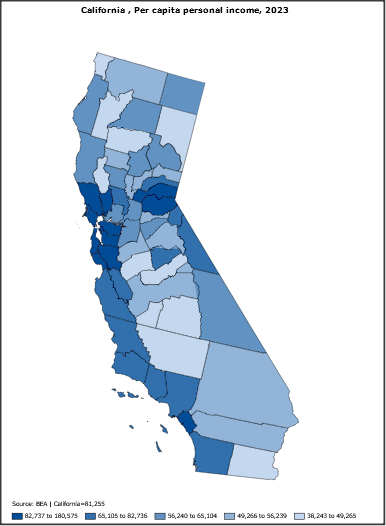
Per capita personal income ranged from $38,243 in Trinity County to $180,575 in Marin County, with the overall California average at $81,255.
