Highlights for policy makers:
- EDD Data Revisions
- Unemployment Rate Declines to 6.9%; Total Employment Climbs 54,000
- Nonfarm Jobs Increase 53,100
- Effect of EDD’s Job Revisions
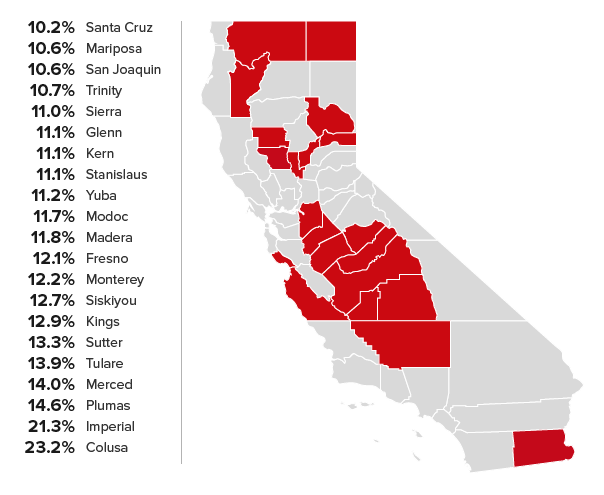
- 21 Counties Remain in Double-Digit Unemployment, Up from a Revised 17 in December
- Two-Tier Economy Persists
- Data Revisions and Updates
EDD Data Revisions
Employment Development Department (EDD) and Bureau of Labor Statistics (BLS) currently are in the process of benchmarking and revising their employment and labor force data. These revisions began with release of the January 2015 data and will continue to be rolled out over the next two upcoming data releases for February and March. Current analysis is limited primarily to comparison of the revised December 2014 and January 2015 data. Longer term analyses will be made as the additional data series are filled in.
Unemployment Rate Declines to 6.9%; Total Employment Climbs 54,000
The Labor Force data for January 2015 (seasonally adjusted; California preliminary) is shown below, along with the change from the prior month:
The related not seasonally adjusted numbers (California preliminary):
Employment Development Department’s (EDD) latest release shows on a seasonally adjusted basis, total employment grew by 54,000, while the number of unemployed dropped by 31,500. By comparison, total US employment increased more strongly by 759,000, while the number of unemployed grew by 291,000.
On a seasonally adjusted basis, improvement in the California unemployment rate came as more of the unemployed found employment. In sharp contrast, the US numbers showed the current employment situation drawing more workers—a gain of just over 1 million—back into the labor force. In our state, the California labor force remained essentially unchanged, gaining a seasonally adjusted total of only 22,500.
Nonfarm Jobs Increase 53,100
Based on the revised seasonally adjusted numbers, total nonfarm payroll jobs increased 53,100 from December 2014 to January 2015. Note that this number differs slightly from the EDD press release due to the fact that the data for Information (and therefore total Nonfarm Jobs) is lower in EDD’s subsequent data release.
Increases occurred in 11 industries led by Accommodation & Food Services (12,900), Construction (11,700), and Educational Services (11,300). Job declines took place in 7 industries, led by Manufacturing (-4,200), Administrative & Support & Waste Services (-4,200), and Wholesale Trade (-3,400).
Effect of EDD’s Job Revisions
The following chart shows the effect of EDD’s current benchmark revisions, comparing the not seasonally adjusted data from December 2014. The data compares the previous 2013 benchmark data to the newly revised 2014 benchmark data.
As indicated, the overall effect is to increase the jobs numbers by about 226,000. Subsequent EDD updates will indicate how this total has been redistributed over time.
By industry, the largest increases were in Government (56,800), Accommodation & Food Services (36,400), and Individual & Family Services (36,200), an industry dominated by the state-financed In-Home Supportive Services. Minor downward revisions were made in 4 industries, including a shift of 8,800 in Information.
The chart also shows the latest average annual wage for each industry, taken from the 2014Q2 data from the Quarterly Census of Employment & Wages. Using this data, 50% of the net job changes were made to jobs paying less than $40,000 a year, while relatively few net changes—6%—affected jobs paying more than $90,000 a year.
21 Counties Remain in Double-Digit Unemployment, Up from a Revised 17 in December

Two-Tier Economy Persists
Unemployment rates and employment growth (all data is not seasonally adjusted) continue to vary widely across the state. Revisions to the preliminary December 2014 data show higher unemployment rates than previously reported in each of the regions with the exception of Bay Area (remained the same) and Inland Empire (dropped 0.2 points).
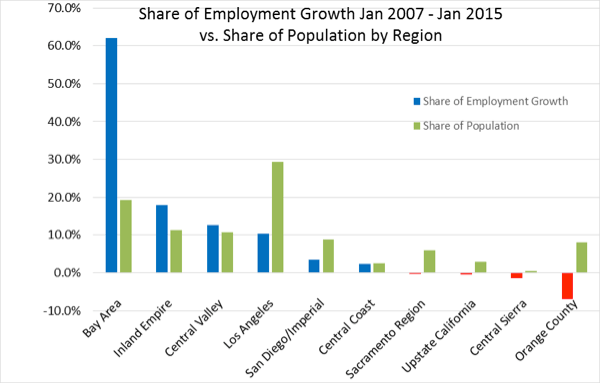
Net employment growth for the state as a whole is now positive, with a total increase of 689,700 between January 2007 and January 2015. However, this net growth has been heavily concentrated within specific regions, with the Bay Area alone accounting for 62% of the total employment growth while containing only 19% of the total population. Los Angeles, with 29% of the population, represents only 10% of total employment growth.

By County:
Ratio of Highest to Lowest Rate: 5.95
By Legislative District:
Ratio of Highest to Lowest Rate: Senate 4.04
Ratio of Highest to Lowest Rate: Assembly 3.94
Data Revisions and Updates
Several of the data series in the Center’s Data Tool and Indicators have been updated and revised as a result of new population numbers released by Department of Finance and the 2009-2013 American Community Survey (ACS), along with the most recent revisions from EDD. Additional revisions will continue to be made as the subsequent EDD revisions are released. Until the final revisions are made in conjunction with the final EDD revisions scheduled for mid-April, some discontinuities will exist in the individual data series.
