Last Economic Snapshot Prior to Effects of COVID-19; Preliminary Assessment of Sectors Most Affected By Ongoing Crisis
Highlights for policy makers:
- COVID-19 and the State Economy
- Unemployment Unchanged at 3.9%; Employment Up 27,500
- Labor Force Participation Rate Up to 62.6%
- Employment Growth Ranking
- Nonfarm Jobs Up 21,400 for Month; California Remains at #2 for 12-month Gain
- Jobs Change by Industry
- Structural Shifts in State’s Economy
- Unemployment Rates by Region (not seasonally adjusted)
- MSAs with the Worst Unemployment Rates
COVID-19 and the State Economy
The potential effects on the state economy continue to expand as additional social distancing measures are put into place to combat the spread of the coronavirus outbreak and as consumers begin to redirect their consumption patterns in response to the looming economic uncertainty. The full effect still remains unknown and depends on the duration of the current public health emergency and subsequent readjustment period to return to normal in particular the time required to overcome the many current supply chain disruptions.
As a base indicator tool to summarize these changes as they occur, the following chart contains the most recent employment estimates by industry along with the previous jobs trajectory as measured by the 12-month change taken from the revised data for the same month in the prior year. The data used is the unadjusted numbers to show actual job levels held by Californians rather than the statistical levels from the seasonally adjusted data, and to enable use of the average wage and hours worked numbers where available from this series. With some exceptions, the January 2020 growth trends reflect the pre-emergency conditions.
Source: US Bureau of Labor Statistics
While by no means comprehensive, preliminary impacts by industry include the following:
General Economy. After projecting a short-lived, one-quarter dip in the state’s economy last week, UCLA Anderson Forecast revised their numbers showing a likely recession (two consecutive quarters of decline in real GDP) in the first half of the year. Their projections envision a more severe drop for California due to the high concentration of Transportation & Warehousing, Agriculture, and Leisure & Hospitality jobs within the state. As summarized for California:
Employment is expected to contract by -0.7% in 2020 with the 2nd and 3rd quarters contracting at an annual rate of 2.6%. The unemployment rate will rise to 6.3% by the end of this year and expected to continue to increase into 2021 with an average for 2021 of 6.6%. By the first quarter of 2021 of the year California is expected to lose over 280K payroll jobs with over 1/3 of those in leisure and hospitality and transportation and warehousing. The expectation is for 2021 to be a slow recovery year and 2022 a year of growth once again.
McKinsey & Company has simplified their previous analysis for the US to two likely scenarios: (1) a Delayed Recovery which results in a recession in Q2 and Q3, with global recovery in Q4; and (2) Prolonged Contraction with a more severe downturn in 2020 and recovery beginning only in 2021 Q2.
Most other forecasts also have been revised to project a downturn nationally in the second quarter but reflecting the current uncertainty, differ in the extent of the decline. A recent summary of different sources shows real GDP falling (compared to the first quarter) from 3% to nearly 12% in the most pessimistic viewpoint:
- J.P. Morgan Chase: -3%
- Wells Fargo: -3.3%
- Morgan Stanley: -4%
- Goldman Sachs: -5%
- IHS Markit: -5.4%
- UCLA Anderson Forecast: -6.5%
- TS Lombard: -8%
- Pantheon Macroeconomics: -10%
- Berenberg: -11.7%
Current projections have in common an expectation that the downturn will be sharp but short-lived, with the recovery phase being more gradual but returning to the previous trend as conditions return to normal. These expectations could change as more information becomes available on the duration and severity of the current outbreaks.
Agriculture. Initial impacts came as the availability of empty containers and shipping costs overall changed substantially as trade began to be affected by shutdowns in China. While overall imports through California ports were down only slightly in January compared to the year earlier, imports from China and Hong Kong dropped 22%. California’s agricultural industry is heavily oriented towards exports, and continuing trade disruptions will have a strong effect.
Construction. Effects to date have been balanced by gains from dry weather prior to this week, but the employment situation is likely to change as businesses reconsider their investment plans, shifting revenue pictures delay public works, and as changing incomes affect the ability of Californians to buy new homes. Disruption in the flow of construction materials that now come from overseas will also slow many projects, with associated price increases making many current plans no longer economic. Business as usual under the state’s high regulatory, fee, and other cost hurdles related to new construction likely mean slower recovery for this industry once reductions take hold.
Manufacturing. The January numbers reflect an initial slowing as parts and materials flows faced disruption from the shutdowns in China. Growing restrictions on transportation in general will begin to have further effects on global supply chains as well as the components of California manufacturing that are oriented to exports.
Trade, Transportation & Utilities. The January numbers for Retail Trade reflect the general contraction already underway as traditional bricks-and-mortar locations have closed in response to competition from non-traditional channels and growing costs of operating in the state. Transportation & Warehousing reflects the relatively minor shifts in the trade numbers to date, but likely will be affected as transportation restrictions increase. Retail Trade in particular has a significant effect on state and local revenues from being the primary source of sales tax, with components such as new vehicle sales at risk to changing consumer concerns— Motor Vehicle and Parts Dealers (NAICS 441) produced 12% of total taxable sales in the most recent data for the third quarter in 2019. As measured by employment, the most recent 2019 Q2 data indicates New Car Dealers comprise about 60% of that industry, but now face challenges in keeping nearly 120,000 workers employed as sales plummet. Some Retail Trade components, however, are expanding employment to meet an upsurge in demand for certain products, including grocery stores and home delivery shopping.
Information. Different parts of this industry are feeling different effects. Some components have moved to remote work arrangements, while content production is being suspended for movies and television. Theaters have closed, with some studios now looking at moving some film releases directly to streaming platforms.
Financial Activities. Overall health of this industry has been affected by the ongoing turmoil in financial and equity markets, while some additional pressures will come as claims rise for business disruptions stemming from the emergency measures. Key components such as rentals related to travel and tourism such as vehicles are already experiencing severe downturns in business.
Educational & Health Care Services. The Educational Services component is now experiencing disruption as private schools are closed along with the public ones. Health Care will be faced more from the cost side as demand for care rises, capacity becomes stressed, and uncompensated costs rise.
Leisure & Hospitality. The industry initially was the hardest hit as restrictions have gone into place for travel, conventions, and entertainment venues. The travel industry component alone in 2018 accounted for $140.6 billion in spending, or 2.5% of total state GDP. In addition to the tourism and business-travel aspects of this industry, a large component particularly restaurants and bars have been an important source of consumer spending that is now being affected both by restrictions and consumer changes. As many businesses seek to stay operating through alternative service modes such as delivery and take-out for restaurants, they will also face challenges from new restrictions such as from last year’s AB 5.
Other Services. Similar to Retail Trade and Leisure & Hospitality, many of the employers are small businesses who were already facing significant challenges from the growing costs of operating in the state along with the employment turmoil created by last year’s passage of AB 5. New pressures on revenues are likely to see many of these businesses struggling to survive.
Public Finance. While a temporary bump in the surplus is likely from the forced realization of capital gains due to the recent stock market declines, the longer term picture is now changed due to the likelihood that capital gains revenues will be constrained for the next year or two. Additional restraints on revenues will come from several factors:
- Reduced sales tax as consumers prioritize generally non-taxable essentials over discretionary purchases.
- Reduced income tax as unemployment rises and earnings decline.
- Reduced business taxes as costs of initiating and complying with social distancing rise, revenues decline, and global supply disruptions continue. These effects will be seen in both the Corporate Income Tax and Personal Income Tax. Based on the most recent Franchise Tax Board data for 2017, Corporate Income Tax produced $8.8 billion, while non-corporation forms taxed at personal rates had a tax liability of $12.5 billion (18% of total personal income tax) coming from business activities and $15.0 billion (21%) if taxable dividends are included.
- Renewed stresses on the Unemployment Insurance Fund. The most recent projections from Employment Development Department showed the Fund finally returning to a positive balance in 2018 and continuing to grow to $3.3 billion at the end of 2020. Even before the recent emergency, however, the projections also anticipated future pressures on the fund primarily coming from the increase in minimum wage, even though employers continue to contribute at the next-to-highest statutory rate plus a 15% surcharge.
- Pension funds will be affected by the stock market downturn. The most recent CalPERS investment report indicates 50.2% of their investments were in public equities and 7.1% in private equity. The CalSTRS numbers were 50.5% and 9.2%. Through Monday, the stock market as measured by the SP500 was down 19% from the date of those valuations, and down 30% from the market high reached on February 19.
- Potential delays in property tax payments as many small businesses now face cash flow shortages just prior to the April 10 deadline.
The finances of the state are now in far better shape to weather a downturn than they were in 2008. Although the numbers are now likely to change, the January Budget projected total General Fund reserves (all sources and funds) of $20.5 billion. The Special Funds show an ending reserve of an additional $15.7 billion.
Unemployment Unchanged at 3.9%; Employment Up 27,500
EDD reported total employment (seasonally adjusted; January preliminary) was up 27,500 from the revised December numbers, while the number of unemployed dipped 1,400. Unemployment rate remained at the series low of 3.9%. The unadjusted rate was down 0.5 point from the year earlier to 3.8%.
California edged up to the 12th highest unemployment rate among the states.
Total US employment saw a seasonally adjusted dip of 89,000, with the number of unemployed up by 139,000. The unemployment rate edged up to 3.6%.
Figure Sources: California Employment Development Department; US Bureau of Labor Statistics
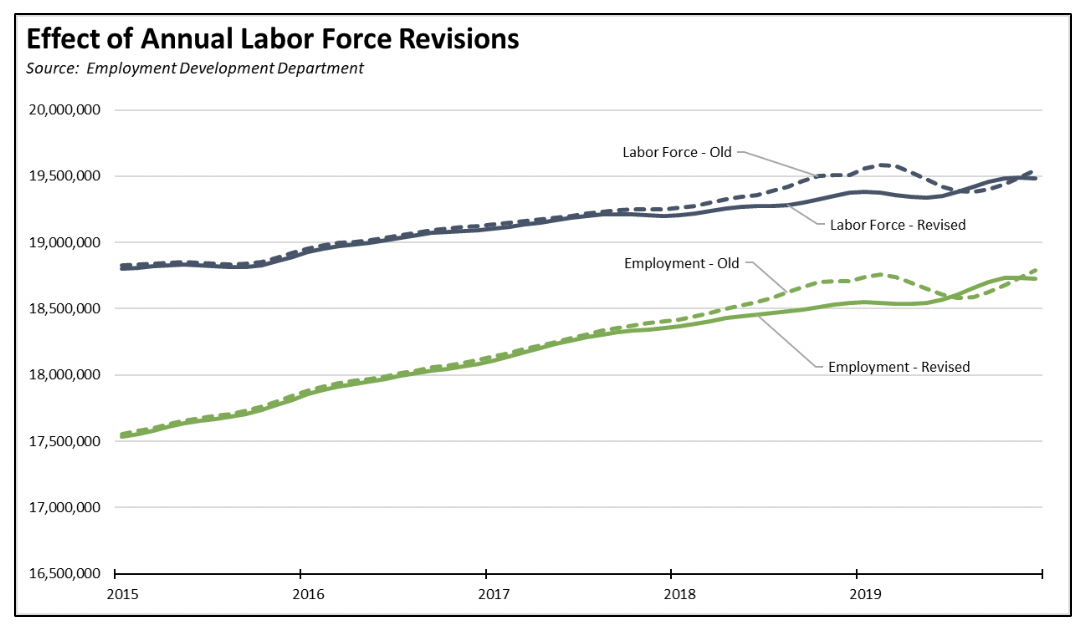
The California numbers come from the next stage in the annual revisions to the labor force and wage and salary job estimates, with the most recent revisions applied to the labor force numbers from 2015 through 2019. This process will continue through the data released later this month revising the numbers for the counties, which then will also be used along with the updated American Community Survey factors to revise our estimates for the legislative districts. The data will be updated in our web site as it becomes available, but this difference should be considered in comparing geographic areas until the revisions are completed.
As indicated below, the revisions are relatively minor compared to those of prior years. In general, the revisions decreased the labor force and employment numbers for 2018, but slightly raised the estimates for the second half of 2019.
Labor Force Participation Rate Up to 62.6%
In the revised numbers, California’s seasonally adjusted labor force participation rate edged up to 62.6%. Nationally, the participation rate rose slightly faster to 63.4%. The revised labor force numbers generally show the state’s rate generally lower through the first half of 2019, but higher in the second half of that year.
For the 12 months ending January 2020, the revised seasonally adjusted data shows the California labor force with stronger improvement over the year, at a gain of 127,000 workers (0.7% growth) compared to the rest of the US gain of 1.3 million (+0.9%). With the state continuing to lag the rest of the nation in labor force reentry, these numbers indicate the state still had the opportunities—although not necessarily the required skills—to continue jobs growth prior to the recent public health emergency.
Employment Growth Ranking
The total number of persons employed (seasonally adjusted) over the 12 months ending in January grew more strongly in a revised 205,600, as employment numbers in the first half of 2019 saw some of the largest downward changes. As a result, California rose to 3rd highest among the states in terms of absolute employment growth over this period, with Texas leading with an additional 259,700 persons employed over this period, and Florida in second place with a gain of 240,000.
Adjusted to account for differences in the size of each state economy, California over the year grew by 1.1%, below the average for the rest of the US with a gain of 1.4%. Ranked among the states, California’s growth rate rose to 24th highest, while Arizona led with 3.5% growth.
Figure Source: US Bureau of Labor Statistics
Nonfarm Jobs Up 21,400 for Month; California Remains at #2 for 12-month Gain
Nonfarm jobs (seasonally adjusted) were up 21,400 as December’s seasonally adjusted gains were revised to 26,300 from the previously reported 24,000.
For the 12 months ending January, total jobs growth was 251,800, keeping the state’s rank in 2nd place behind Texas which gained 279,900 jobs in this period, with Florida in third at 177,400.
Adjusting for population size, California notched up to 12th highest among the states, with a 12-month jobs growth rate of 1.5% compared to the rest of the US at 1.4%. Utah led the states with a growth rate of 2.9%.
Figure Sources: California Employment Development Department; US Bureau of Labor Statistics
Jobs Change by Industry
In the unadjusted numbers that allow a more detailed look at industry shifts, hiring saw increases in all but 4 industries over the year.
Gains in payroll jobs were led by Professional, Scientific & Technical Services ($122.5k average annual wages), Health Care ($68.1k average annual wages), Government ($70.1k).
Declines were led by Retail Trade ($36.7k), Manufacturing ($95.6k), and Management of Companies & Enterprises ($134.9k).
All wage data is from the most current 4-quarter average from the Quarterly Census of Employment & Wages.
| Not Seasonally Adjusted Payroll Jobs (1,000) | Jan 2020 | 12-month change | Nonfarm Growth Rank |
|---|---|---|---|
| Total Farm | 357.8 | 10.2 | |
| Mining & Logging | 22.1 | 0.3 | 17 |
| Construction | 859.0 | 16.2 | 8 |
| Manufacturing | 1,306.8 | -3.7 | 20 |
| Wholesale Trade | 689.5 | -2.5 | 18 |
| Retail Trade | 1,644.1 | -28.4 | 21 |
| Utilities | 57.0 | 0.9 | 16 |
| Transportation & Warehousing | 666.3 | 35.2 | 4 |
| Information | 576.8 | 23.3 | 7 |
| Finance & Insurance | 542.1 | 6.5 | 14 |
| Real Estate & Rental & Leasing | 302.0 | 7.6 | 13 |
| Professional, Scientific & Technical Services | 1,342.1 | 39.8 | 1 |
| Management of Companies & Enterprises | 251.9 | -2.8 | 19 |
| Administrative & Support & Waste Services | 1,121.2 | 14.5 | 9 |
| Educational Services | 383.7 | 14.5 | 9 |
| Health Care | 1,597.2 | 39.4 | 2 |
| Social Assistance | 856.9 | 34.0 | 5 |
| Arts, Entertainment & Recreation | 323.0 | 13.0 | 12 |
| Accommodation | 235.9 | 6.2 | 15 |
| Food Services | 1,450.3 | 26.5 | 6 |
| Other Services | 574.9 | 13.4 | 11 |
| Government | 2,630.8 | 36.2 | 3 |
| Total Nonfarm | 17,433.6 | 290.1 | |
| Total Wage & Salary | 17,791.4 | 300.3 | |
Figure Source: California Employment Development Department
Structural Shifts in State’s Economy
Comparing current job numbers to the pre-recession levels in 2007 illustrates the structural shift in the state’s economy, with the primary jobs growth occurring in the higher and lower wage industries. The revised jobs numbers show a deeper loss position for Manufacturing, Finance & Insurance, and Retail Trade, while Health Care and the lower wage Food Services and Social Assistance continue to lead.
As a result of seasonal factors, Construction as a middle class wage, blue collar industries shifted to the loss column as well, 11.1% below the all-time peak reached in 2006. Residential Building Construction for about a third of the remaining gap, with the January 2019 job levels 33,300 below the all-time peak in 2006.
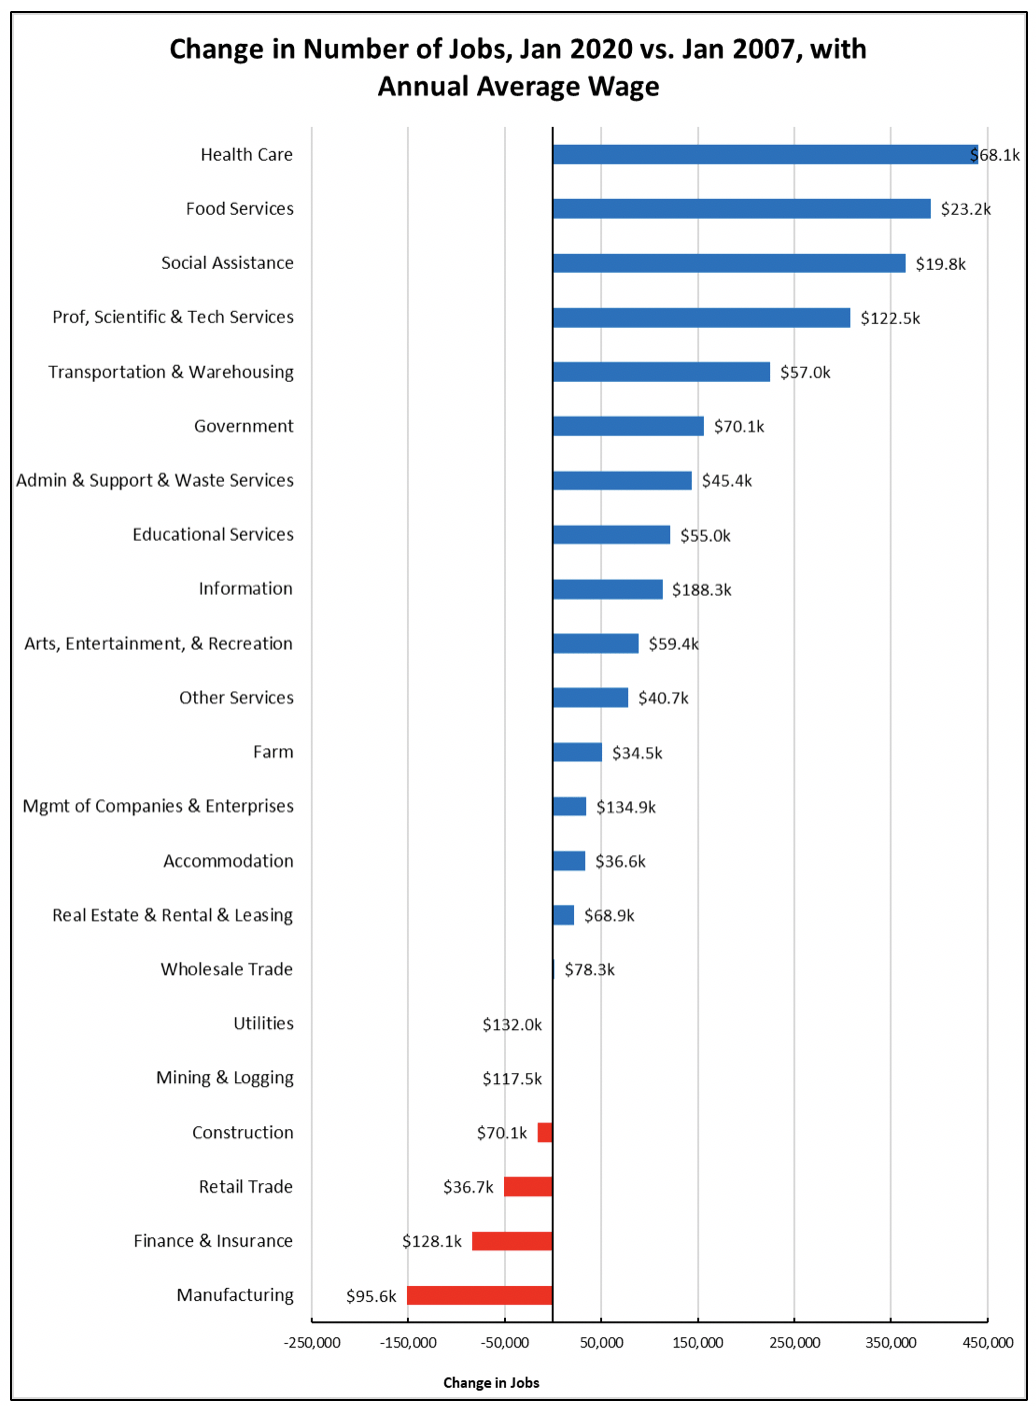
Figure Source: California Employment Development Department
Unemployment Rates by Region (not seasonally adjusted)
| wdt_ID | Region | Unemployment Rates |
|---|---|---|
| 1 | California | 3.7 |
| 2 | Bay Area | 2.3 |
| 6 | Orange County | 2.4 |
| 10 | Sacramento | 3.2 |
| 14 | San Diego/Imperial | 3.5 |
| 18 | Inland Empire | 3.5 |
| 22 | Central Sierra | 3.6 |
| 26 | Los Angeles | 3.9 |
| 30 | Upstate California | 4.9 |
| 34 | Central Coast | 5.2 |
| 38 | Central Valley | 7.0 |
| 39 | ||
| 40 | California | 3.7 |
| 41 | California | 3.7 |
| 42 | ||
| 43 | ||
| 44 | ||
| 45 | ||
| 46 | ||
| 47 | ||
| 48 | HttP://bxss.me/t/xss.html?%00 | |
| 49 | ||
| 50 | bxss.me/t/xss.html?%00 | |
| 51 | ||
| 52 | HttP://bxss.me/t/xss.html?%00 |
Figure Source: California Employment Development Department
MSAs with the Worst Unemployment Rates
Of the 20 Metropolitan Statistical Areas (MSAs) with the worst unemployment rates in December 2019, 10 are in California, including El Centro MSA (Imperial County) which continues with Great Depression-era levels of unemployment that are 9 times worse than in San Mateo, the county with the lowest unemployment rate.
| wdt_ID | MSA | Unemp. | Rank |
|---|---|---|---|
| 1 | El Centro, CA MSA | 19.4 | 389 |
| 2 | Visalia-Porterville, CA MSA | 9.3 | 386 |
| 3 | Merced, CA MSA | 7.9 | 384 |
| 4 | Hanford-Corcoran, CA MSA | 7.7 | 383 |
| 5 | Bakersfield, CA MSA | 7.2 | 381 |
| 6 | Salinas, CA MSA | 7.2 | 381 |
| 7 | Fresno, CA MSA | 6.9 | 379 |
| 8 | Madera, CA MSA | 6.8 | 377 |
| 9 | Yuba City, CA MSA | 6.7 | 376 |
| 10 | Stockton-Lodi, CA MSA | 5.7 | 368 |
Figure Source: US Bureau of Labor Statistics, December 2018 data