The Center for Jobs and the Economy has released our initial analysis of the January Employment Report from the California Employment Development Department.
The January numbers continue the annual data revision process, with the comparisons discussed below reflecting these adjustments. The discussion is limited to the California numbers released so far today. Relative rankings will be included in our more detailed analysis next week after US Bureau of Labor Statistics issues the revisions for all the states.
In the January results, nonfarm wage and salary jobs were up 53,600, showing a continued positive trend in statewide jobs but at a level that has remained essentially unchanged since November. Employment gains were stronger at 109,200, reversing the stagnant numbers from the prior two months.
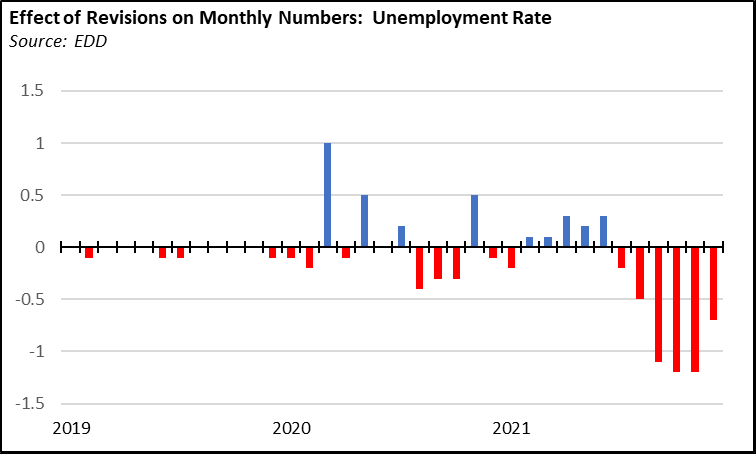
Strong gains were also seen in the revised unemployment rate, now at 5.8% compared to the 6.5% to 7.6% range previously reported for the state in the second half of 2021. A major portion of this improvement comes from downward revisions to the population and labor force estimates as a result of the 2020 Census, but also a downward estimate in the number of unemployed.
With these results, the state continued to show progress towards both jobs and employment recovery, but also continues to lag behind the other states as shown in the chart below. In the January numbers, the rest of the states are now less than 1% shy of full employment recovery as measured by a return to the prior, pre-pandemic peak.
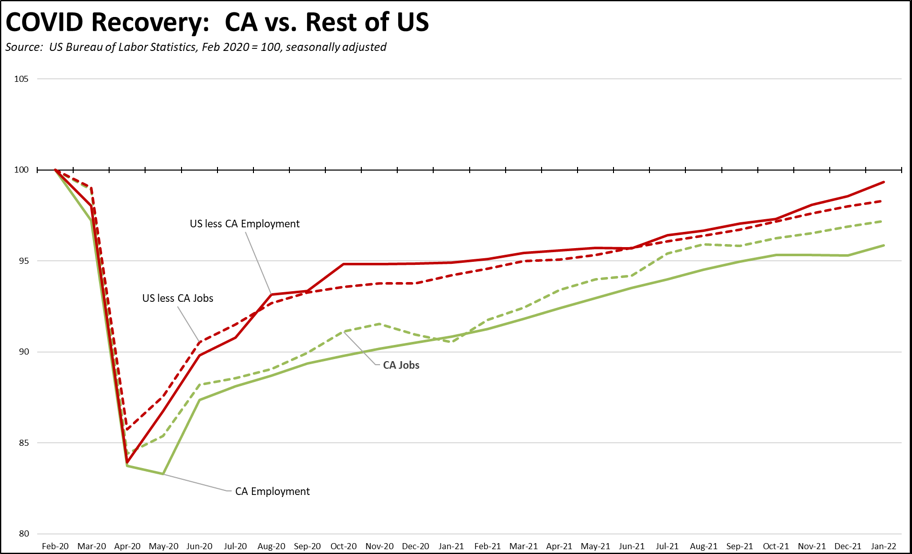
Although a full comparison will be made next week, the revised numbers show that from January 2021 to January 2022, California saw an increase of 1.178 million jobs or 18% of the national gain of 6.704 million. While on the face of it, these numbers suggest the state was outpacing the nation, California also outpaced the nation of the number of jobs lost through the state-ordered closures including the second round at the end of 2020 that was still in effect at the beginning of 2021. California may have reopened more jobs because it also closed more, but the trends shown in the chart indicate overall recovery continues to lag.
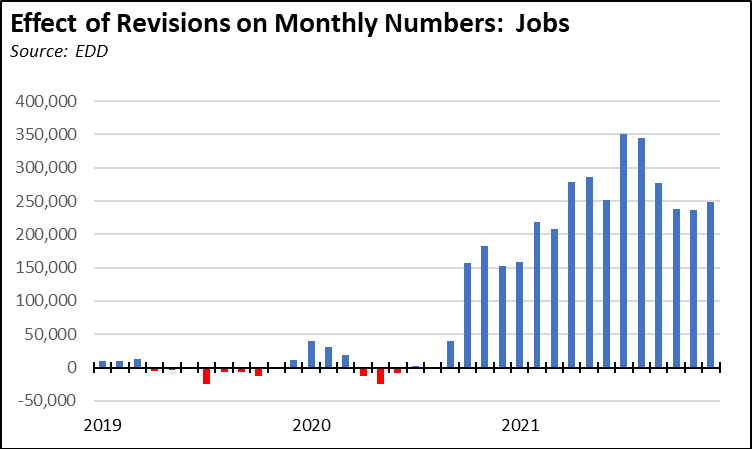
The overall revisions, however, generally show stronger numbers in 2020 and 2021 for California.
The job numbers show the state starting from a somewhat higher base pre-pandemic, but with stronger results beginning the end of 2020 including stronger job numbers during the second round of state-ordered closures. Overall, job numbers in 2021 ended 248,200 higher than previously reported.
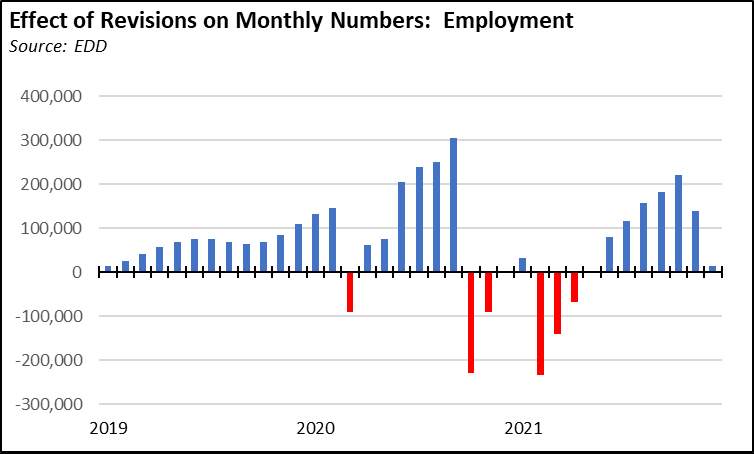
The employment numbers show far less change, with stronger gains earlier in 2020 before recovery was reversed by the second round of closures and much deeper losses during this period. On net, the employment numbers were only revised upwards by 14,100 for the whole of 2021.
The labor force participation rate revisions show a similar pattern, with the state starting out further behind than previously reported at the end of 2021.
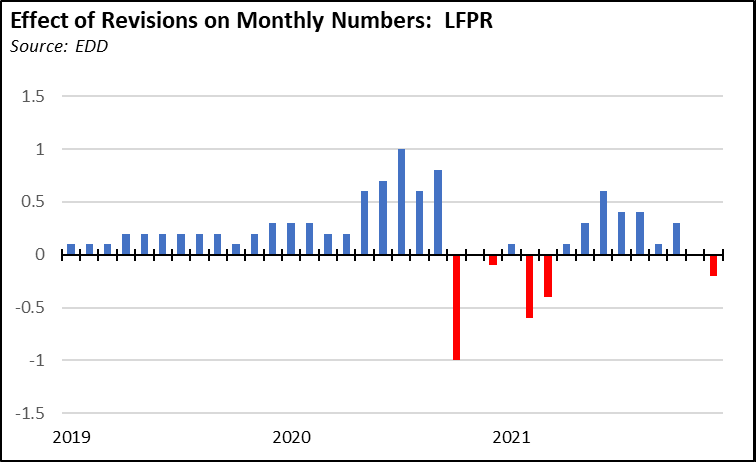
Because of the state’s poor showing in the 2020 Census, however, the revisions show some of the strongest revisions to the unemployment rate. These adjustments correct the previous model assumptions that there were more people in California than what the Census showed.
CA Unemployment Rate
Rate
California’s reported unemployment rate (seasonally adjusted) in January remained at 5.8% for the third month in a row in the revised numbers. This level is the best since April 2020 at the beginnings of the pandemic.
The January numbers show the number of unemployed up by 9,200. Employment rose 109,200. As a result, the labor force was up 118,485, reversing the stagnation in the prior 3 months.
US Unemployment Rate
Rate
The reported national numbers show US unemployment rate (seasonally adjusted) fell 0.1 point to 4.0%. Employment was up 1.199 million, while unemployment rose 194,000. The labor force was up 1.393 million.
Nonfarm Jobs
Change
Nonfarm wage and salary jobs rose 53,600 (seasonally adjusted) in January, while the gains in December were revised to 62,900 from the previously reported 111,600.
Nonfarm jobs nationally were up 481,000.
As of the revised January numbers, California regained 80% of the nonfarm jobs lost to the state shutdowns. The rest of the states combined regained 86% of the jobs lost in the pandemic period.
Job Openings
the end of September
From the new Bureau of Labor Statistics Job Openings & Labor Turnover Survey (JOLTS) estimates by state, the number of unfilled job openings rose to 1.192 million, the highest of any state.
Counties with Double-Digit Unemployment
Unemployment
Above 10%
The number of counties with an unemployment rate at 10% or edged up to 3. The unadjusted rates ranged from 3.1% in Marin to 15.6% in Imperial.