Highlights for policy makers:
- Unemployment Rate Rises to 5.5%; Total Employment Up 35,500
- Labor Force Participation Rate Improves to 62.1%
- State Employment Growth Rankings
- Nonfarm Jobs Increase 36,400
- Five Industries Below 2007 Pre-Recession Job Levels
- Two-Tier Economy Persists
- Nine California MSAs in the 10 Worst Unemployment Rates Nationally
- New Housing Units Down 1.2% in Second Quarter
Unemployment Rate Rises to 5.5%; Total Employment Up 35,500
The Labor Force data for July 2016 (seasonally adjusted; California preliminary) is shown below, along with the change from the prior month:
| Seasonally Adjusted | California | US | ||
|---|---|---|---|---|
| Jul 2016 | Change from Jun 2016 | Jul 2016 | Change from Jun 2016 | |
| Unemployment Rate | 5.5 | 0.1 | 4.9 | 0.0 |
| Labor Force | 19,161,800 | 0.3% | 159,287,000 | 0.3% |
| Participation Rate | 62.1 | 0.2 | 62.8 | 0.1 |
| Employment | 18,114,100 | 0.2% | 151,517,000 | 0.3% |
| Unemployment | 1,047,700 | 2.4% | 7,770,000 | -0.2% |
The related not seasonally adjusted numbers (California preliminary), with the change from July 2015:
| Not Seasonally Adjusted | California | US | ||
|---|---|---|---|---|
| Jul 2016 | Change from Jul 2015 | Jul 2016 | Change from Jul 2015 | |
| Unemployment Rate | 5.9 | -0.6 | 5.1 | -0.5 |
| Labor Force | 19,369,434 | 1.6% | 160,705,000 | 1.4% |
| Participation Rate | 62.7 | 0.3 | 63.4 | 0.2 |
| Employment | 18,233,999 | 2.4% | 152,437,000 | 1.8% |
| Unemployment | 1,135,435 | -8.9% | 8,267,000 | -6.1% |
California Employment Development Department’s (EDD) latest release shows on a seasonally adjusted basis, total employment grew by 35,500 from June, while the number of unemployed grew by 24,700. California’s seasonally adjusted unemployment rate also notched up from 5.4% in June to 5.5% in July. California tied with Rhode Island for the 15th highest unemployment rate among the states. The unadjusted rate decreased from 6.5% in July 2015 to 5.9% in July 2016.
Total US employment saw a seasonally adjusted increase of 420,000, while the number of unemployed remained little changed with a drop of only 13,000. The national unemployment rate remained level at 4.9%.
Labor Force Participation Rate Improves to 62.1%
With the underlying unadjusted rate increasing significantly over the past two months, California’s participation rate (seasonally adjusted) rose 0.2 points to 62.1% in July. The comparable US rate increased 0.1 points to 62.8%.
The latest increases in the participation rate have produced the first time this measure has exceeded 62.0% since August 2015. The two months of back-to-back significant increases in the unadjusted data, however, have yet to establish whether the improvement represents a trend.
While the participation rate shows its first apparent improvement in a year, the overall rate still remains near the previous lows from 1976, and well below the average pre-recession level of 65.6% in 2007.
State Employment Growth Rankings
| Rank | Number of Employed | Percentage Change | Population Adjusted (employment growth per 1,000 civilian noninstitutional population) |
|---|---|---|---|
| 1 | CA 319,648 | OR 5.3% | OR 30.3 |
| 2 | TX 201,354 | TN 3.9% | TN 21.9 |
| 3 | GA 158,664 | DE 3.5% | DE 21.1 |
| 4 | FL 148,418 | GA 3.5% | IN 20.5 |
| 5 | NC 114,518 | AR 3.4% | GA 20.4 |
| 6 | TN 113,198 | IN 3.4% | DC 20.1 |
| 7 | MI 105,979 | DC 3.1% | AR 18.8 |
| 8 | IN 104,900 | SC 2.9% | CO 16.8 |
| 9 | OR 97,738 | AZ 2.7% | SC 15.8 |
| 10 | OH 85,691 | CO 2.6% | AZ 15.0 |
| 11 | IL 80,436 | NC 2.6% | NH 14.7 |
| 12 | AZ 79,108 | MI 2.4% | NC 14.7 |
| 13 | WA 73,856 | NH 2.2% | MI 13.5 |
| 14 | CO 71,252 | WA 2.2% | ID 13.1 |
| 15 | SC 60,603 | ID 2.1% | WA 13.1 |
| 16 | MA 60,033 | UT 2.0% | UT 12.9 |
| 17 | PA 52,549 | CA 1.8% | MA 10.9 |
| 18 | WI 46,434 | MA 1.8% | CA 10.5 |
| 19 | NJ 43,632 | KY 1.7% | WI 10.2 |
| 20 | MD 43,268 | FL 1.6% | TX 9.8 |
| 21 | AR 43,144 | TX 1.6% | OH 9.4 |
| 22 | KY 31,483 | OH 1.6% | MD 9.2 |
| 23 | UT 27,689 | WI 1.6% | KY 9.1 |
| 24 | AL 27,591 | MD 1.4% | FL 9.1 |
| 25 | ID 16,405 | ME 1.4% | SD 9.1 |
| 26 | NH 15,930 | AL 1.4% | ND 8.9 |
| US 2,651,000 | US 1.8% | US 10.5 |
Between July 2015 and July 2016, Bureau of Labor Statistics (BLS) data shows the total number of employed in California increased by 319,648 (seasonally adjusted), or 12.1% of the total net employment gains in this period for the US. Measured by percentage change in employment over the year, California was 17th highest. Adjusted for population, California ranked 18th.
Nonfarm Jobs Increase 36,400
EDD reported that between June and July 2016, seasonally adjusted nonfarm payroll jobs increased by 36,400. May’s gains were revised downwards to 33,200 from the previously reported gain of 40,300.
Looking at the not seasonally adjusted numbers, hiring saw increases in all but 2 industries. The change in total payroll jobs from July 2015 saw the largest increases in Health Care & Social Services (62,400), Government (52,300), and Professional, Scientific & Professional Services (51,400). Declines were in Manufacturing (-5,400) and Mining & Logging (-3,500). Rankings based on the monthly change from June were dominated by school vacation changes in Government and Educational Services.
| Not Seasonally Adjusted Payroll Jobs | Jun 2016 | Jul 2016 | Jul 2016 – Jun 2016 | Jul 2016 – Jul 2015 |
|---|---|---|---|---|
| Total Farm | 484,300 | 477,100 | -7,200 | 1,500 |
| Mining & Logging | 26,100 | 26,100 | 0 | -3,500 |
| Construction | 769,500 | 776,200 | 6,700 | 27,900 |
| Manufacturing | 1,290,300 | 1,304,300 | 14,000 | -5,600 |
| Wholesale Trade | 742,400 | 744,000 | 1,600 | 19,700 |
| Retail Trade | 1,673,400 | 1,683,500 | 10,100 | 31,000 |
| Transportation, Warehousing & Utilities | 564,200 | 564,500 | 300 | 7,000 |
| Information | 495,700 | 494,500 | -1,200 | 10,000 |
| Finance & Insurance | 530,300 | 531,100 | 800 | 900 |
| Real Estate & Rental & Leasing | 283,200 | 284,400 | 1,200 | 8,200 |
| Professional, Scientific & Technical Services | 1,263,000 | 1,268,400 | 5,400 | 51,400 |
| Management of Companies & Enterprises | 235,000 | 236,300 | 1,300 | 5,100 |
| Administrative & Support & Waste Services | 1,086,700 | 1,078,600 | -8,100 | 20,300 |
| Educational Services | 364,800 | 345,900 | -18,900 | 29,600 |
| Health Care & Social Assistance | 2,178,000 | 2,176,000 | -2,000 | 62,400 |
| Individual & Family Services | 592,100 | 589,700 | -2,400 | 15,100 |
| Arts, Entertainment, & Recreation | 322,000 | 326,600 | 4,600 | 21,300 |
| Accommodation & Food Service | 1,610,000 | 1,605,700 | -4,300 | 43,300 |
| Other Services | 558,700 | 554,300 | -4,400 | 1,700 |
| Government | 2,556,500 | 2,378,200 | -178,300 | 52,300 |
| Total Nonfarm | 16,549,800 | 16,378,600 | -171,200 | 383,000 |
| Total Wage & Salary | 17,034,100 | 16,855,700 | -178,400 | 384,500 |
By total number of new jobs, California had the highest increase in seasonally adjusted nonfarm jobs among the states from July 2015 to July 2016, at 374,600 or 15.3% of the US net increase. By percentage growth in jobs, California was 11th highest, and by population adjusted jobs growth, 14th highest.
| Rank | Number of Jobs | Employment Growth (%) | Population Adjusted (job growth per 1,000 civilian noninstitutional population) |
|---|---|---|---|
| 1 | CA 374,600 | ID 3.4% | UT 19.3 |
| 2 | FL 250,200 | OR 3.3% | ID 17.9 |
| 3 | TX 173,000 | FL 3.1% | OR 17.8 |
| 4 | GA 116,200 | UT 3.1% | CO 17.1 |
| 5 | NY 114,300 | WA 3.0% | WA 16.5 |
| 6 | MI 105,500 | CO 2.9% | FL 15.0 |
| 7 | WA 94,400 | GA 2.7% | GA 14.7 |
| 8 | NC 94,100 | AZ 2.6% | SD 14.5 |
| 9 | OH 78,800 | NV 2.5% | NV 13.9 |
| 10 | CO 74,200 | MI 2.5% | MI 13.3 |
| 11 | AZ 67,300 | CA 2.3% | DE 13.2 |
| 12 | MA 65,500 | SC 2.3% | HI 12.8 |
| 13 | TN 58,600 | SD 2.2% | AZ 12.5 |
| 14 | OR 58,200 | DE 2.2% | CA 12.1 |
| 15 | PA 58,000 | NC 2.2% | VT 12.0 |
| 16 | VA 57,200 | HI 2.2% | NC 11.9 |
| 17 | NJ 55,800 | TN 2.0% | SC 11.9 |
| 18 | MD 53,200 | MD 2.0% | MA 11.8 |
| 19 | WI 47,400 | VT 2.0% | TN 11.2 |
| 20 | SC 46,100 | MA 1.9% | MD 11.2 |
| US 2,447,000 | US 1.7% | US 9.6 |
Five Industries Below 2007 Pre-Recession Job Levels
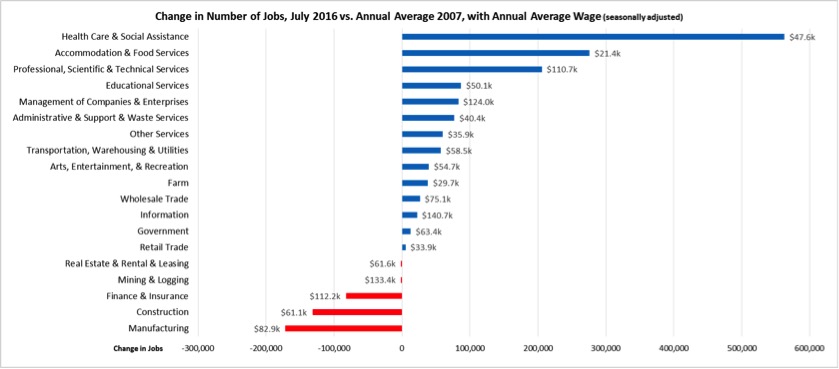
Comparing the number of jobs by industry in July 2016 (seasonally adjusted), 5 industries continued to experience employment below the 2007 pre-recession levels. In the highest gain industries, Health Care & Social Assistance remained the leading industry, followed by lowest wage Accommodation & Food Services and higher wage Professional, Scientific & Technical Services.
Two-Tier Economy Persists
Unemployment rates (all data is not seasonally adjusted) continue to vary widely across the state, ranging from 4.4% in the Bay Area to more than double at 9.7% in the Central Valley.
| Not Seasonally Adjusted | Unemployment Rate (%) July 2016 |
|---|---|
| California | 5.6 |
| Bay Area | 4.4 |
| Orange County | 4.6 |
| Los Angeles | 5.5 |
| Sacramento Region | 5.8 |
| Central Coast | 5.9 |
| Central Sierra | 6.1 |
| San Diego/Imperial | 6.2 |
| Inland Empire | 6.9 |
| Upstate California | 7.4 |
| Central Valley | 9.7 |
By Legislative District:
| Lowest 10 Unemployment Rates | |||||
|---|---|---|---|---|---|
| CD18 (Eshoo-D) | 3.4 | SD13 (Hill-D) | 3.3 | AD16 (Baker-R) | 3.2 |
| CD12 (Pelosi-D) | 3.5 | SD11 (Leno-D) | 3.7 | AD22 (Mullin-D) | 3.2 |
| CD45 (Walters-R) | 3.7 | SD37 (Moorlach-R) | 3.9 | AD24 (Gordon-D) | 3.4 |
| CD14 (Speier-D) | 3.8 | SD26 (Allen-D) | 4.1 | AD28 (Low-D) | 3.5 |
| CD52 (Peters-D) | 3.8 | SD39 (Block-D) | 4.2 | AD17 (Chiu-D) | 3.7 |
| CD33 (Lieu-D) | 3.9 | SD36 (Bates-R) | 4.3 | AD19 (Ting-D) | 3.8 |
| CD17 (Honda-D) | 3.9 | SD15 (Beall-D) | 4.4 | AD77 (Maienschein-R) | 3.8 |
| CD27 (Chu-D) | 4.1 | SD25 (Liu-D) | 4.5 | AD66 (Hadley-R) | 3.8 |
| CD02 (Huffman-D) | 4.4 | SD07 (Glazer-D) | 4.5 | AD74 (Harper-R) | 3.9 |
| CD48 (Rohrabacher-R) | 4.4 | SD32 (Mendoza-D) | 4.6 | AD73 (Brough-R) | 3.9 |
| Highest 10 Unemployment Rates | |||||
|---|---|---|---|---|---|
| CD44 (Hahn-D) | 7.5 | SD28 (Stone-R) | 6.8 | AD80 (Gonzalez-D) | 8.0 |
| CD36 (Ruiz-D) | 7.6 | SD20 (Leyva-D) | 7.0 | AD03 (Gallagher-R) | 8.2 |
| CD41 (Takano-D) | 8.0 | SD04 (Nielsen-R) | 7.1 | AD23 (Patterson-R) | 8.4 |
| CD09 (McNerney-D) | 8.0 | SD31 (Roth-D) | 7.1 | AD34 (Grove-R) | 8.6 |
| CD10 (Denham-R) | 8.4 | SD08 (Berryhill-R) | 8.0 | AD13 (Eggman-D) | 9.0 |
| CD23 (McCarthy-R) | 9.1 | SD05 (Galgiani-D) | 8.3 | AD31 (Arambula-D) | 10.7 |
| CD22 (Nunes-R) | 9.2 | SD12 (Cannella-R) | 8.9 | AD21 (Gray-D) | 10.7 |
| CD16 (Costa-D) | 10.6 | SD16 (Fuller-R) | 9.1 | AD26 (Mathis-R) | 11.0 |
| CD21 (Valadao-R) | 11.6 | SD40 (Hueso-D) | 10.4 | AD32 (Salas-D) | 12.3 |
| CD51 (Vargas-D) | 12.2 | SD14 (Vidak-R) | 12.4 | AD56 (Garcia-D) | 14.3 |
Nine California MSAs in the 10 Worst Unemployment Rates Nationally
Of the 10 Metropolitan Statistical Areas (MSAs) with the worst unemployment rates nationally, 9 are in California. Of the 20 worst, 10 are in California.
| US Rank | MSA | Jun 2016 Unemployment Rate |
|---|---|---|
| 365 | Weirton-Steubenville, WV-OH Metropolitan Statistical Area | 7.5 |
| 369 | Brownsville-Harlingen, TX Metropolitan Statistical Area | 7.6 |
| 369 | Longview, WA Metropolitan Statistical Area | 7.6 |
| 371 | Las Cruces, NM Metropolitan Statistical Area | 7.7 |
| 372 | Casper, WY Metropolitan Statistical Area | 7.8 |
| 373 | Lafayette, LA Metropolitan Statistical Area | 8.0 |
| 374 | Hammond, LA Metropolitan Statistical Area | 8.1 |
| 375 | McAllen-Edinburg-Mission, TX Metropolitan Statistical Area | 8.2 |
| 376 | Stockton-Lodi, CA Metropolitan Statistical Area | 8.3 |
| 377 | Farmington, NM Metropolitan Statistical Area | 9.1 |
| 378 | Modesto, CA Metropolitan Statistical Area | 9.2 |
| 379 | Fresno, CA Metropolitan Statistical Area | 9.4 |
| 379 | Madera, CA Metropolitan Statistical Area | 9.4 |
| 379 | Yuba City, CA Metropolitan Statistical Area | 9.4 |
| 382 | Hanford-Corcoran, CA Metropolitan Statistical Area | 10.2 |
| 383 | Merced, CA Metropolitan Statistical Area | 10.6 |
| 384 | Bakersfield, CA Metropolitan Statistical Area | 10.8 |
| 384 | Visalia-Porterville, CA Metropolitan Statistical Area | 10.8 |
| 386 | Yuma, AZ Metropolitan Statistical Area | 22.2 |
| 387 | El Centro, CA Metropolitan Statistical Area | 23.7 |
New Housing Units Down 1.2% in Second Quarter
The most recent permit data from California Homebuilding Foundation shows the number of housing units covered by new construction permits in 2016 Q2 was down 1.2% from the same period in the prior year, continuing a downward trend of the past three quarters. Total number of single-family and multi-family units combined was 27,429 for the quarter.
The quarterly results translate into an annualized level of 101,000 new units based on total permits this year to date, or about half the number of new units required just to keep up with the state’s population growth. The current State Housing Plan projected a need for 220,000 new units annually to keep pace with projected population growth and adjust for retirement of units through demolition, conversions, and other removals such as fires. More recent estimates peg the annual need at 200,000 in light of the state’s slowing population growth. Since 1990, housing has reached these levels only in the years 2003-2005, with construction of new units failing to match pace with population growth or contribute to the cumulative supply shortage in the remainder of the past quarter century.
The cumulative gap since 1997—the period covered by the current State Housing Plan—is illustrated in the following chart, comparing the cumulative number of actual permitted residential units to the cumulative new supply needs. Through the second half of 2016, the cumulative gap ranges from 2.0 million units at the higher needs estimate (220,000 a year) to 1.6 million at the lower (200,000 a year). Note that these numbers do not include additional cumulative shortfalls from prior years.
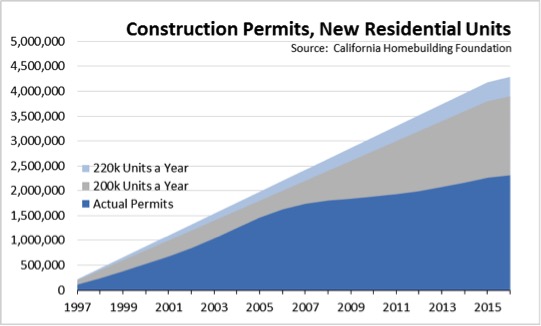
While this gap persists and has been growing, the number of new housing units covered by construction permits has recovered significantly from the recent recessionary lows, which dropped as low as 36,421 in 2009. The current level of 85-100,000 new units annually over the past 3-½ years, however, is only equivalent to the lowest levels experienced by the state in the earlier 1990s recession.
This drop in the level of new permits also translates directly into fewer jobs. Total construction employment in 2016 Q2 averaged 760,500, an improvement from the recessionary lows but down 19% from the previous high of 933,700 construction jobs in 2006. This continued net loss of over 170,000 higher paying blue-collar jobs (average annual wage of $61,100) contributes significantly to income disparity in the state and the growing divides of the two-tier economy.
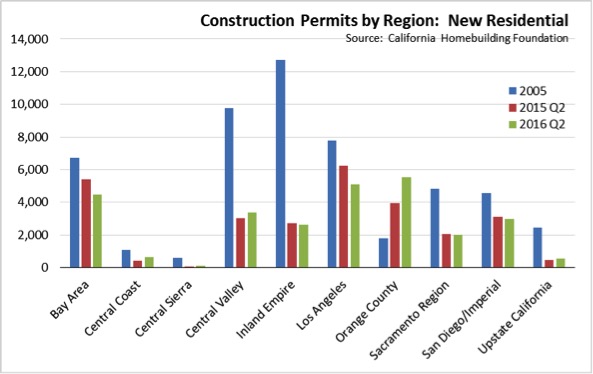
As shown in the following chart, the number of new housing units in 2016 Q2 was up in Orange County and marginally so in Central Valley and Central Coast. Permit activity remained essentially level or dropped in the other regions. For comparison, the chart also shows the average quarterly levels from the last “full supply” year of 2005. This chart also illustrates that while new housing was strong in the interior regions prior to the recession, new construction has now shifted to regions producing the incomes necessary to afford rapidly rising home prices in the state.
Starting with this quarter, the New Residential Permits data in the Economic Indicators now incorporate data on the number of units as well. Further details along with data for the state, regions, and counties is provided on the Center’s web site.
Note: All data sources, methodologies, and historical data series available at CenterforJobs.org.