Highlights for policy makers:
- Unemployment Dips to 4.1%; Employment Down 24,600
- Labor Force Participation Rate Drops to 62.0%
- Employment Growth Ranking—California Plummets to 43rd
- Nonfarm Jobs Up 19,600 for Month; California Remains Ranked #2 for 12-month Gain
- Jobs Change by Industry
- Structural Shifts in State’s Economy
- Unemployment Rates by Region
- Unemployment Rates by Legislative District
- Employment Growth by Region
- MSAs with the Worst Unemployment Rates
- Chart of the Month: Self Employed
Unemployment Dips to 4.1%; Employment Down 24,600
EDD reported total employment (seasonally adjusted; July preliminary) was down 24,600 from the revised June numbers, while the number of unemployed dropped 10,500. Unemployment rate improved to 4.1%. The unadjusted rate was down 0.1 point from the year earlier to 4.1%.
California had the 13th highest unemployment rate.
Total US employment saw a seasonally adjusted gain of 283,000, with the number of unemployed rising 88,000 as the national labor force grew.
Seasonally Adjusted
| wdt_ID | US vs California | Unemployment Rate | Unemployment Rate (Change from June 2019) | Labor Force | Labor Force (Change from June 2019) | Participation Rate | Participation Rate (Change from June 2019) | Employment | Employment (Change from June 2019) | Unemployment | Unemployment (Change from June 2019) |
|---|---|---|---|---|---|---|---|---|---|---|---|
| 1 | CA | 4.1% | -0.1 | 19,387,100 | -0.2% | 62.0% | -0.2 | 18,583,300.0 | -0.1% | 803,800 | -1.3% |
| 2 | US | 3.7% | 0.0 | 163,351,000 | 0.2% | 63.0% | 0.1 | 157,288,000.0 | 0.2% | 6,063,000 | 1.5% |
Not Seasonally Adjusted
| wdt_ID | US vs California | Unemployment Rate | Unemployment Rate (Change from July 2018) | Labor Force | Labor Force (Change from July 2018) | Participation Rate | Participation Rate (Change from July 2018) | Employment | Employment (Change from July 2018) | Unemployment | Unemployment (Change from July 2018) |
|---|---|---|---|---|---|---|---|---|---|---|---|
| 1 | CA | 4.4% | -0.1 | 19,453,600 | -0.2% | 62.2% | -0.6 | 18,589,100.0 | -0.2 | 864,500 | -1.4 |
| 2 | US | 4.0% | -0.1 | 164,941,000 | 0.7% | 63.6% | 0.1 | 158,385,000.0 | 0.9 | 6,556,000 | -2.6 |
Figure Sources: California Employment Development Department; US Bureau of Labor Statistics
Labor Force Participation Rate Drops to 62.0%
California’s seasonally adjusted labor force participation rate continued a 4–month contraction to 62.0%. Nationally, the participation rate edged up to 63.0%. With the gap again expanding, the state continues to experience lower than average participation rates in spite of having a relatively younger population than the rest of the US.
For the 12 months ending July 2019, the seasonally adjusted data shows the California labor force grew by only 700 workers (0.0% growth) compared to the rest of the US at 1.14 million (0.8%).
The continuing stall out in labor force growth has significant implications for the California economy. The increasing difficulty of finding qualified workers, and in some cases any workers, puts California businesses at a competition disadvantage to other states where the expansion continues to draw workers into the labor force. At the same time, this situation produces caseload demands on state and local welfare and other social assistance budgets well above where they should be given the current circumstances of the recovery.
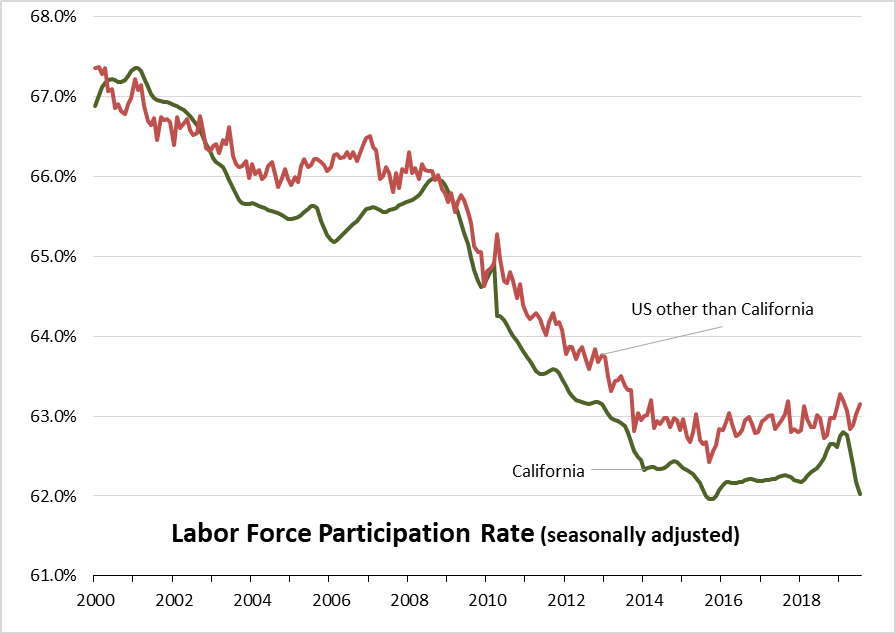
Figure Source: California Employment Development Department; US Bureau of Labor Statistics
Employment Growth Ranking—California Plummets to 43rd
In another sign of the economy’s slowing, the total number of persons employed (seasonally adjusted) over the 12 months ending in July shrank by 600. California plummeted to 43rd place with Texas leading with an additional 227,700 persons employed over this period, and Florida in second place with a gain of 139,000.
Based on percentage growth, California had a 0.0% contraction in employment, below the average for the rest of the US at 1.0%. Ranked among the states, California’s growth rate dropped to 42nd place, while Tennessee led at 3.2%.
| CA vs US other than CA | wdt_ID | Employment Change | Employment Change State Rank | Percentage Change | Percentage Change State Rank |
|---|---|---|---|---|---|
| California | 1 | -600 | 43 | 0.0 | 42 |
| US other than CA | 2 | 1,324,583 | 1.0 |
Figure Source: US Bureau of Labor Statistics
Nonfarm Jobs Up 19,600 for Month; California Remains Ranked #2 for 12-month Gain
Nonfarm jobs (seasonally adjusted) were up 19,600 as June’s gains were revised to 41,300 from the previously reported 46,200.
For the 12 months ending July, total jobs growth was 311,800, keeping the state in 2nd place behind Texas which gained 323,300 jobs in this period, with Florida in third at 227,200.
Adjusting for population size, California came in at 13th among the states, with a 12-month jobs growth rate of 1.8%
| CA vs US other than CA | wdt_ID | Job Change | Job Change State Rank | Percentage Change | Percentage Change State Rank |
|---|---|---|---|---|---|
| California | 1 | 311,800 | 2 | 1.8 | 13 |
| US other than CA | 2 | 1,934,200 | 1.5 |
Figure Sources: California Employment Development Department; US Bureau of Labor Statistics
Jobs Change by Industry
In the unadjusted numbers that allow a more detailed look at industry shifts, hiring saw increases in all but 4 industries over the year.
Gains in payroll jobs were led by Social Assistance ($19.8k average annual wages), Government ($70.1k), and Professional, Scientific & Technical Services ($122.5k).
Declines were in Retail Trade ($36.7k), Wholesale Trade ($78.3k), and Finance & Insurance ($128.1k).
All wage data is from the most current 4-quarter average from the Quarterly Census of Employment & Wages.
| wdt_ID | Not Seasonally Adjusted Payroll Jobs (1,000) | July 2019 | 12-month Change |
|---|---|---|---|
| 1 | Total Farm | 476.7 | 3.6 |
| 2 | Mining & Logging | 23.4 | -0.1 |
| 3 | Construction | 916.5 | 37.8 |
| 4 | Manufacturing | 1,349.6 | 11.1 |
| 5 | Wholesale Trade | 699.0 | -2.9 |
| 6 | Retail Trade | 1,664.7 | -11.3 |
| 7 | Utilities | 57.3 | 0.5 |
| 8 | Transportation & Warehousing | 620.5 | 14.6 |
| 9 | Information | 555.5 | 17.9 |
| 10 | Finance & Insurance | 543.7 | -0.7 |
| 11 | Real Estate & Rental & Leasing | 299.2 | 2.6 |
| 12 | Professional, Scientific & Technical Services | 1,330.4 | 42.5 |
| 13 | Management of Companies & Enterprises | 257.4 | 2.3 |
| 14 | Administrative & Support & Waste Services | 1,161.3 | 34.4 |
| 15 | Educational Services | 359.4 | 18.4 |
| 16 | Health Care | 1,573.9 | 30.5 |
| 17 | Social Assistance | 850.0 | 43.6 |
| 18 | Arts, Entertainment & Recreation | 333.5 | 1.8 |
| 19 | Accommodation | 244.8 | 8.6 |
| 20 | Food Services | 1,485.9 | 31.7 |
| 21 | Other Services | 580.1 | 2.5 |
| 22 | Government | 2,472.8 | 42.6 |
| 23 | Total Nonfarm | 17,378.9 | 328.4 |
| 24 | Total Wage & Salary | 17,855.6 | 332.0 |
Figure Source: California Employment Development Department
Structural Shifts in State’s Economy
Comparing current job numbers to the pre-recession levels in 2007 illustrates the structural shift in the state’s economy, with the primary jobs growth occurring in the higher and lower wage industries.
Jobs growth within the traditional middle class wage—especially blue collar industries such as Manufacturing, Construction, Mining & Logging, and Utilities—continues to lag. After stronger gains during the recovery, both Wholesale and Retail Trade have continued to show weakness, reflecting competitive pressures from nontraditional channels at the same time these industries have been weakened by state policies resulting in rising operating costs. Finance & Insurance also remains in the negative column as companies have moved back office and other operations out of the state.
While still 3,300 below the 2007 peak and 49,800 below the all-time peak in 2006, Construction is the primary blue collar industry gaining ground in the past year as activity has picked up in all areas except Residential Building Construction, which remains 26,000 below the 2007 level and 33,000 below the 2006 peak.
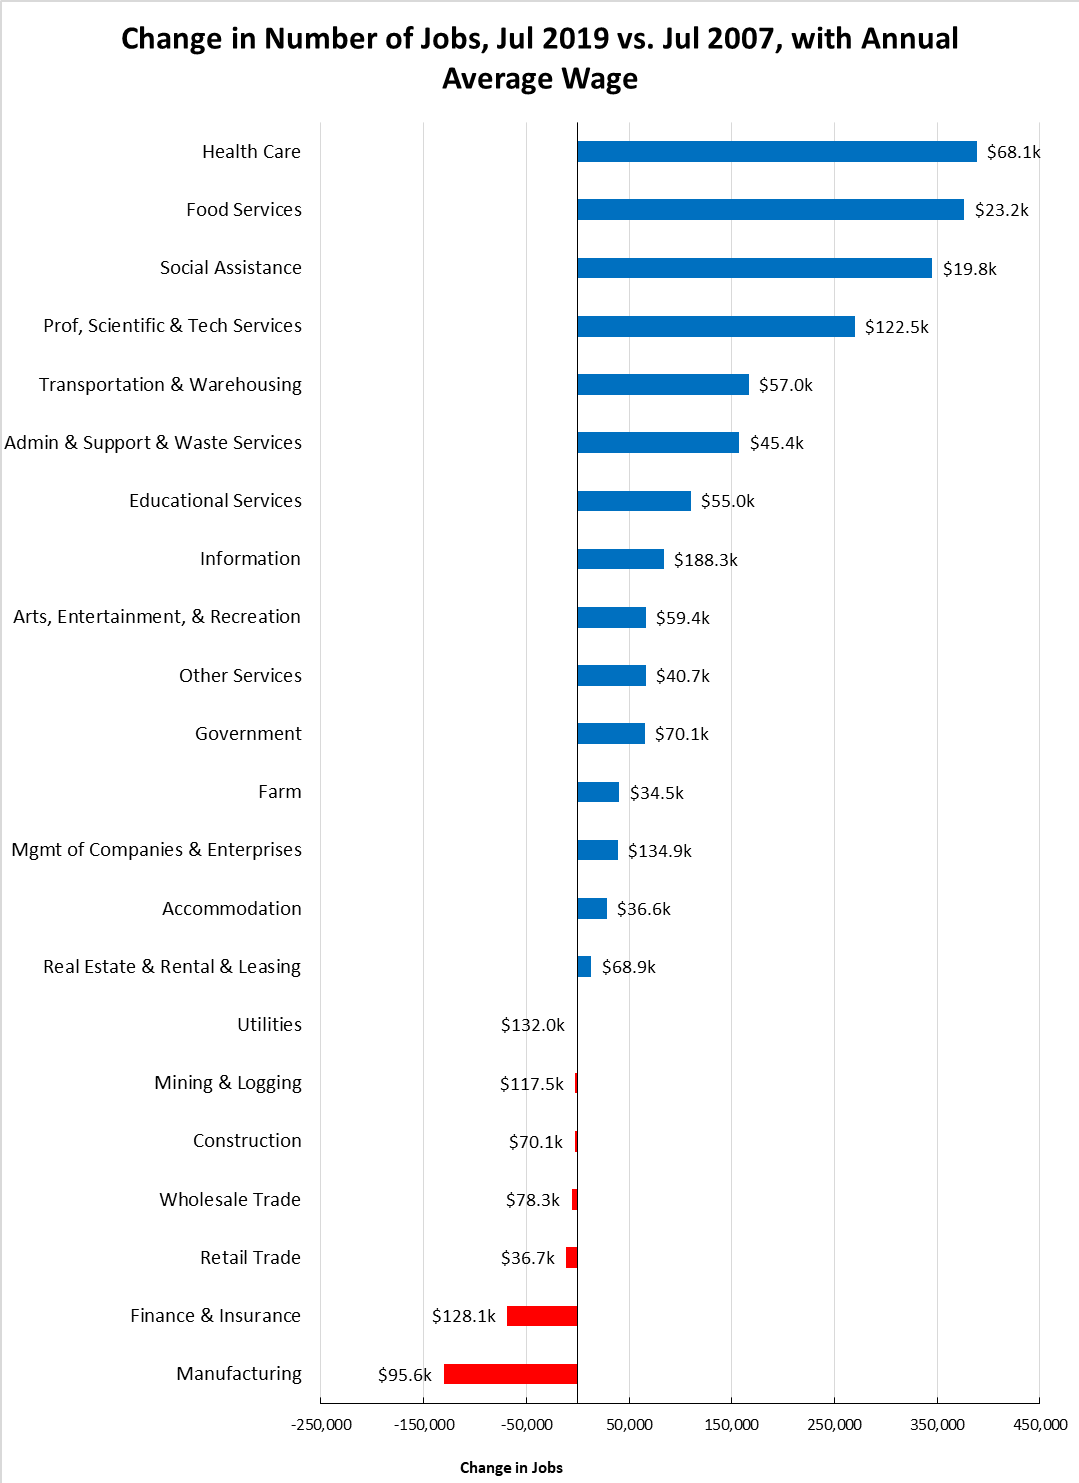
Figure Source: California Employment Development Department
Unemployment Rates by Region
| wdt_ID | Region | Unemployment Rates |
|---|---|---|
| 1 | California | 4.4 |
| 2 | Bay Area | 2.9 |
| 3 | Orange County | 3.2 |
| 4 | Sacramento | 4.0 |
| 5 | Central Sierra | 4.1 |
| 6 | San Diego/Imperial | 4.3 |
| 7 | Central Coast | 4.3 |
| 8 | Inland Empire | 4.6 |
| 9 | Los Angeles | 4.9 |
| 10 | Upstate California | 5.4 |
| 11 | Central Valley | 7.6 |
Figure Source: California Employment Development Department
Unemployment Rates by Legislative District
Lowest
| wdt_ID | Congressional District | Unemployment Rate |
|---|---|---|
| 1 | CD12 (Pelosi-D) | 2.3 |
| 2 | CD18 (Eshoo-D) | 2.3 |
| 3 | CD14 (Speier-D) | 2.5 |
| 4 | CD17 (Khanna-D) | 2.6 |
| 5 | CD15 (Swalwell-D) | 2.7 |
| 6 | CD52 (Peters-D) | 2.8 |
| 7 | CD49 (Levin-D) | 2.8 |
| 8 | CD45 (Porter-D) | 2.9 |
| 9 | CD48 (Rouda-D) | 2.9 |
| 10 | CD02 (Huffman-D) | 3.2 |
| wdt_ID | Senate District | Unemployment Rate |
|---|---|---|
| 1 | SD13 (Hill-D) | 2.2 |
| 2 | SD11 (Wiener-D) | 2.5 |
| 3 | SD36 (Bates-R) | 2.8 |
| 4 | SD37 (Moorlach-R) | 2.9 |
| 5 | SD39 (Atkins-D) | 2.9 |
| 6 | SD10 (Wieckowski-D) | 2.9 |
| 7 | SD15 (Beall-D) | 3.0 |
| 8 | SD07 (Glazer-D) | 3.1 |
| 9 | SD02 (McGuire-D) | 3.3 |
| 10 | SD38 (Jones-R) | 3.4 |
| wdt_ID | Assembly District | Unemployment Rate |
|---|---|---|
| 1 | AD22 (Mullin-D) | 2.1 |
| 2 | AD16 (Bauer-Kahan-D) | 2.1 |
| 3 | AD24 (Berman-D) | 2.3 |
| 4 | AD17 (Chiu-D) | 2.4 |
| 5 | AD28 (Low-D) | 2.5 |
| 6 | AD25 (Chu-D) | 2.6 |
| 7 | AD19 (Ting-D) | 2.6 |
| 8 | AD78 (Gloria-D) | 2.7 |
| 9 | AD73 (Brough-R) | 2.8 |
| 10 | AD74 (Petrie-Norris-D) | 2.8 |
Highest
| wdt_ID | Congressional District | Unemployment Rate |
|---|---|---|
| 1 | CD43 (Waters-D) | 5.8 |
| 2 | CD40 (Roybal-Allard-D) | 5.8 |
| 3 | CD09 (McNerney-D) | 5.9 |
| 4 | CD10 (Harder-D) | 6.1 |
| 5 | CD44 (Barragan-D) | 6.9 |
| 6 | CD22 (Nunes-R) | 7.2 |
| 7 | CD23 (McCarthy-R) | 7.4 |
| 8 | CD16 (Costa-D) | 8.5 |
| 9 | CD51 (Vargas-D) | 9.0 |
| 10 | CD21 (Cox-D) | 9.5 |
| wdt_ID | Senate District | Unemployment Rate |
|---|---|---|
| 1 | SD14 (Hurtado-D) | 10.5 |
| 2 | SD40 (Hueso-D) | 7.7 |
| 3 | SD16 (Grove-R) | 7.1 |
| 4 | SD12 (M. Caballero-D) | 6.9 |
| 5 | SD05 (Galgiani-D) | 6.2 |
| 6 | SD35 (Bradford-D) | 6.2 |
| 7 | SD30 (Mitchell-D) | 5.9 |
| 8 | SD08 (Borgeas-R) | 5.8 |
| 9 | SD32 (vacant) | 5.7 |
| 10 | SD21 (Wilk-R) | 5.6 |
| wdt_ID | Assembly District | Unemployment Rate |
|---|---|---|
| 1 | AD36 (Lackey-R) | 6.4 |
| 2 | AD59 (Jones-Sawyer-D) | 6.7 |
| 3 | AD34 (Fong-R) | 6.8 |
| 4 | AD64 (Gipson-D) | 6.9 |
| 5 | AD13 (Eggman-D) | 6.9 |
| 6 | AD21 (Gray-D) | 8.1 |
| 7 | AD31 (Arambula-D) | 8.8 |
| 8 | AD26 (Mathis-R) | 9.7 |
| 9 | AD32 (Salas-D) | 9.8 |
| 10 | AD56 (Garcia-D) | 10.6 |
Employment Growth by Region
Containing 19.6% of the state’s population, the Bay Area has accounted for 41.9% of net employment growth compared to pre-recession levels. Los Angeles Region, with 29.0% of the population, accounted for only 15.7% of net employment gains, while Inland Empire continues to rank the second highest.
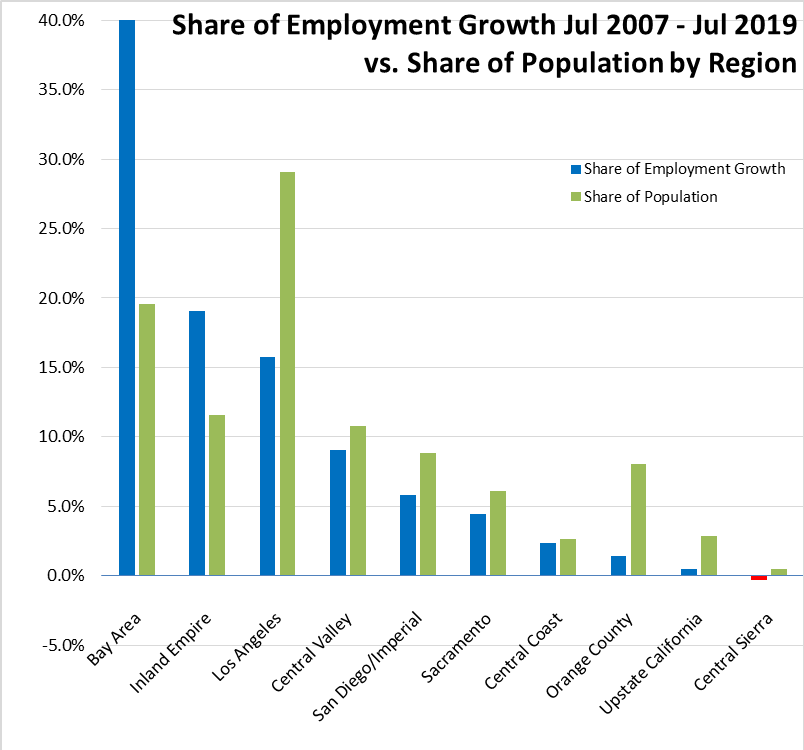
Figure Sources: California Employment Development Department; Department of Finance
MSAs with the Worst Unemployment Rates
Of the 20 Metropolitan Statistical Areas (MSAs) with the worst unemployment rates in June 2018, 9 are in California, including El Centro MSA (Imperial County) with the second highest unemployment rate in the country and Visalia-Porterville MSA with the third worst.
| wdt_ID | MSA | Unemp. | Rank |
|---|---|---|---|
| 1 | El Centro MSA | 18.6 | 388 |
| 2 | Visalia-Porterville MSA | 9.1 | 387 |
| 3 | Merced MSA | 8.1 | 386 |
| 4 | Bakersfield MSA | 8.0 | 385 |
| 5 | Hanford-Corcoran MSA | 7.9 | 384 |
| 6 | Fresno MSA | 7.1 | 383 |
| 7 | Madera MSA | 7.0 | 382 |
| 8 | Yuba City MSA | 6.7 | 380 |
| 9 | Modesto MSA | 6.5 | 379 |
Figure Source: US Bureau of Labor Statistics, June 2018 data
Chart of the Month: Self Employed
As a means to fulfill the dream of “becoming one’s own boss,” self-employment can be a path to upward mobility, a way to gain more flexibility in working hours and conditions, or as an alternative when other employment alternatives are limited by availability, commuting distances, or skills requirements. Self-employment also is an indicator of overall entrepreneurial activity within the economy.
The chart below compares the self-employment rate for California to the rest of the US. The self-employed data is taken from the Current Population Survey as a 12-month moving average and expressed as a percentage of total civilian population (age 16 and over).
The data contains the following components:
• The data is only for self-employed as the main job. In addition, a number of workers also engage in self-employment as a second job, either for income purposes or as a step towards leaving wage and salary employment and becoming self-employed full time.
• The data contains two levels of self-employed. The unincorporated are the component generally treated as the self-employed within the labor force numbers. Incorporated are those self-employed who have formed a corporation for tax or liability purposes. These generally have higher incomes, are treated as wage and salary workers in the other employment data series (as they generally take a wage or salary from their corporation), and often have other paid workers.
Measured by incorporated self-employed—a source of future economic expansion as small firms grow—California shows no major difference from the other states in spite of its reputation as an entrepreneurial leader. By numbers, however, California’s performance does not stack up as well. Although increasing over the past 12 months, the number of incorporated self-employed remains 5.3% below the recent high reached in 2017. Incorporated self-employed elsewhere in the US continued to grow in this period by a total of 8.5%.
The number of unincorporated self-employed is relatively much higher in California, producing the higher total rates for the state compared to the rest of the US. The total numbers, however, in both cases are well below the peaks reached prior to the recession, with California 10.4% below the peak reached in 2007 and the rest of the US 10.5% below the peak in 2005.
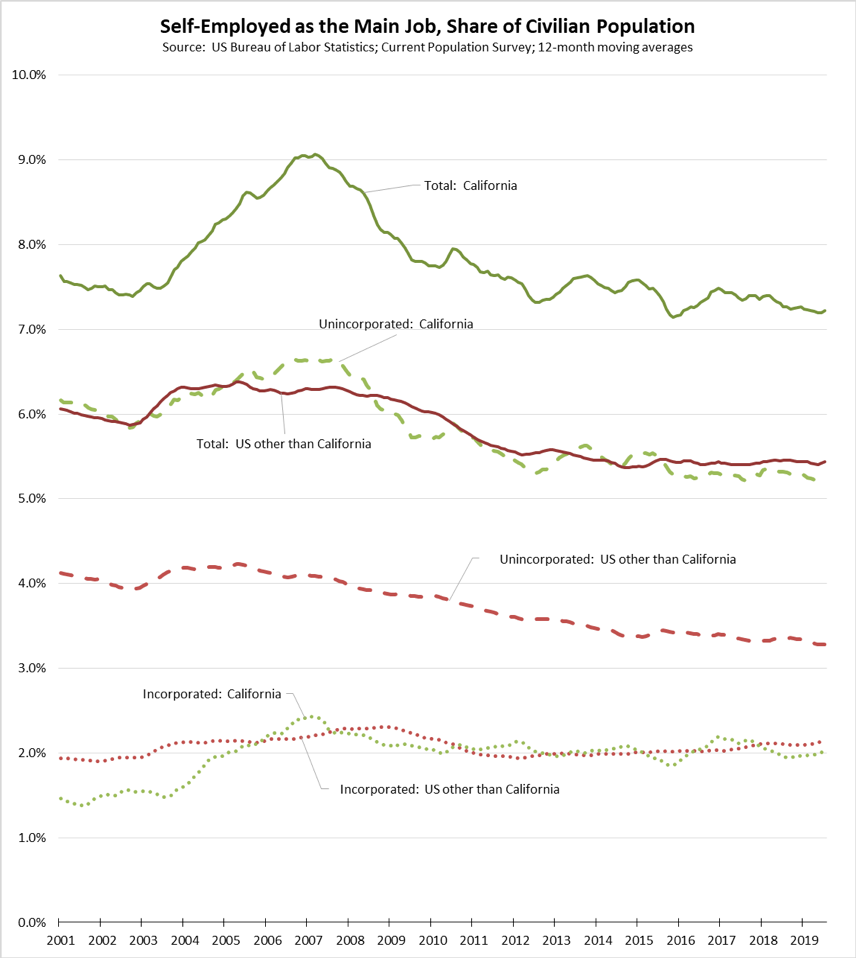
Source: US Bureau of Labor Statistics; Current Population Survey; 12-month moving averages