Highlights for policy makers:
- COVID-19 and the State Economy
- Unemployment Rate Improves; Employment Up 153,700
- Labor Force Participation Rate Down to 60.2%
- Employment Growth Ranking
- Nonfarm Jobs Up 140.4k
- Jobs Change by Industry
- Unemployment Rates by Region (not seasonally adjusted)
- Unemployment Rates by Legislative District (not seasonally adjusted)
- How Far Back Has the Economy in Each County Been Pushed?
- Employment Share by Region
- MSAs with the Worst Unemployment Rates: Los Angeles Drops to 9th Worst in Nation
COVID-19 and the State Economy
The July numbers show positive movement for the state economy considered in terms of both employment and jobs, but the relatively low gains reflect that the fact that the data was gathered during a week of reversals in business openings. These numbers as in the period since March provide more a snapshot of the economy during the week of July 12th when the core surveys were done. With conditions continuing to shift rapidly, the monthly economic data continues to lag behind the actual situation in the state.
July Numbers in Context: Technical Issues. The core data surveys continue to experience technical issues related to the current crisis situation, although the overall effect on the numbers has been diminishing. The response rate for the household survey used for the labor force estimates remained low, although still at a statistically acceptable level. The response rate for the establishment survey used in the jobs estimates, however, was higher than the average for 2019. Misclassification of unemployed persons is still an issue, but with a much smaller potential effect on the published numbers—accounting for this factor would have raised the (unadjusted) unemployment rate by up to 0.8 point.
July Numbers in Context: Survey Timing. The surveys behind the labor force and jobs estimates were done the week of the 12th. Actions affecting these numbers both prior to and following the surveys include:
The outcome of these actions is reflected in the weekly initial claims for unemployment insurance, combining claims under the regular program and the Pandemic Unemployment Assistance (PUA) program for the self-employed. As indicated in the chart below (claims are indexed to the week of May 9, the first week after the initial upsurge in PUA claims), total claims had been leveling off through the first week in July, then began growing as employers were subject to reclosure. Claims again dropped as this new spike was processed through the system, but then began growing again in the most recent data as the county watchlist grew. While the unemployment rate for July improved, the initial claims indicate it was quickly overtaken by subsequent actions.
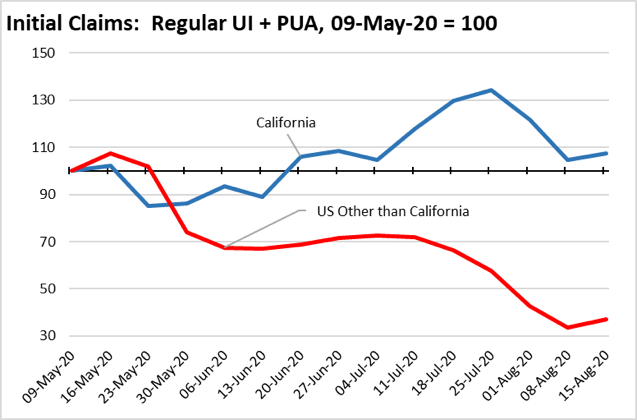
Much of the current unemployment flows appears to be coming from a second wave of layoffs and furloughs. A recent Cornell-JQI-RIWI survey done the last week of July reported that nationally, 31% of surveyed workers indicated that they have been laid off a second time, and another 26% indicated their employers have told them they may be laid off again. An earlier report from California Policy Lab calculated that in the week ending July 25th, 57% of regular initial claims in California were additional claims—claims that were reopened after a temporary return to work—compared to just over 40% before the crisis and about 5% at the peak of the crisis.
July Numbers in Context: What They Mean to Longer Term Recovery. Half of the improvement in the state’s unemployment rate was purely statistical as workers continued to leave the labor force. Overall, the labor force participation rate in July (seasonally adjusted) was 60.2% compared to 62.6% in February, a difference of an additional 750,000 workers not included in the calculations. As with the prior, Great Recession, the drop in the labor force also has been deeper than for the rest of the US.
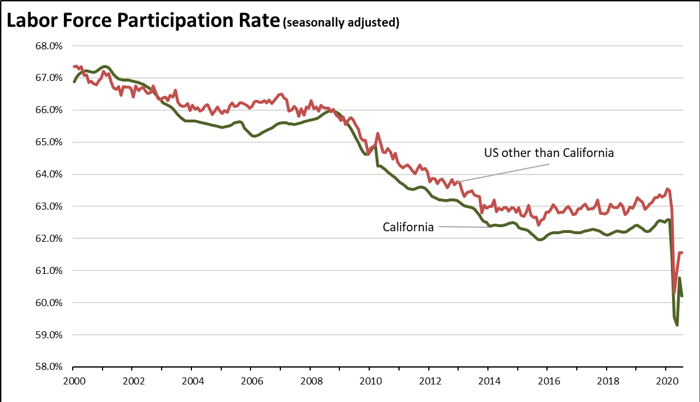
Viewed from this perspective, employment in California in fact never fully recovered from the Great Recession. While employment overall exceeded the pre-2008 highs, adjusting for lower labor force participation levels, the total was still 670,000 short of where it should have been in February prior to the current crisis. As shown in the figure above, labor force participation was rising in recent years—more strongly in the rest of the US than in California—due to strong jobs growth that was finally bringing many workers back in. But this trend was cut off abruptly by the emergency closures that began in March.
Participation rates have a key influence on wage and income equality. Households with two earners are substantially more likely to be earning incomes capable of dealing with California’s high costs. Nationwide, the profile of households below the official poverty level shows nearly six times as many with only one wage earner compared to those with two. And the longer a worker remains unemployed or outside the labor force, the higher the likelihood their skills and employability will become dated, and re-entry into the labor force will be at lower wage levels than what workers with a more current employment history are able to secure. Policies that assist workers when few other options are available such as the recent unemployment supplements have benefits as an immediate response to a crisis. The absence of policies that then would get them back to work as quickly as possible—policies to accelerate the recovery—has more serious implications to lifetime income potential in the long run, as was the case during the slow recovery from the 2008 Great Recession.
The duration of unemployment is growing in the current crisis. Nationally in July, the share of workers unemployed for 15 weeks or longer jumped to 48.8% from 18.7% in June. Average duration went to 17.9 weeks from 15.7. Extended unemployment has implications to lifetime earnings potential as above. And this trend may continue in the absence of policies to accelerate recovery. Several recent working papers analyzing consumer spending patterns have found only limited rebounds in those states lifting restrictions, focused primarily on essential businesses and with continuing high savings rates.
The nature of the current crisis and many of the government responses to date have contributed to the declining participation rate. Workers necessarily are concerned with returning to situations where they may be subject to exposure to the virus. The continuing uncertainty over school arrangements places additional pressure on parents as well. The absence of job opportunities as businesses remain closed or in reduced operating mode combined with the recent close-open-reclose cycle has made job hunting an iffy proposition at best for many particularly for those in lower wage occupations. The previous high level of the supplemental unemployment insurance amounts made it possible for many workers to have higher incomes through this source than through wage and salary employment—in the recently resumed Small Business Pulse Survey, 10.3% of California small businesses (less than 500 employees) reported difficulty in rehiring furloughed or laid off employees as a barrier to resuming normal operating levels, and 16.2% reported availability of employees overall as a barrier.
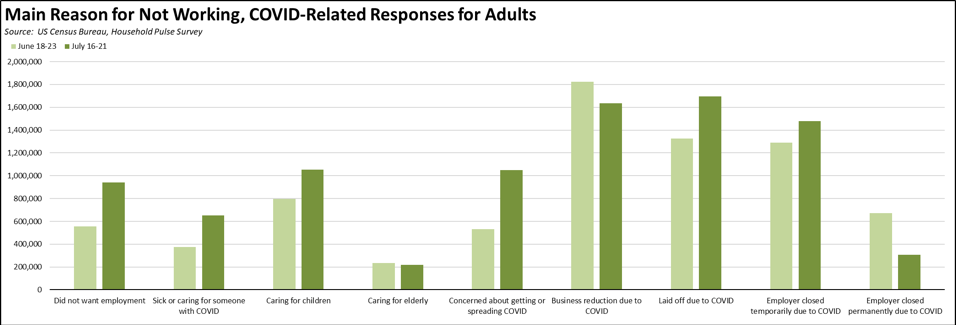
The degree of many of these factors can be illustrated through the Household Pulse Survey being conducted by the Census Bureau and other federal statistical agencies. About 57% of adults reporting as not working cite a COVID-related reason, distributed as shown in the chart. Layoffs related to the current emergency continue to be the primary reason both after the openings in early June and in the most recent data coming after the reclosures in early July. Voluntary separations from the labor force, however, are rising in particular for those concerned with becoming exposed to the virus and parents having to take care of children as schools and day care slots remain closed.
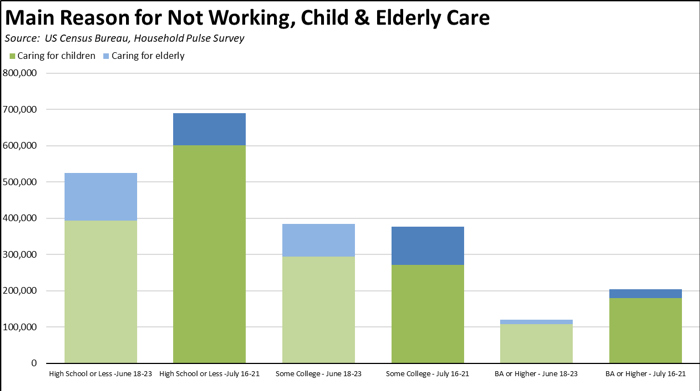
Those outside the labor force for child and elder care purposes, however, are heavily concentrated among adults with a high school diploma or less. Workers with a higher level of educational attainment are more likely in the current circumstances to have telecommuting as an option and are able to balance work and dependent care responsibilities even in the current crisis. Workers with the lower educational attainment levels are more likely to be in occupations where telecommuting is not an option due to the nature of their work, or for the many who could still do their jobs through this arrangement are not doing so due to the complexity of the state’s wage and hour laws combined with the substantial penalty risks employers face under PAGA for even minor violations. In the absence of state policy changes that would allow broader availability of telecommuting for the lower wage occupations, this issue is likely to be a growing factor reducing the state’s participation rate further as the schools start either through remote learning or uncertain open schedules.
Recession Tracking. Comparing the situation in July with the numbers from a year ago, industries more heavily affected by the closures continue to show the greatest contractions, with industries having higher telecommuting potential showing more resiliency in the current situation. Within this chart, note that “employment” is the number of persons age 16 and over working, including wage & salary jobs, self-employment, and non-paid family workers in the civilian workforce. “Jobs” are the number of wage & salary jobs, with individual workers holding one or more of these jobs.
As indicated below, job numbers were below the 2019 levels in all but 2 industries, with the greatest contraction in lower wage Leisure & Hospitality where jobs are still below by about a third during what is typically the highest activity period for this industry.
Where the information is available, average hourly earnings rose in all industries. These numbers do not necessarily represent wage growth but instead likely reflect the fact that layoffs have generally affected lower wage workers more heavily. The averages went up because the lower wages were cut more proportionally.
Average weekly hours were relatively unchanged. The recently resumed Small Business Pulse Survey indicates that small businesses have been more likely to keep the number of hours worked unchanged (74.2%), but a significant portion (18.9%) report reducing hours worked in the latest results for the first week of August.
Source: US Bureau of Labor Statistics
Other COVID Effects: Migration. An increasing number of media reports including anecdotal reports from real estate agents in other states suggest more households are leaving California during the current crisis. The reasons cited cover a number of issues particularly when comparing the Bay Area to Southern California, but what is common is an apparent shift to migration by higher income households. The IRS tax return data shows that historically, migration out of the state has been dominated by middle and lower middle income households seeking better jobs and housing opportunities, while migration into the state has been at higher income levels, particularly by those with the tech industry skills not produced in sufficient numbers by the state’s schools. The COVID crisis may be changing this pattern.
One way to assess the level of out-migration is through the DMV vehicle registration data. There are many reasons why the numbers may vary from month to month. Updating registrations are also not immediately done as people move. But the overall trend has been a decline in the numbers over the past several months.
Comparing the registration data between December and July combined with population and vehicles per household from the American Community Survey produces the estimates shown in the figure. This exercise results in an estimate of up to 670,000 persons moving from the state, with out-migration heavily concentrated in the Bay Area and Los Angeles County. While using the Current Population Survey to do a similar estimate is difficult due to the fact the survey sample is based on population estimates, this source also indicates a net out migration but at lower levels.
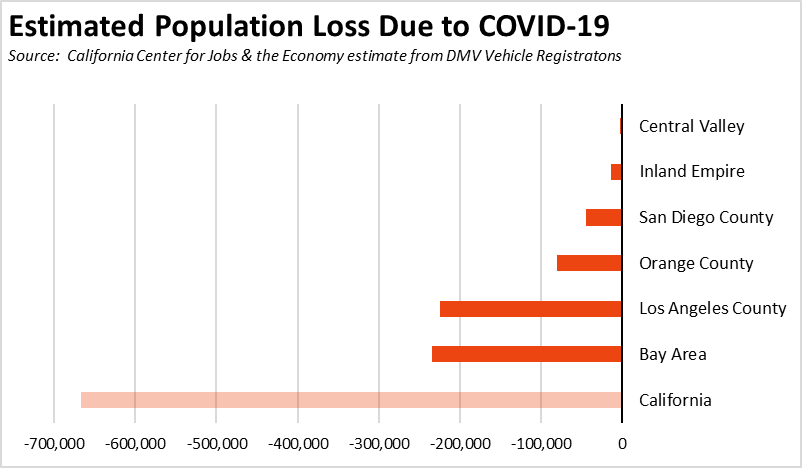
To put this estimate into context, California has experienced a net domestic out-migration since the 1990s. More people have moved to other states than people from other states moving here. In most years, however, this trend has been counter-balanced by immigration into the state from other nations. Net domestic migration in recent years saw an annual loss to other states of about 135,000, increasing to 190,000 in the most recent 2018 numbers. Prior peak net domestic migration was just shy of a loss of 300,000 in 2005 from the American Community Survey data, and based on IRS data, 330,000 in 1994. If the DMV data accurately reflects the current situation, migration losses so far this year may be up to double these prior peaks.
The shift in income levels has important implications to state policies. Using the most current Franchise Tax Board personal income data without any adjustments, migration at close to the median household income level (about $75,000) would mean a net loss of $0.4 billion to the General Fund. At twice the median, the loss would grow to $1.9 billion annually. If closer to the income levels contained in the media reports, the potential loss would range from $3.2 to $5.2 billion. These amounts would just be from the state income tax, and do not include additional amounts from sales tax, related business income, and other taxes and fees.
Unemployment Rate Improves; Employment Up 153,700
EDD reported total employment (seasonally adjusted; July preliminary) rose 153,700 from the revised June numbers, while the number of unemployed dropped by 320,800. The reported unemployment rate improved 1.6 points to 13.3%. The unadjusted rate was off 9.3 points from the year earlier at 13.7%.
California had the 6th highest unemployment rate among the states.
Total US employment saw a seasonally adjusted gain of 1,350,000, with the number of unemployed dropping by 1,412,000. The reported unemployment rate dropped 0.9 point to 10.2%.
Figure Sources: California Employment Development Department; US Bureau of Labor Statistics
Labor Force Participation Rate Down to 60.2%
California’s seasonally adjusted labor force participation rate dropped to 60.2%. Nationally, the participation rate dipped to 61.4%.
For the 12 months ending July 2020, the seasonally adjusted data shows the California labor force was down 576,900 workers (-3.0% loss) compared to the rest of the US loss of 2,926,100 (-2.0%). The reported unemployment rates also have to be viewed in the context that large numbers of workers no longer are in the labor force.
Employment Growth Ranking
The total number of persons employed (seasonally adjusted) over the 12 months ending in July plunged by 2,315,400. California had the lowest level among the states in terms of absolute employment loss over the year.
Adjusted to account for differences in the size of each state economy, California over the year showed a 12.4% contraction, far deeper than for the rest of the US with a loss of 8.3%. Ranked among the states, California had the 5th worst loss rate.
Figure Source: US Bureau of Labor Statistics
Nonfarm Jobs Up 140.4k
Nonfarm jobs (seasonally adjusted) rose 140,400 as June’s seasonally adjusted gains were revised to 542,500 from the previously reported 558,200.
With the reported gains slowing, nonfarm jobs remained down 1,643,600 over the year. Adjusting for population size, California loss rate was 42nd among the states, with a 12-month jobs loss rate of -9.4% compared to the rest of the US at -7.3%.
Figure Sources: California Employment Development
Department; US Bureau of Labor Statistics
Jobs Change by Industry
In the unadjusted numbers that allow a more detailed look at industry shifts, all but 2 industries continued to post job losses over the 12-month period. Utilities as an essential service and Finance & Insurance with a high incidence of telework opportunities again were positive although largely unchanged.
Industries showing the greatest contractions were led by Food Services, Government, and Arts, Entertainment & Recreation.
| Not Seasonally Adjusted Payroll Jobs (1,000) | July 2020 | 12-month change | Nonfarm Growth Rank | % 12-month Change | Avg. Annual Wage |
|---|---|---|---|---|---|
| Total Farm | 383.5 | -86.3 | -18.4% | $35.5k | |
| Mining & Logging | 22.3 | -0.9 | 3 | -3.9% | $119.5k |
| Construction | 848.3 | -56.2 | 12 | -6.2% | $72.5k |
| Manufacturing | 1,230.0 | -100.2 | 14 | -7.5% | $97.1k |
| Wholesale Trade | 653.4 | -43.3 | 9 | -6.2% | $80.4k |
| Retail Trade | 1,490.2 | -153.5 | 19 | -9.3% | $37.7k |
| Utilities | 56.8 | 0.5 | 2 | 0.9% | $137.0k |
| Transportation & Warehousing | 615.4 | -29.5 | 7 | -4.6% | $62.0k |
| Information | 513.8 | -40.9 | 8 | -7.4% | $188.7k |
| Finance & Insurance | 547.8 | 6.7 | 1 | 1.2% | $133.0k |
| Real Estate & Rental & Leasing | 292.8 | -13.2 | 4 | -4.3% | $71.2k |
| Professional, Scientific & Technical Services | 1,294.6 | -51.3 | 10 | -3.8% | $126.8k |
| Management of Companies & Enterprises | 242.6 | -13.3 | 5 | -5.2% | $135.1k |
| Administrative & Support & Waste Services | 1,029.2 | -100.4 | 15 | -8.9% | $47.3k |
| Educational Services | 329.4 | -20.8 | 6 | -5.9% | $56.0k |
| Health Care | 1,527.6 | -53.5 | 11 | -2.2% | $69.6k |
| Social Assistance | 782.2 | -57.4 | 13 | -6.8% | $20.9k |
| Arts, Entertainment & Recreation | 201.2 | -143.2 | 18 | -41.6% | $60.0k |
| Accommodation | 138.6 | -105.1 | 16 | -43.1% | $39.7k |
| Food Services | 1,098.9 | -382.4 | 21 | -25.8% | $24.1k |
| Other Services | 462.7 | -118.9 | 17 | -20.4% | $41.9k |
| Government | 2,291.7 | -164.6 | 20 | -6.7% | $72.0k |
| Total Nonfarm | 15,669.5 | -1,641.4 | -9.5% | ||
| Total Wage & Salary | 16,053.0 | -1,727.7 | -9.7% | ||
Figure Source: California Employment Development Department;
Wages based on most recent Quarterly Census of Employment & Wages
Unemployment Rates by Region (not seasonally adjusted)
Regions with jobs providing greater telework options—both due to the nature of the jobs and under the state’s regulations—including the Bay Area, Orange County, and Sacramento saw somewhat lower unemployment rates. Regions with higher concentrations of lower wage jobs including the Central Valley and Los Angeles had much higher rates.
| wdt_ID | Region | Unemployment Rates |
|---|---|---|
| 2 | California | 13.7 |
| 6 | Bay Area | 10.6 |
| 10 | Upstate California | 11.3 |
| 14 | Central Coast | 11.3 |
| 18 | Sacramento | 11.5 |
| 22 | Central Sierra | 11.5 |
| 26 | Orange County | 12.3 |
| 30 | San Diego/Imperial | 12.9 |
| 34 | Inland Empire | 13.4 |
| 38 | Central Valley | 14.7 |
| 39 | Los Angeles | 17.3 |
Figure Source: California Employment Development Department
Unemployment Rates by Legislative District (not seasonally adjusted)
Lowest
| wdt_ID | Congressional District | Unemployment Rate |
|---|---|---|
| 2 | CD18 (Eshoo-D) | 7.8 |
| 3 | CD17 (Khanna-D) | 9.1 |
| 4 | CD02 (Huffman-D) | 9.6 |
| 5 | CD24 (Carbajal-D) | 9.9 |
| 6 | CD52 (Peters-D) | 9.9 |
| 7 | CD49 (Levin-D) | 9.9 |
| 9 | CD15 (Swalwell-D) | 10.2 |
| 10 | CD12 (Pelosi-D) | 10.3 |
| 12 | CD04 (McClintock-R) | 10.3 |
| 13 | CD14 (Speier-D) | 10.4 |
| wdt_ID | Senate District | Unemployment Rate |
|---|---|---|
| 2 | SD13 (Hill-D) | 8.4 |
| 3 | SD01 (Dahle-R) | 9.7 |
| 4 | SD15 (Beall-D) | 9.9 |
| 5 | SD02 (McGuire-D) | 10.0 |
| 6 | SD10 (Wieckowski-D) | 10.1 |
| 7 | SD39 (Atkins-D) | 10.3 |
| 8 | SD36 (Bates-R) | 10.3 |
| 9 | SD03 (Dodd-D) | 10.7 |
| 10 | SD17 (Monning-D) | 10.9 |
| 11 | SD19 (Jackson-D) | 11.0 |
| wdt_ID | Assembly District | Unemployment Rate |
|---|---|---|
| 2 | AD28 (Low-D) | 8.0 |
| 3 | AD16 (Bauer-Kahan-D) | 8.2 |
| 4 | AD22 (Mullin-D) | 8.5 |
| 5 | AD24 (Berman-D) | 8.3 |
| 6 | AD04 (Aguiar-Curry-D) | 9.9 |
| 7 | AD10 (Levine-D) | 9.3 |
| 8 | AD25 (Chu-D) | 9.1 |
| 9 | AD06 (Kiley-R) | 9.0 |
| 10 | AD78 (Gloria-D) | 9.6 |
| 11 | AD77 (Maienschein-R) | 10.0 |
Highest
| wdt_ID | Congressional District | Unemployment Rate |
|---|---|---|
| 2 | CD21 (Cox-D) | 17.5 |
| 3 | CD28 (Schiff-D) | 18.1 |
| 4 | CD32 (Napolitano-D) | 18.1 |
| 5 | CD43 (Waters-D) | 19.3 |
| 6 | CD29 (Cardenas-D) | 19.0 |
| 7 | CD37 (Bass-D) | 18.3 |
| 9 | CD34 (Gomez-D) | 19.5 |
| 10 | CD51 (Vargas-D) | 20.6 |
| 12 | CD40 (Roybal-Allard-D) | 21.1 |
| 13 | CD44 (Barragan-D) | 23.5 |
| wdt_ID | Senate District | Unemployment Rate |
|---|---|---|
| 2 | SD32 (Archuleta-D) | 15.7 |
| 3 | SD22 (Rubio-D) | 16.6 |
| 4 | SD21 (Wilk-R) | 18.7 |
| 5 | SD18 (Hertzberg-D) | 19.0 |
| 6 | SD40 (Hueso-D) | 18.8 |
| 7 | SD14 (Hurtado-D) | 18.8 |
| 9 | SD24 (Durazo-D) | 19.9 |
| 10 | SD33 (Gonzalez-D) | 20.4 |
| 12 | SD30 (Mitchell-D) | 20.4 |
| 13 | SD35 (Bradford-D) | 20.7 |
| wdt_ID | Assembly District | Unemployment Rate |
|---|---|---|
| 2 | AD32 (Salas-D) | 18.4 |
| 3 | AD48 (Rubio-D) | 18.5 |
| 4 | AD62 (Burke-D) | 18.8 |
| 5 | AD36 (Lackey-R) | 21.1 |
| 6 | AD46 (Nazarian-D) | 20.8 |
| 7 | AD56 (Garcia-D) | 19.7 |
| 9 | AD63 (Rendon-D) | 22.0 |
| 10 | AD51 (Carrillo-D) | 22.3 |
| 12 | AD64 (Gipson-D) | 22.6 |
| 13 | AD59 (Jones-Sawyer-D) | 23.3 |
How Far Back Has the Economy in Each County Been Pushed?
As an indication of the severity of the current economic downturn, the following chart illustrates how much economic ground each county has lost using employment levels as the measure. Based on annual averages, the chart below indicates the last year each county saw the July employment numbers. Because the current series only goes back to 1990 for most counties, several of the entries indicate “Before 1990.” Los Angeles County is the exception, with data going back to 1976. The “Change” column indicates the change from April, the month reflecting the effects of the initial round of closures.
| wdt_ID | County | Last Year Employment Equal To or Less Than April | Last Year Employment Equal to or Less Than July | Change |
|---|---|---|---|---|
| 2 | Alameda County | 2009 | 2011 | 2 |
| 3 | Alpine County | 2009 | 2009 | 0 |
| 4 | Amador County | 1997 | 1997 | 0 |
| 5 | Butte County | 1998 | 1999 | 1 |
| 6 | Calaveras County | 2012 | 2013 | 1 |
| 7 | Colusa County | 1999 | 2004 | 5 |
| 8 | Contra Costa County | 1997 | 2011 | 14 |
| 9 | Del Norte County | 1992 | Before 1990 | ﹤ |
| 10 | El Dorado County | 1999 | 2012 | 13 |
| 11 | Fresno County | 2012 | 2013 | 1 |
| County | Last Year Employment Equal To or Less Than April | Last Year Employment Equal to or Less Than July | Change |
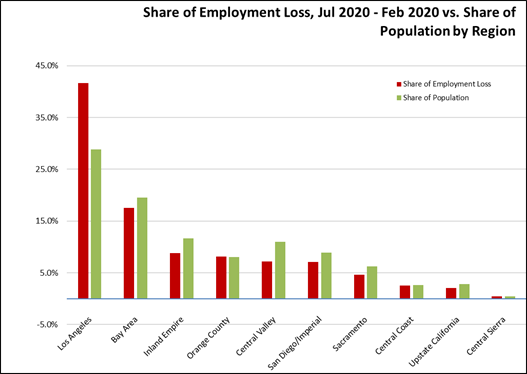
Employment Share by Region
The following chart compares change in employment (compared to pre-Covid February 2020) vs. population share as a measure of the disparate economic effects from the social distancing measures. Los Angeles Region, which experienced relatively greater job creation in lower income, population-serving and tourism industries during the recently ended expansion period, has to date sustained a commensurate far greater relative and absolute employment loss in the current economic downturn. Regions such as the Bay Area and San Diego with a greater incidence of jobs amenable to telework have been slightly less impacted. Regions such as the Central Valley and Inland Empire with a higher degree of essential businesses but also effects from seasonal factors have shown somewhat greater resiliency.
MSAs with the Worst Unemployment Rates: Los Angeles Drops to 9th Worst in Nation
The number of California MSAs among the 20 regions with the worst unemployment rates in June rose to four. As a result of a pattern of jobs growth in recent years that concentrated on lower wage, population-serving and tourism service industries in Los Angeles County, Los Angeles-Long Beach-Anaheim MSA (Los Angeles and Orange Counties) fell to the 9th worst in the nation.
| wdt_ID | MSA | June Unemployment Rate | US Rank out of 389 |
|---|---|---|---|
| 1 | El Centro MSA | 27.3 | 388 |
| 2 | Los Angeles-Long Beach-Anaheim MSA | 18.1 | 381 |
| 3 | Bakersfield MSA | 17.5 | 375 |
| 4 | Visalia-Porterville MSA | 17.2 | 374 |