Highlights for policy makers:
- COVID-19 and the State Economy
- Jobs by Wage Level
- CaliFormer Businesses: Update
- Population Shifts from the 2020 Census
- Housing in the 2020 Census
- Employment 1.094 Million Below Recovery
- Labor Force Participation Rate
- Nonfarm Jobs: 1.132 Million Below Recovery
- Jobs Change by Industry
- Employment Recovery by Region
- Unemployment Rates by Legislative Districts
- Unemployment Rates by Region
- MSAs with the Worst Unemployment Rates
COVID-19 and the State Economy
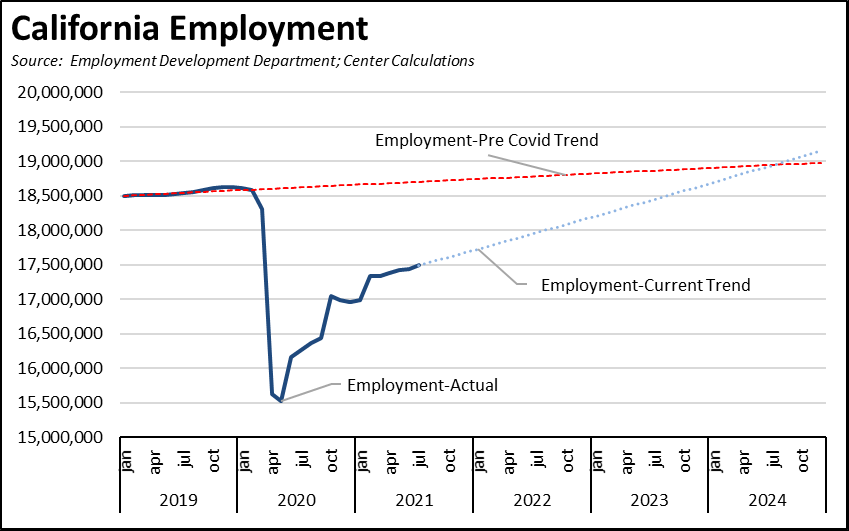
While both the jobs and employment numbers have been better in recent months, they are not yet at levels that would see quick recovery in the state economy. As indicated in the charts below, the state has moved off the initial bounce from the depths of the downturn. The pace in recent months has been positive, but that comes from looking at the numbers in isolation, not what they mean to the overall health of the California economy and its workers. Just continuing at the rates experienced over the past 3 months would not return nonfarm jobs to pre-Covid trend levels until mid-2023. The slower rate being experienced for employment would take an additional year. Recent job numbers have been good, but have they been good enough from this perspective?
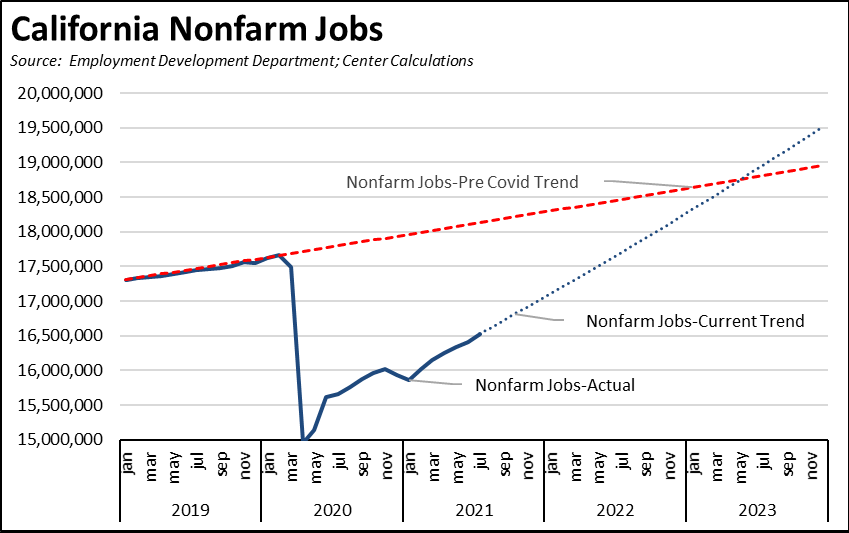
It still is far from certain whether the current trends will continue. The Nonfarm Jobs Current Trend line would require the state to add around 100,000 jobs monthly over the next two years. Those numbers are possible now simply by the state allowing businesses to reopen—they reflect more the lifting of restrictions that were more severe here than in other states rather than an internal dynamic. The ability to maintain this pace raises other issues.
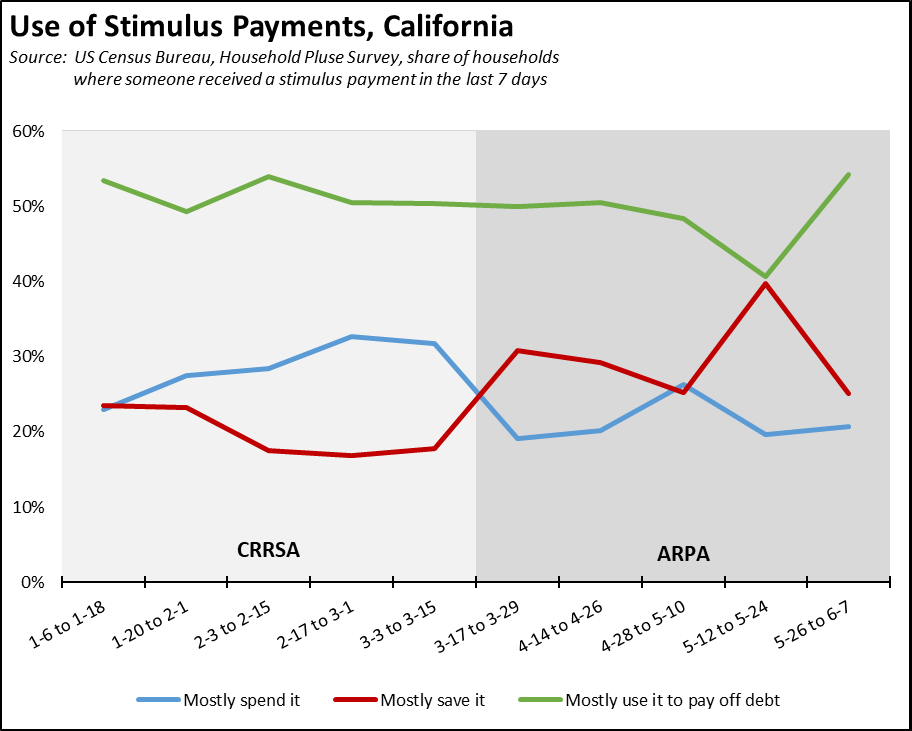
There are a number of positive factors in play. While the various stimulus payments were intended to have an expansionary effect, most households instead used these funds for savings, investments, and to pay off debt rather than to maintain consumption levels. Combined with rapid shifts to telecommuting that shielded many from economic harm during the pandemic, most households are consequently in a better financial position than in prior downturns and better positioned to support the recovery phase. The negative effects of the state’s policies instead continue to be concentrated heavily on lower income households to a much higher degree than in prior recessions.
New business formations have also seen a rebound. Self-employment especially in other states has become an option for many unemployed as they start their own businesses. From the Secretary of State data, the number of new business registrations in the first half of 2021 for California was just over 240,000, compared to just over 161,000 in the same period in pre-pandemic 2019.
There is also potential for additional fiscal stimulus. Even while Congress considers adding trillions more, a recent GAO report concluded that nationally $1 trillion of currently approved stimulus funds have yet to be spent.
But the fact that so much spending authority has already backed up in the system is a clear indication that reliance on neo-Keynesian fiscal solutions alone will not improve the current results. As stated by one commenter, “. . . little attention is being paid to making things work, rather than making them exist.” In California, this outcome is reflected in the continuing dysfunction and fraud levels within the unemployment insurance program. Begun in March, the state’s $5.2 billion rent relief program to date has disbursed only $320 million against $1.2 billion in requested relief, while local programs have encountered comparable delays such as in Los Angeles where the current pace of processing applications likely means it will take 18 months to complete issuing the available funds. Today’s release of the State Auditor Report on the $316 million Emergency Solutions Grant for homelessness programs indicates delays have been so severe that the state risks losing a sizeable portion of these funds and for those funds that have been allocated, has put no system in place to determine how they are being spent. Without accompanying regulatory and structural reforms, the pending federal infrastructure bill is likely to do little better in creating jobs within the recovery period than the comparable American Recovery and Reinvestment Act did beginning in 2009. The state’s continued focus on mass transit rather than road investments may preserve some government and create some construction jobs in the process, but will do little to support the broader jobs base over a longer term—even prior to the pandemic, Department of Transportation data shows quarterly mass transit ridership plunging 15.5% between 2015 and 2019 in California, and through the second quarter of 2021, collapsing 63.2% compared to the previous high.
There are positive factors in play, but they affect primarily the portion of the economy that has not only survived but in some cases managed to thrive during the state restrictions. For that segment hardest hit during the pandemic period—both employers and workers—the primary response to date is to get into yet another line and wait.
The current reliance on fiscal policy as the economic driver carries risks to the future jobs and employment trends, not least of which is the demonstrated limits of government structures to absorb and properly allocate new funding at the levels contained in both approved and proposed spending. Consideration must also be given to the micro factors.
The current trends are also subject to many uncertainties, of which the growing effect of the Delta variant and the proliferation in a new round of restrictions are only the most pressing at the moment. Contributing to the uncertainty are other factors, including: (1) continuing supply disruptions coming from trade and transport congestion and related effects on production levels for many goods; (2) labor shortages in many key parts of the economy and far slower recovery in the California labor force than in other states; (3) resulting inflationary pressures which in California are exacerbated by the continuing rise in energy, housing, and other essentials due to state policies; (4) growing labor and other regulatory barriers that hinder small business development, especially the persistent threat of PAGA (Private Attorney General Act); and (5) the extent to which prior automation and other workplace and sales channel trends affecting jobs have been accelerated in the current circumstances. In addition, while the recently acted portions of the state budget include measures to assist in small business reopening, these are being dwarfed by the cost of automatic state and federal tax increases coming from the failure to date to address the state’s growing unemployment insurance fund debt.
Jobs by Wage Level
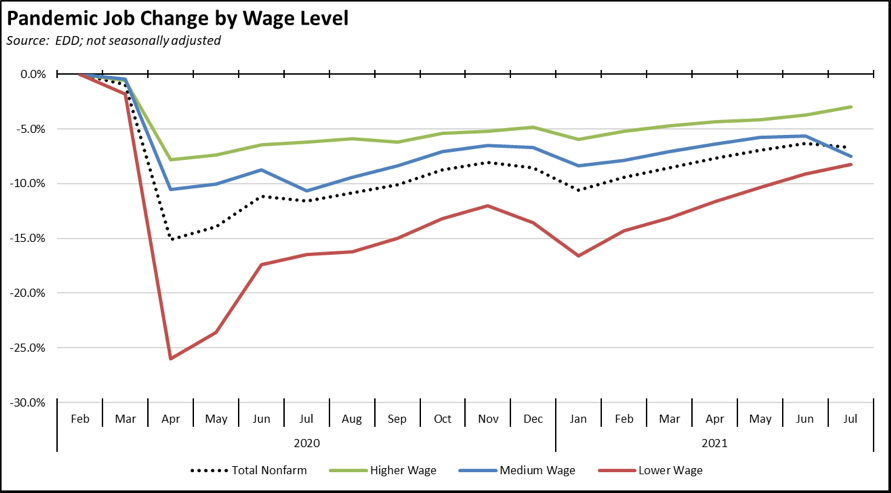
The July change in jobs by wage level was mixed. The lower and higher wage industries both evidenced a similar relative increase, but the overall recovery status for lower-wage jobs continues to lag. Middle wage jobs showed a decline due to the seasonal change in schools employment, while the unadjusted numbers for total nonfarm jobs also were down—a drop of 59,000 jobs compared to the 114,400 statistical gain reported in the headline numbers.
In the chart, higher wage jobs are those industries with average annual wages above $100,000; medium wage is $50,000 to $100,000; and lower-wage is below $50,000. Job data is drawn from the industry classifications, unadjusted job numbers, and wage levels generally used in the regular report section below on Nonfarm Jobs.
CaliFormer Businesses: Update
Additional CaliFormer companies identified since our last monthly report are as follows. These companies include those that have announced: (1) moving their headquarters or full operations out of state, (2) moving business units out of state (generally back office operations where the employees do not have to be in a more costly California location to do their jobs), (3) California companies that expanded out of state, and (4) companies turning to permanent telework options, leaving it to their employees to decide where to work and live.
| wdt_ID | Companies | From | To | Reason | Source | Year |
|---|---|---|---|---|---|---|
| 167 | 1Life Healthcare Inc. | San Francisco | Atlanta | Expansions | Read More | 2021 |
| 168 | Aatonomy | San Francisco | Houston | HQ move | Read More | 2018 |
| 169 | Abyss Creations | San Marcos | Las Vegas | HQ move | Read More | 2021 |
| 170 | Adlucent | Irvine | Austin | HQ move | Read More | 2019 |
| 171 | AFC Finishing Systems | Oroville | Idaho | HQ move | Read More | 2020 |
| 172 | AgencyKPI Inc. | Los Angeles | Austin | HQ move | Read More | 2020 |
| 173 | Aging 2.0 | San Francisco | Louisville | HQ move | Read More | 2020 |
| 174 | Airbrake Technologies | San Francisco | Austin | HQ move | Read More | 2020 |
| 175 | Alfresco Software Inc. | San Mateo | Massachusetts | HQ move | Read More | 2019 |
| 176 | Alpha Paw LLC | San Francisco | Austin | HQ move | Read More | 2021 |
| 177 | Alpine Technologies | Torrance | Michigan | HQ/manufacturing move | Read More | 2019 |
| 178 | Alto Pharmacy | San Francisco | Denver | HQ2 | Read More | 2018 |
| 179 | Andamiro USA Corp | Gardena | Texas | HQ move | Read More | 2021 |
| 180 | Anpac Bio | San Jose | Philadelphia | HQ move | Read More | 2019 |
| 181 | Aqua Metals Inc. | Alameda | Reno | HQ/manufacturing move | Read More | 2018 |
| 182 | Arcturus Aerospace | Oxnard | Arkansas | HQ/manufacturing move | Read More | 2020 |
| 183 | AtScale | San Mateo | Boston | HQ move | Read More | 2019 |
| 184 | Aviat Networks Inc. | Milpitas | Austin | HQ move | Read More | 2019 |
| 185 | Axiom Memory Solutions, Inc. | Irvine | Austin | HQ move | Read More | 2019 |
| 186 | Battle Motors Inc. | Venice | Ohio | EV truck manufacturing | Read More | 2021 |
| 187 | Bedrock Sandals | Richmond | Montana | HQ move | Read More | 2019 |
| 188 | BH North America | Los Angeles | Los Angeles | HQ move | Read More | 2018 |
| 189 | Callaway | Carlsbad | Salt Lake City | HQ move | Read More | 2020 |
| 190 | Canoo Inc. | Torrance | Texas, Oklahoma | EV manufacturing and HQ move | Read More | 2021 |
| 191 | Cicero Institute | San Francisco | Austin | HQ move | Read More | 2020 |
| 192 | Clean-Energy Corp. | Newport Beach | Texas | $1 billion solar power/battery manufacturing | Read More | 2021 |
| 193 | CodeBoxx | Sausalito | Florida | HQ move | Read More | 2021 |
| 194 | Cognito | Palo Alto | Oregon | HQ move | Read More | 2021 |
| 195 | Conner Logistics | Fresno | Kentucky | HQ move | Read More | 2021 |
| 196 | Crossfit LLC | Scotts Valley | Colorado | HQ move | Read More | 2020 |
| 197 | Daily Wire | Los Angeles | Nashville | HQ move | Read More | 2020 |
| 198 | DIQ SEO | Silicon Valley | Texas | HQ move | Read More | 2021 |
| 199 | DMG | Newport Beach | Ohio | HQ move | Read More | 2021 |
| 200 | EnerBlu Inc. | Riverside | Kentucky | HQ move | Read More | 2018 |
| 201 | Fantic USA | Sausalito | Denver | HQ move | Read More | 2019 |
| 202 | Flatirons Solutions | Irvine | Colorado | HQ move | Read More | 2018 |
| 203 | Fox Factory | Scotts Valley | Georgia | HQ/manufacturing move | Read More | 2018 |
| 204 | Ganymede Games | Alameda | New Mexico | HQ move | Read More | 2019 |
| 205 | GetSales | San Francisco | Austin | HQ move | Read More | 2018 |
| 206 | Gilad & Gilad | Los Angeles | Texas | HQ move | Read More | 2018 |
| 207 | Glock Store | San Diego | Nashville | HQ move | Read More | 2018 |
| 208 | Grinds LLC | Oakland | Indiana | HQ/manufacturing move | Read More | 2019 |
| 209 | GrowthPlug | San Jose | Oregon | HQ move | Read More | 2019 |
| 210 | GuineaDad | Los Angeles | North Las Vegas | HQ move | Read More | 2020 |
| 211 | H.E.R.O.S. Inc. | Santa Clarita | Arizona | HQ move | Read More | 2019 |
| 212 | Hall Technologies | Tustin | Texas | HQ and manufacturing move | Read More | 2021 |
| 213 | Haptx / Axon VR | San Luis Obispo | Washington | HQ move | Read More | 2021 |
| 214 | Honor Home Care (HQ2) | Concord | Austin | Second operations center | Read More | 2018 |
| 215 | Iron Ox | San Carlos | Texas | Second expansion | Read More | 2021 |
| 216 | IT Avalon | Brentwood | Reno | HQ move | Read More | 2021 |
| 217 | Joe Rogan Experience | Los Angeles | Austin | HQ move | Read More | 2020 |
| 218 | JRS Company | Covina | Texas | HQ/manufacturing move | Read More | 2018 |
| 219 | Juul Labs | San Francisco | DC | HQ move | Read More | 2020 |
| 220 | Keen Horse Training | Arcadia | Texas | HQ move | Read More | 2020 |
| 221 | Kinwoven | San Diego | Oklahoma | HQ move | Read More | 2020 |
| 222 | Lockheed Martin FBM | Sunnyvale | Florida | HQ move | Read More | 2019 |
| 223 | Lucid Group | Newark | Arizona | EV manufacturing expansion | Read More | 2021 |
| 224 | Maxar Technologies | San Francisco | Colorado | HQ move | Read More | 2018 |
| 225 | Miro | San Francisco | Austin | Expansion | Read More | 2021 |
| 226 | Misfits Gaming Group | Los Angeles | Louisiana | HQ move | Read More | 2020 |
| 227 | Montrose Environmental Group | Irvine | Arkansas | HQ move | Read More | 2021 |
| 228 | Mullen Technologies | Brea | Tennessee | 1.2 million sf ev manufacturing expansion | Read More | 2021 |
| 229 | Mutual UFO Network (MUFON) | Los Angeles | Cincinnati | HQ move | Read More | 2021 |
| 230 | National Hot Rod Association | Glendora | Indiana | HQ move | Read More | 2021 |
| 231 | Nexen Tire | Diamond Bar | Ohio | HQ move | Read More | 2021 |
| 232 | Nintendo | Redwood City | Washington/British Columbia | Consolidation | Read More | 2021 |
| 233 | OKIN BPS | Mountain View | San Antonio | HQ move | Read More | 2018 |
| 234 | Old Gringo Boots | San Diego | Fort Worth | HQ move | Read More | 2021 |
| 235 | Optimal Elite Management LLC | Santa Clara | Austin | HQ/manufacturing move | Read More | 2020 |
| 236 | PerceptIn | Santa Clara | Indiana | HQ move | Read More | 2019 |
| 237 | Plumas Bancorp | Quincy | Reno | HQ move | Read More | 2021 |
| 238 | Premier Displays & Exhibits Inc. | Cypress | Las Vegas | HQ move | Read More | 2019 |
| 239 | Prenexus Health | Brawley | Arizona | HQ/manufacturing move | Read More | 2018 |
| 240 | Promises Behavioral Health | Long Beach | Tennessee | HQ move | Read More | 2019 |
| 241 | Puroast Coffee Co. Inc. | Woodland | North Carolina | HQ move | Read More | 2021 |
| 242 | QQE Summit LLC | Newark | Ohio | HQ move/manufacturing expansion | Read More | 2020 |
| 243 | Quetico, LLC | Chino | Arizona | HQ/logistics center move | Read More | 2019 |
| 244 | RaceChip | Brea | Florida | HQ move | Read More | 2019 |
| 245 | Regroup Mass Notification | San Francisco | Dallas | HQ move | Read More | 2020 |
| 246 | RiceBran Technologies | West Sacramento | Houston | HQ move | Read More | 2018 |
| 247 | Samsung (revised) | San Jose | Texas | $17 billion chip-making plant | Read More | 2021 |
| 248 | Scollar | Santa Rosa | Kansas City | HQ move | Read More | 2019 |
| 249 | Shmoop University, Inc. | Mountain View | Arizona | HQ move | Read More | 2019 |
| 250 | ShutterFly, Inc. (HQ2) | Redwood City | Minnesota | HQ2 | Read More | 2020 |
| 251 | Simwon America Corp. | Lathrop | Texas | EV parts manufacturing | Read More | 2021 |
| 252 | Smartrise Engineering | Sacramento | Texas | HQ move | Read More | 2018 |
| 253 | Smarty-Pits | Tehachapi | Oregon | HQ move | Read More | 2021 |
| 254 | Solvd Health | Carlsbad | Chicago | HQ move | Read More | 2021 |
| 255 | Space Channel Inc. | Los Angeles | Texas | HQ move | Read More | 2021 |
| 256 | Suzuki Marine USA | Brea | Florida | HQ move | Read More | 2021 |
| 257 | Synergy Blue | Palm Desert | Las Vegas | HQ move | Read More | 2019 |
| 258 | Tachyum | San Jose | Nevada | HQ move | Read More | 2020 |
| 259 | Tailift Material Handling USA | Ontario | Houston | HQ move | Read More | 2021 |
| 260 | TCS Healthcare Technologies | Auburn | North Carolina | HQ move | Read More | 2021 |
| 261 | theBalm | Alameda | Reno | HQ move and distribution facility expansion | Read More | 2020 |
| 262 | TV4 Entertainment | Venice | Florida | HQ move | Read More | 2019 |
| 263 | Unstoppable Domains | San Francisco | Reno | HQ move | Read More | 2020 |
| 264 | Upstart Network Inc. (HQ2) | San Carlos | Ohio | HQ2 | Read More | 2019 |
| 265 | UroDev Medical | San Clemente | Minnesota | HQ move | Read More | 2021 |
| 266 | Waterlogic USA, Inc. | Concord | Texas | HQ move | Read More | 2019 |
| 267 | Weatherby Inc. | Paso Robles | Wyoming | HQ/manufacturing move | Read More | 2019 |
| 268 | Weiss Watch Co. | Torrance | Nashville | HQ/manufacturing move | Read More | 2020 |
| 269 | William Glen Inc. | Sacramento | Texas | HQ move | Read More | 2021 |
| 270 | Woodward Inc. | Duarte | Colorado | HQ/manufacturing move | Read More | 2018 |
| 271 | Xos Inc. | Glassell Park | Tennessee | EV truck manufacturing; battery manufacturing | Read More | 2020 |
| 272 | Yeezy | Calabasas | Wyoming | HQ move | Read More | 2020 |
| 273 | Zeiss Vision Care | San Diego | Kentucky | HQ move | Read More | 2021 |
| Companies | From | To | Reason | Source | Year |
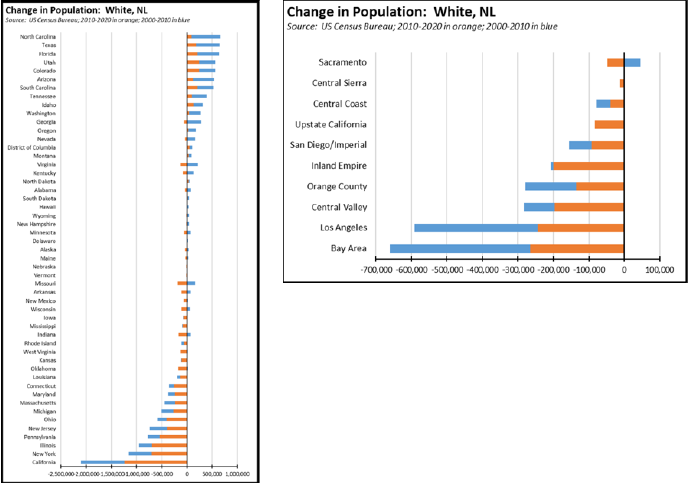
Population Shifts from the 2020 Census
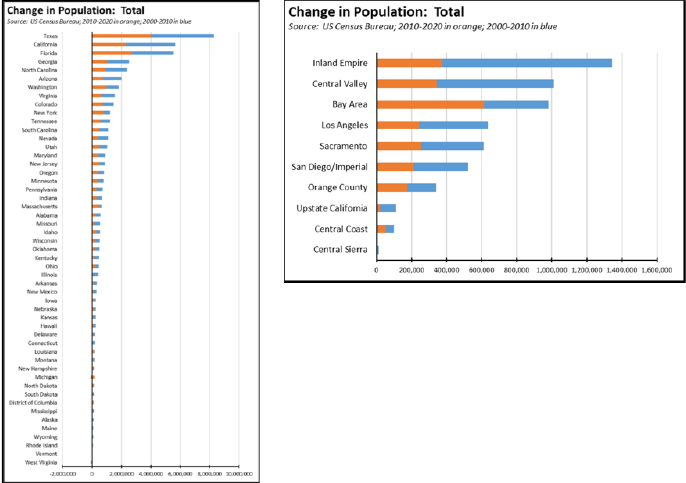
The narrative surrounding the recent release of the 2020 Census redistricting data summary files focused on the increasing diversity within the state and national populations. Less attention was paid to where these changes are occurring, where these components of the population are finding opportunity and growth.
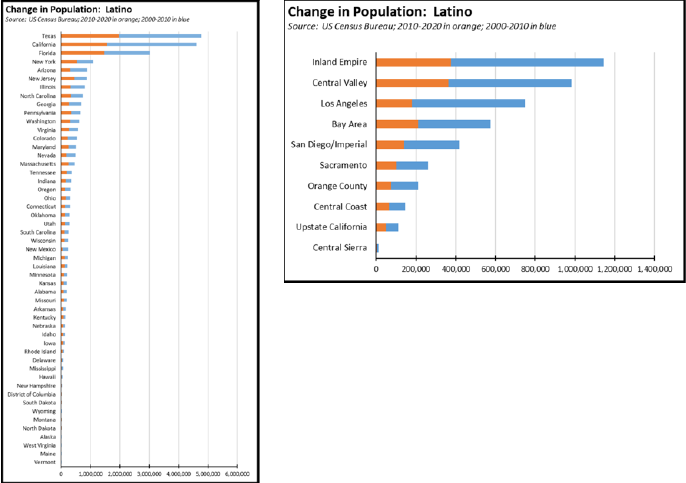
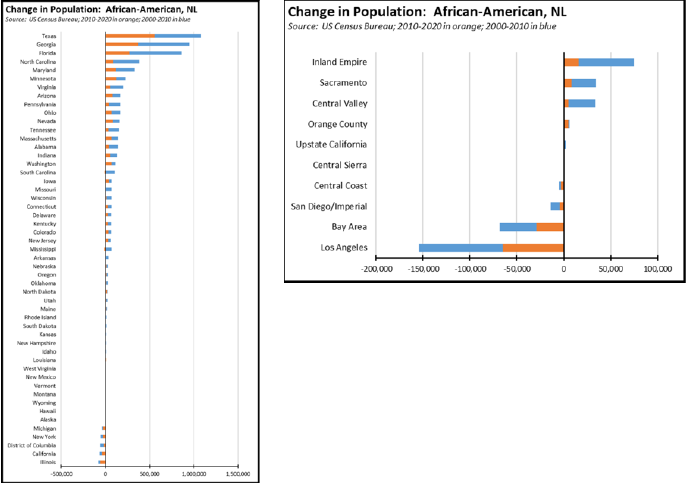
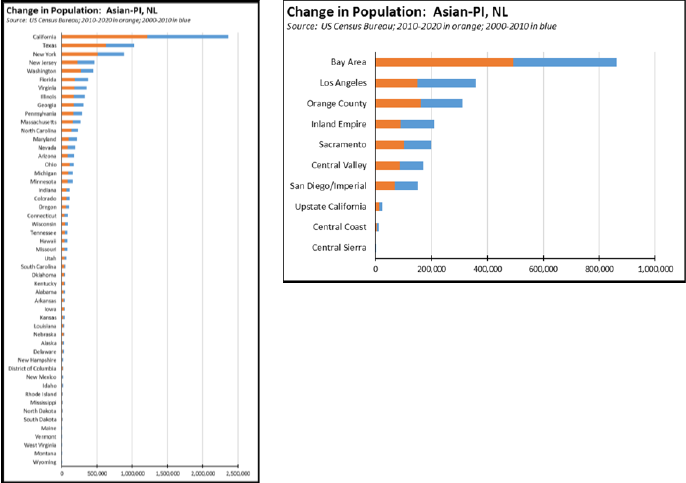
All of the charts below take data from both the 2010 and 2020 redistricting data summary files to show a longer, 20-year shift in the population demographics. Much of what is shown in the 2020 data is a continuation of patterns seen in 2010, although with some differences. The 2020 data is shown in the orange bars; 2010 is in blue. Consistent with Department of Finance data, all racial categories are for the non-Latino portion.
Overall, California has long ground in total population gains. Texas has led throughout this period, and Florida has nearly matched California in the 20-year period. Within the state, population growth has concentrated more within the lower-cost interior regions, with only the Bay Area and its outsized contribution to the state economy attracting population at a comparable level.
The largest growing demographic group has been Latinos. Texas again outpaced California but by a narrower margin. Florida while having a lower total over the two periods showed comparable growth as far-larger California in the 2020 data. Within California, strongest gains were again within the lower-cost interior regions, while the Bay Area moved ahead of Los Angeles in the latest data.
The African-American population continued to drop in California, by 45,000 in the 2020 data and 63,000 over the 20-year period. The 20-year gain in Texas, by contrast, was equal to half the total African-American population in California in 2020. Within the state, there again was a shift to the lower-cost interior regions, with all high cost urban coastal regions except Orange County showing losses.
Due to its proximity on the Pacific Rim, California showed by far the strongest growth for Asian-Pacific Islanders. Texas, New York, and Washington showed stronger gains in the 2020 data. The generally higher-incomes of this demographic enabled stronger growth within the urban coastal areas of the state, including constituting the leading component of change within extremely high cost Bay Area.
California also led the other states, by far, in the drop in White population, particularly in the 2020 results while most of the states we are tracking under the Califormer trends saw a rise. All regions of the state have seen a decline, but with the highest drops in high cost Los Angeles and Bay Area
Housing in the 2020 Census
The population results—as well as the relative costs of living tracked in our Affordability Index—largely follow from the conditions of housing supply within each state. Texas, at only 74% as large as California, increased its housing supply by more than twice as much (226%) in 2010-2020, and beat the 3 million unit goal in California’s policies by adding 3.4 million units in the 20 year period compared to 2.2 million in California. Florida, only 54% as large, increased supply by more units in the last 10 years (0.9 million units vs. 0.7 million in California) and the last 20 as well (2.6 million vs. California’s 2.2 million). California’s total was also behind North Carolina and Georgia (combined, 53% the size of California but adding 2.3 million units over the 20 years), Arizona-Washington-Virginia (combined, 59% the size of California but adding 2.4 million units), and similar combinations in states where population growth, in particular, the diversity components is stronger.
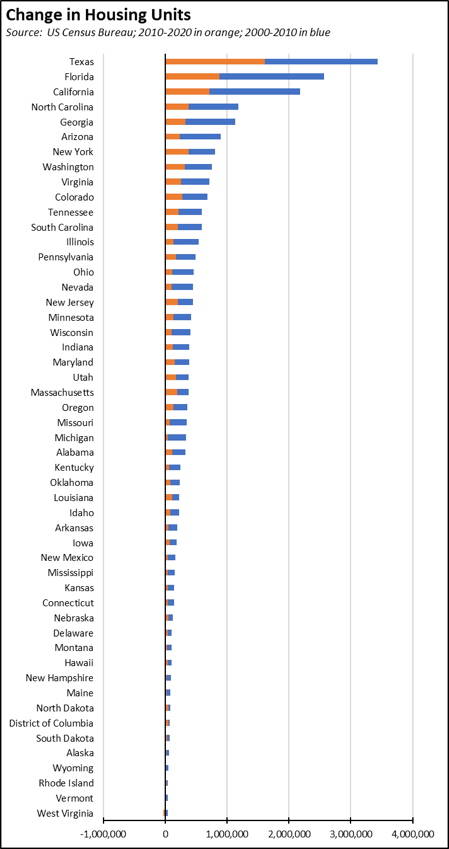
Within California, the Bay Area has led with housing additions, both in the latest data and over the 20-year period. In the 2020 results, Inland Empire and Central Valley while leading in population growth, lagged in housing supply additions behind higher-income Bay Area, Los Angeles, and Orange County. This differential likely instead was met through a combination of reduced vacancies and increased overcrowding.
This housing imbalance is continuing. In 2020 and the first half of 2021, Texas issued permits for more than twice as many new housing units as California. North Carolina alone issued 72% as many.
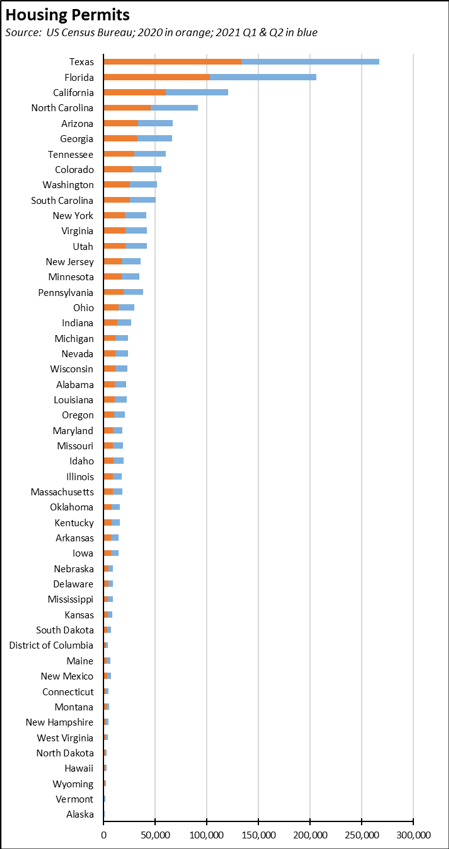
While California has passed some permitting reforms in an attempt to increase the supply, these remain limited and focused more on affordable housing and the homeless issue. These largely look to address the severe housing shortage by expanding rentals rather than the homeownership available in other states. Other provisions and state measures continue to drive up the cost of market-rate housing, further shutting off this traditional wealth-building option as a means to reduce inequality within the state.
Employment 1.094 Million Below Recovery
EDD reported that employment (seasonally adjusted; July preliminary) was up 56,100 from the revised June numbers as employment gains slowed from the prior two months, while the number of unemployed dropped 5,800. The unadjusted numbers show a gain of 180,100 after a drop of 44,500 in June.
The reported unemployment rate was unchanged at 7.6% following a revision to the June numbers, compared to 4.3% in February 2020 prior to the pandemic. California’s seasonally adjusted unemployment rate tied with New Mexico and New York for the 2nd highest among the states.
The national results were stronger, with total US employment rising 1,043,000, and the number of unemployed dropping 782,000. The reported unemployment rate improved 0.5 points to 5.4%, compared to 3.5% in February 2020.
Figure Sources: California Employment Development Department; US Bureau of Labor Statistics
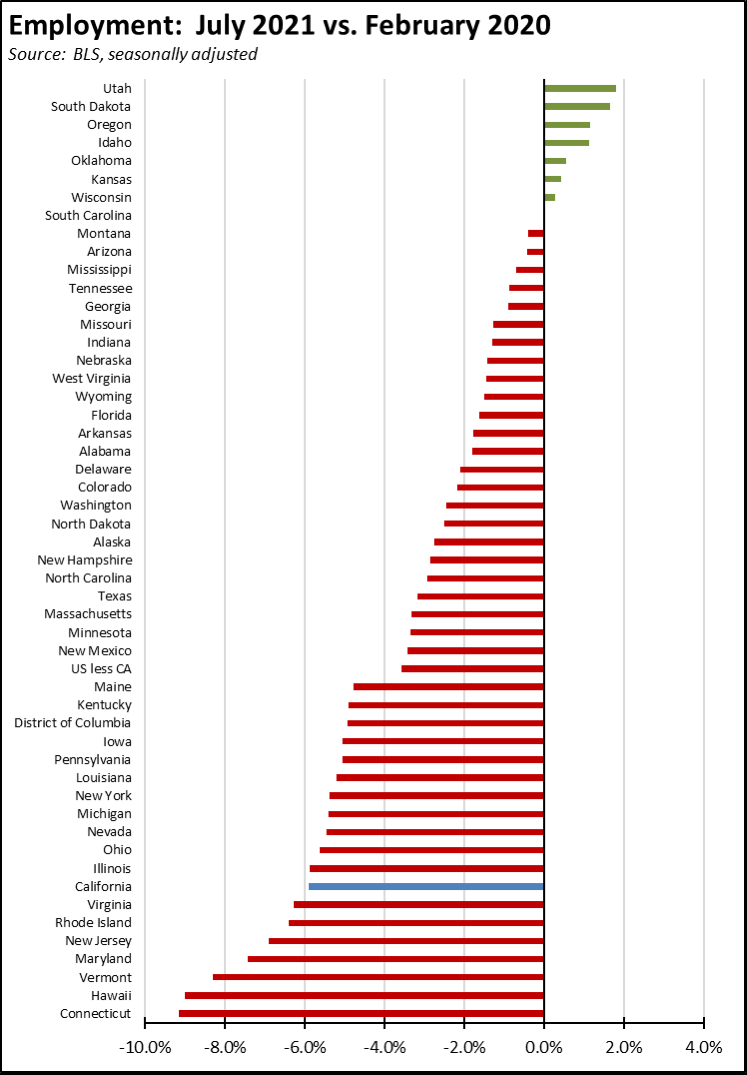
In the seasonally adjusted numbers, California employment remains 1.094 million (5.9%) below the pre-pandemic level in February 2020. Compared to the other states, California remained at the 8th lowest ranked by employment recovery level, while 8 states were above the pre-pandemic February 2020 employment levels.
Labor Force Participation Rate
The labor force participation rate edged up 0.2 pointsto 60.9%, while the US number was up 0.1 point to 61.7%. The rate remains well below the pre-pandemic level of 62.5%, which in turn was down substantially from prior years. Taking into account the participation rate, California cannot be said to have fully recovered even prior to the pandemic shutdowns. The additional workers leaving the labor force in a pandemic period puts that goal further off. Accounting for workers leaving the workforce since February 2020, there were 1.9 million out of work in July.
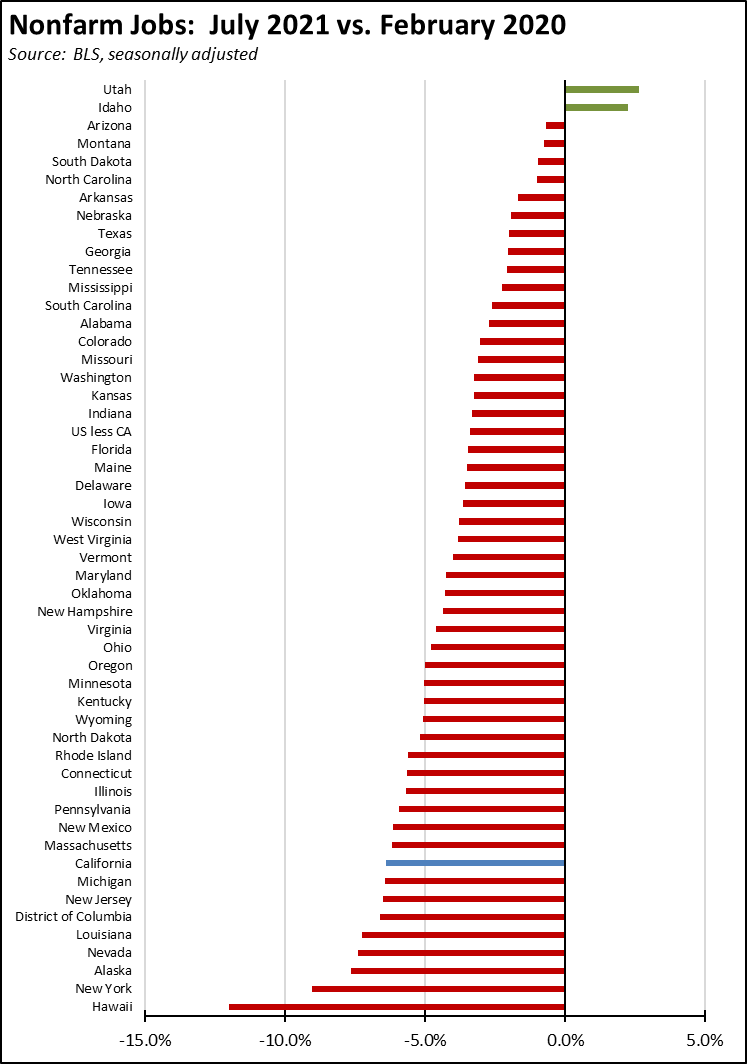
Nonfarm Jobs: 1.132 Million Below Recovery
Nonfarm wage and salary jobs were up 114,400 (seasonally adjusted) in July, while gains in June were revised 2,000 lower. Nonfarm jobs nationally were up 943,000.
California edged down to 9th lowest based on jobs recovery. Compared to the February 2020 numbers (seasonally adjusted) just prior to the current crisis and not accounting for population changes, nonfarm wage and salary jobs in California were 1.132 million short of recovery, or 19.9% of the national shortfall.
In the seasonally adjusted numbers, two states—Utah and Idaho—exceed the pre-pandemic levels, moving from recovery to growth.
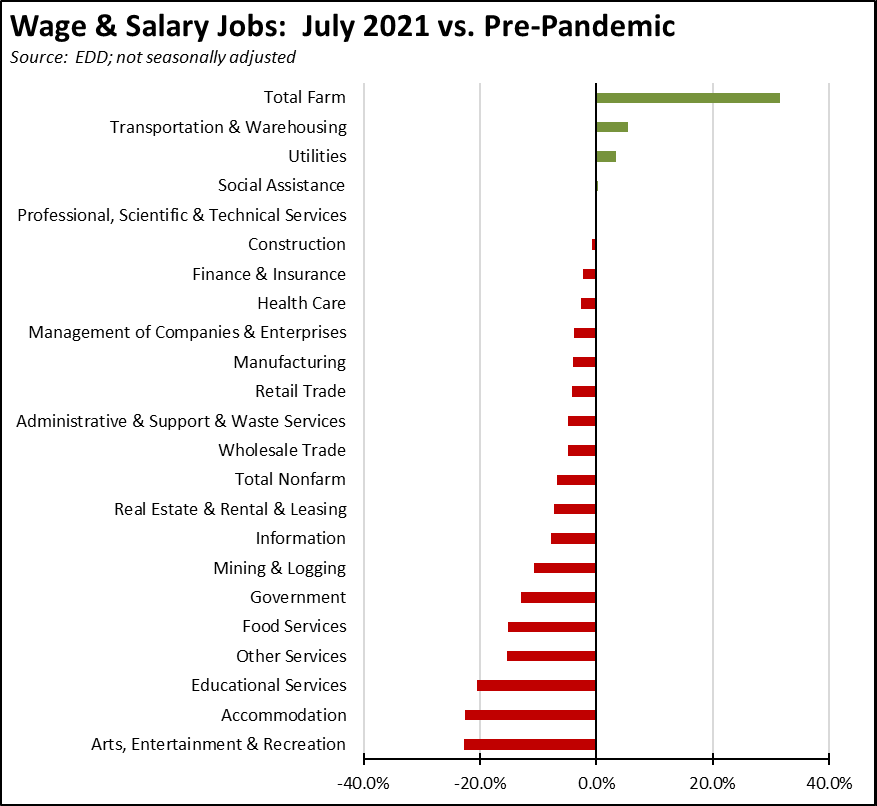
Jobs Change by Industry
Using the unadjusted numbers that allow a more detailed look at industry shifts, 4 industries showed job levels exceeding pre-pandemic February 2020 levels. The loss shown for Government and Educational Services reflects the strongest seasonal factor still overcoming the pandemic effects, as the result of the summer shift in schools employment. Overall Government was 14.9% below the February 2020 level. Government other than local government education was off only 4.9%, reflecting the combined effects of rising public revenues and federal assistance funds targeting the public sector rather than private jobs support during the pandemic period.
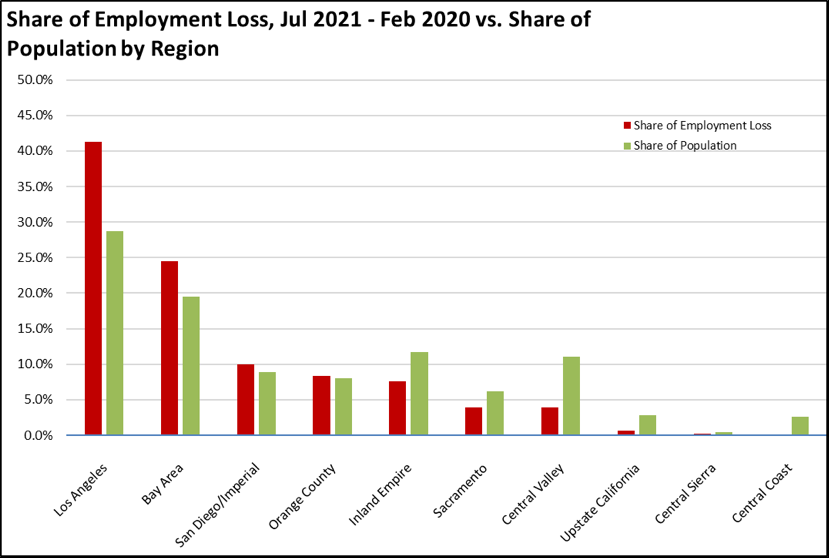
Employment Recovery by Region
All regions except the Central Coast continued to show lower employment compared to pre-pandemic February 2020, with Los Angeles and Bay Area still showing the relatively highest losses. Los Angeles region, however, is moving to a higher relative share of the remaining employment gap.
Unemployment Rates by Legislative Districts
The highest and lowest estimated unemployment rates in July are shown below.
Lowest
| wdt_ID | Congressional District | Unemployment Rate |
|---|---|---|
| 2 | CD18 (Eshoo-D) | 3.0 |
| 3 | CD17 (Khanna-D) | 3.7 |
| 4 | CD02 (Huffman-D) | 4.1 |
| 5 | CD52 (Peters-D) | 4.1 |
| 6 | CD12 (Pelosi-D) | 3.8 |
| 7 | CD14 (Speier-D) | 3.9 |
| 9 | CD15 (Swalwell-D) | 4.1 |
| 10 | CD19 (Lofgren-D) | 4.3 |
| 12 | CD49 (Levin-D) | 4.3 |
| 13 | CD45 (Porter-D) | 4.3 |
| wdt_ID | Senate District | Unemployment Rate |
|---|---|---|
| 2 | SD13 (Hill-D) | 3.3 |
| 3 | SD15 (Beall-D) | 3.8 |
| 4 | SD11 (Wiener-D) | 4.0 |
| 5 | SD10 (Wieckowski-D) | 4.1 |
| 6 | SD36 (Bates-R) | 4.2 |
| 7 | SD01 (Dahle-R) | 4.5 |
| 8 | SD39 (Atkins-D) | 4.3 |
| 9 | SD02 (McGuire-D) | 4.4 |
| 10 | SD37 (Moorlach-R) | 4.3 |
| 11 | SD17 (Monning-D) | 4.9 |
| wdt_ID | Assembly District | Unemployment Rate |
|---|---|---|
| 2 | AD28 (Low-D) | 3.0 |
| 3 | AD24 (Berman-D) | 3.3 |
| 4 | AD22 (Mullin-D) | 3.3 |
| 5 | AD16 (Bauer-Kahan-D) | 3.6 |
| 6 | AD73 (Brough-R) | 4.0 |
| 7 | AD10 (Levine-D) | 4.0 |
| 8 | AD06 (Kiley-R) | 3.9 |
| 9 | AD25 (Chu-D) | 3.8 |
| 10 | AD17 (Chiu-D) | 3.8 |
| 11 | AD78 (Gloria-D) | 4.1 |
Highest
| wdt_ID | Congressional District | Unemployment Rate |
|---|---|---|
| 2 | CD29 (Cardenas-D) | 7.8 |
| 3 | CD37 (Bass-D) | 7.9 |
| 4 | CD28 (Schiff-D) | 8.0 |
| 5 | CD34 (Gomez-D) | 8.7 |
| 6 | CD16 (Costa-D) | 8.9 |
| 7 | CD32 (Napolitano-D) | 7.9 |
| 9 | CD21 (Cox-D) | 9.5 |
| 10 | CD40 (Roybal-Allard-D) | 9.5 |
| 12 | CD51 (Vargas-D) | 10.6 |
| 13 | CD44 (Barragan-D) | 10.6 |
| wdt_ID | Senate District | Unemployment Rate |
|---|---|---|
| 2 | SD22 (Rubio-D) | 7.1 |
| 3 | SD12 (Caballero-D) | 7.4 |
| 4 | SD21 (Wilk-R) | 8.5 |
| 5 | SD35 (Bradford-D) | 8.8 |
| 6 | SD24 (Durazo-D) | 8.8 |
| 7 | SD18 (Hertzberg-D) | 7.9 |
| 9 | SD30 (Mitchell-D) | 9.0 |
| 10 | SD33 (Gonzalez-D) | 9.1 |
| 12 | SD40 (Hueso-D) | 9.4 |
| 13 | SD14 (Hurtado-D) | 10.4 |
| wdt_ID | Assembly District | Unemployment Rate |
|---|---|---|
| 2 | AD46 (Nazarian-D) | 8.8 |
| 3 | AD31 (Arambula-D) | 9.3 |
| 4 | AD36 (Lackey-R) | 9.2 |
| 5 | AD63 (Rendon-D) | 9.8 |
| 6 | AD32 (Salas-D) | 9.6 |
| 7 | AD26 (Mathis-R) | 9.0 |
| 9 | AD51 (Carrillo-D) | 9.9 |
| 10 | AD64 (Gipson-D) | 10.3 |
| 12 | AD59 (Jones-Sawyer-D) | 10.4 |
| 13 | AD56 (Garcia-D) | 11.3 |
Unemployment Rates by Region
Unemployment rates (not seasonally adjusted) compared to pre-pandemic February 2020 continue to show the Los Angeles region with the worst outcome in the state.
| wdt_ID | Region | July - 21 | Feb - 20 |
|---|---|---|---|
| 2 | California | 7.9 | 4.3 |
| 6 | Bay Area | 5.7 | 2.7 |
| 10 | Orange County | 6.3 | 7.0 |
| 14 | Central Sierra | 6.6 | 8.4 |
| 18 | Central Coast | 6.6 | 4.6 |
| 22 | Sacramento | 6.7 | 4.5 |
| 26 | Upstate California | 7.3 | 2.8 |
| 30 | San Diego/Imperial | 7.4 | 3.9 |
| 34 | Inland Empire | 7.9 | 3.7 |
| 38 | Central Valley | 9.7 | 3.8 |
| 39 | Los Angeles | 9.8 | 6.3 |
Figure Source: California Employment Development Department
MSAs with the Worst Unemployment Rates
California had 11 of the MSAs among the 25 regions with the worst unemployment rates in June.
| wdt_ID | MSA | June Unemployment Rate | US Rank out of 389 |
|---|---|---|---|
| 1 | El Centro MSA | 17.5 | 388 |
| 2 | Visalia-Porterville MSA | 11.0 | 386 |
| 3 | Bakersfield MSA | 10.8 | 384 |
| 4 | Merced MSA | 10.7 | 382 |
| 5 | Hanford-Corcoran MSA | 10.2 | 380 |
| 6 | Los Angeles-Long Beach-Anaheim MSA | 9.5 | 374 |
| 7 | Fresno MSA | 9.4 | 372 |
| 8 | Madera MSA | 9.1 | 370 |
| 9 | Stockton-Lodi MSA | 9.1 | 370 |
| 10 | Yuba City MSA | 8.9 | 367 |
| 11 | Modesto MSA | 8.8 | 366 |