Highlights for policy makers:
- COVID-19 and the State Economy
- CaliFormer Businesses: Update
- CaliFormers: Reshoring Jobs
- Nonfarm Jobs: 73,800 Below Pre-Covid Peak
- Job Change by Industry
- Job Openings Plunge 212,000
- Employment 165,700 Below Pre-Covid Level
- Labor Force Participation Rate
- Unemployment Rates by Legislative Districts
- Unemployment Rates by Region
- Employment Recovery by Region
- MSAs with the Worst Unemployment Rates
COVID-19 and the State Economy
As discussed in our preliminary report on the July data, nonfarm jobs posted a somewhat stronger result compared to the prior 4 months, with an increase of 84,800 in July and a near doubling of the June estimate to 37,300. Employment gains, however, essentially stalled with a gain of only 23,500, the third lowest monthly gain since the initial losses in the pandemic period and accounting for only 3% of the total employment gains so far this year.
With this release, California remained 73,800 jobs (-0.4%) below the pre-pandemic peak in February 2020, and 165,700 workers (-0.9%) below the prior employment peak. The US numbers, however, passed this recovery mark for nonfarm jobs but remained 0.4% short in the employment numbers.
In contrast, 15 states continued to exceed the pre-pandemic job numbers, while 31 states were above this recovery point for employment. As those 15 states have moved from jobs recovery to jobs growth, the resulting total has counterbalanced the continuing shortfalls in states such as California and pushed the national economy past this recovery point.
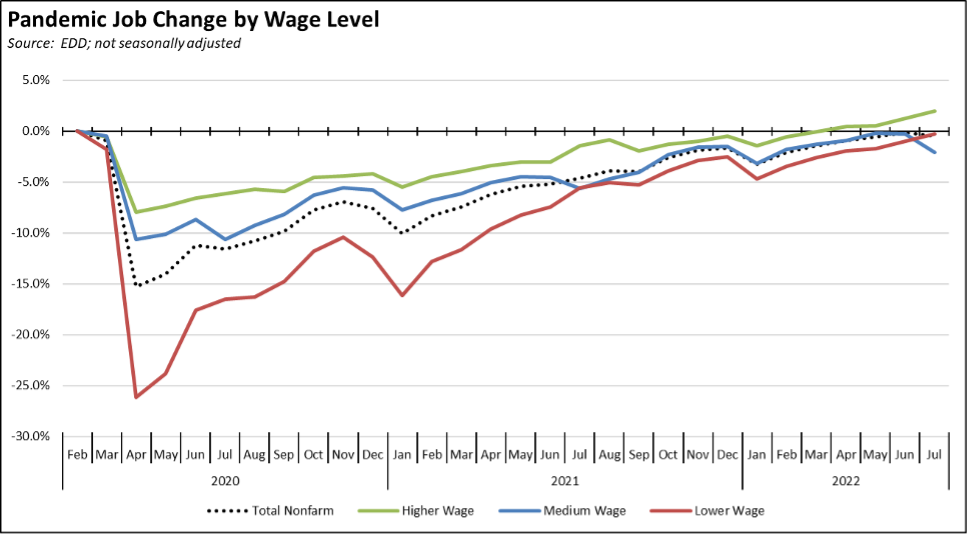
Using the unadjusted numbers to show results by average wage level, the higher wage industries continued moving in positive territory. The medium wage industries showed a reversal due to the seasonal shifts for schools (Educational Services and Government). Seasonal factors were positive for the lower wage industries as their previous lagging recovery picked up in July.
CaliFormer Businesses: Update
Additional CaliFormer companies identified since our last monthly report are shown below. Companies listed below include those that have announced: (1) moving their headquarters or full operations out of state, (2) moving business units out of state (generally back office operations where the employees do not have to be in a more costly California location to do their jobs), (3) California companies that expanded out of state, and (4) companies turning to permanent telework options, leaving it to their employees to decide where to work and live. The list is not exhaustive but is drawn from a monthly search of sources in key cities.
| wdt_ID | Companies | From | To | Reason | Link | Date |
|---|---|---|---|---|---|---|
| 1 | 828 Productions | Glendale | New Mexico | HQ and studio move | Read More | 2022 |
| 2 | Andreessen Horowitz | Menlo Park | Cloud | HQ move | Read More | 2022 |
| 3 | AS Colour | Carson | North Carolina | Distribution Center | Read More | 2022 |
| 4 | Denkai America | Lake Forest | Georgia | HQ move/EV battery component manufacturing | Read More | 2022 |
| 5 | GAF Energy | San Jose | Texas | Manufacturing expansion | Read More | 2022 |
| 6 | Geico | various California | not specified | Closed all 38 California offices | Read More | 2022 |
| 7 | Mountain View | North Carolina | Expansion | Read More | 2022 | |
| 8 | Ketos | Milpitas | San Antonio | Expansion | Read More | 2022 |
| 9 | OnePointOne | San Jose | Arizona | HQ and production move | Read More | 2022 |
| 10 | Owens Corning Corp. | Santa Clara | Utah & Arizona | Shift manufacturing to lower cost areas | Read More | 2022 |
| Companies | From | To | Reason | Link | Date |
CaliFormers: Reshoring Jobs
The pandemic period provided a stress test for the previous trend that saw the dispersion of a substantial portion of the domestic manufacturing base to other countries. Supply chain disruptions led to widespread component and goods shortages, and the nation found itself unable to surge production in key areas such as PPE. These outcomes were not new and had been growing in the years prior to COVID, but the pandemic exacerbated the situation to a level having economy-wide repercussions.
As a consequence, reshoring of manufacturing jobs—both as companies returned production previously shifted to other countries and as foreign companies opened domestic facilities through foreign direct investment (FDI)—has been growing in significance. Based on tracking by the Reshoring Initiative using a data approach similar to but more comprehensive than our CaliFormers series, 1.3 million reshoring jobs were created in 2010-21. The pace continues to accelerate, with an expected 350,000 reshored jobs in 2022 alone based on the results from the first 6 months.
In the 2022 results, battery manufacturing is the leading industry with 37% of the expected total, followed by chemicals at 14% as the result of facilities for pharmaceuticals, alternative fuels, and due to the nation’s competitive advantage in the production and cost of natural gas.
Due to its high and growing operating costs, California lags in competing for these higher wage, middle class jobs. In the 12 years 2010-2021, California ranked 12th among the states with only 3.1% of the reshored jobs despite having 10.5% of the nation’s manufacturing base in this period. In the latest results for 2022, California no longer ranks in the top 20 states.
Manufacturing: Reshoring & Foreign Direct Investment by State
Source: Reshoring Initiative
Nonfarm Jobs: 73,800 Below Pre-Covid Peak
Nonfarm wage and salary jobs were up 84,800 (seasonally adjusted) in July, while the estimated gains in June were nearly doubled to 37,700. Nonfarm jobs remained below the pre-pandemic peak in February 2020, but these improved gains brought the remaining gap down to only 73,800 (-0.4%).
After 3 months in 2nd or 3rd place, California again led the states in job gains. Even with the large revisions in the June numbers, however, on a running quarterly basis, California (162,900) remained behind Texas (230,200) and just barely ahead of smaller Florida (145,500). More importantly, the key difference in these numbers is that the California gains still are from jobs recovery, while the other two states show jobs growth having surpassed their prior peaks—Florida last October and Texas in November—much earlier.
Job Change by Industry
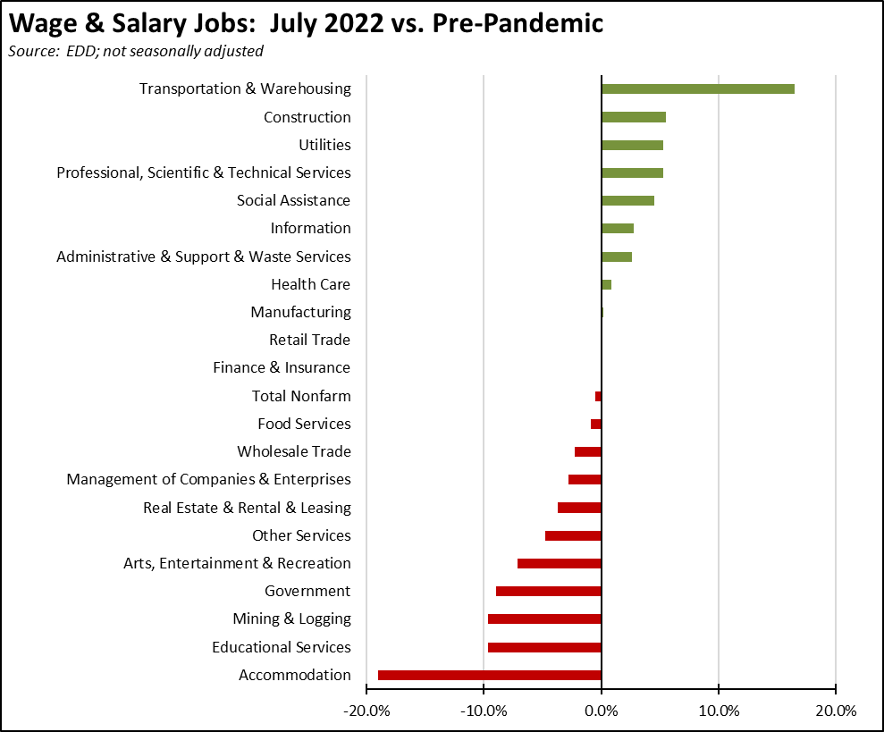
Using the unadjusted numbers that allow a more detailed look at industry shifts, the number of industries showed job levels at or exceeding the pre-pandemic February 2020 levels notched up to 10, with Retail Trade just breaking this barrier and Finance & Insurance only 300 jobs below. Transportation & Warehousing again showed the strongest cumulative jobs growth (109,400) by a large margin, rising 53% greater than the second highest, high-wage Professional, Scientific & Technical Services (71,700). As indicated earlier, the slippage shown for Educational Services and Government reflects seasonal factors coming from schools.
Job Openings Plunge 212,000
Unfilled job openings at the end of June plunged 212,000 (-15.8%) and reached their lowest level since last August. Even as employers began to scrap planned job expansions, however, labor supply remained a limiting factor on potential jobs expansion going forward. While the ratio weakened, the number of unemployed in June was only sufficient to cover 72% of the unfilled jobs.
Employment 165,700 Below Pre-Covid Level
EDD reported that employment (seasonally adjusted; July preliminary) was up only 23,500 from the revised June numbers. The number of unemployed dropped 46,800.
The reported unemployment rate improved 0.3 point to 3.9%, compared to the revised 4.1% in February 2020 prior to the pandemic and the lowest on record in the current data series. Even with this improvement, California had the 12th highest unemployment rate among the states, and contained 13.4% of the total number of unemployed workers in the US.
In the national numbers, total US employment was up 179,000, and the number of unemployed was down 242,000. The reported unemployment rate dipped 0.1 point to 3.5%, matching the 3.5% rate recorded in February 2020.
Figure Sources: California Employment Development Department; US Bureau of Labor Statistics
Labor Force Participation Rate
The labor force participation rate dipped 0.1 point to 62.4% but remained above the US number at 62.4%. The California rate still remains below the pre-pandemic level of 62.8%, which in turn was down substantially from prior years. Accounting for workers leaving the workforce since February 2020, there were an estimated 0.9 million out of work in July.
Unemployment Rates by Legislative Districts
The highest and lowest estimated unemployment rates in July are shown below. The estimates are for the current, 2012 vintage districts. Estimates for the new districts under the 2022 redistricting will be released after the required factors from the American Community Survey become available at the end of the year.
Lowest
Highest
Unemployment Rates by Region
Unemployment rates (not seasonally adjusted) compared to pre-pandemic February 2020 are shown below.
Figure Source: California Employment Development Department
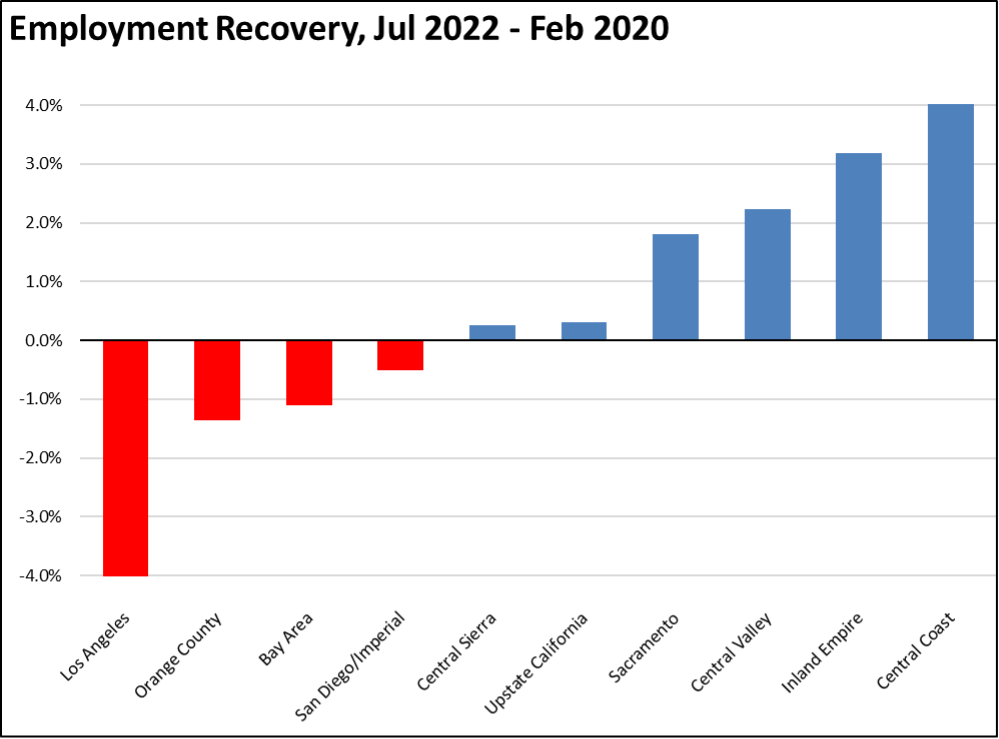
Employment Recovery by Region
Los Angeles Region continues to lag the rest of the state in recovery to the pre-pandemic peak employment levels.
MSAs with the Worst Unemployment Rates
California again had 6 of the MSAs among the 25 regions with the worst unemployment rates in May, including El Centro MSA (Imperial County) with the second worst unemployment rate in the nation. Los Angeles-Long Beach-Anaheim MSA remained out of this group, but dropped to #301 in a tie with 9 other MSAs in other states. The best performing California urban region was again San Jose-Sunnyvale-Santa Clara MSA, edging up to a tie with 4 other MSAs at #17, with an unemployment rate of 2.3% compared to the best performing region, Portsmouth, NH-ME Metropolitan NECTA at 1.8%.