Highlights for policy makers:
- Unemployment Rate Declines to 7.4%
- More Californians Leave Labor Force
- Middle Class Jobs Still Below Pre-Recession Levels
- Two-Tiered Economic Recovery Persists
- Six Californias
Unemployment Rate Declines to 7.4%
The Labor Force data for June 2014 (seasonally adjusted; California preliminary) is shown below, along with the change from the prior month:
The related not seasonally adjusted numbers (California preliminary), with the change from June 2013:
California Employment Development Department’s (EDD) latest release shows generally continued improvement in the state’s labor force statistics. Total employment continues to improve in line with the national numbers. California’s unemployment rate of 7.4% (seasonally adjusted) is the lowest it has been since Q3 2008.
California’s seasonally adjusted unemployment rate remains 21% higher than the national rate. California was tied with District of Columbia, Georgia, and Kentucky with the 5th highest among the states, ahead of Michigan (7.5%), Nevada (7.7%), Mississippi (7.9%), and Rhode Island (7.9%).
Between June 2013 and June 2014, BLS data shows the total number of employed increased by 288,500 (not seasonally adjusted). This increase was the second highest among the states, behind Texas (307,700) and just ahead of Florida (276,900).
More Californians Leave Labor Force
While the total number of unemployed continue to decline both on a seasonally adjusted and not seasonally adjusted basis, a major factor in the unemployment rate drop is the continued weakening in the Labor Force Participation Rate. Rather than keeping pace with population growth, on a not seasonally adjusted basis, the Labor Force shrank by 73,500 compared to June 2013.
Labor Force Participation rate is determined by dividing the number of persons in the Civilian Labor Force by the number of persons aged 16 and over. The rate is a measure of the potentially eligible work force who are employed or looking for employment.
Middle Class Jobs Still Below Pre-Recession Levels
Job growth (not seasonally adjusted) continued its positive trend over the past 12 months for most industries except Farm, Manufacturing, and Finance and Insurance. Compared to the pre-recession 2007 annual average, Total Nonfarm jobs increased 137,200. In this same period, however, total population in California increased an estimated 1.73 million people.
– Jun 2013 ave Change Jun 2014
– 2007 ave
Jobs growth continues to be concentrated in the higher wage (Professional, Scientific and Technical Services) and lower wage (Accommodation and Food Service) industries. About 11 percent of Total Nonfarm growth comes from Individual & Family Services, the industry containing the IHSS (In Home Supportive Services) employment numbers added by EDD in their March 2014 revision. Even with improvement in Construction, that middle class job sector remains 222,700 below the 2007 average of 892,600. Other industries still below their 2007 pre-recession level are Manufacturing, Finance and Insurance, Retail Trade, Real Estate and Rental and Leasing, Information, and Government. Wholesale Trade began showing a slight positive growth over 2007 with the June 2014 numbers.
Two-Tier Economy Continues
Unemployment rates and employment (all data is not seasonally adjusted) continue to vary widely across the state, although the spread between regions dropped from 2.18 in May to 2.06 in June. Unemployment rates increased slightly in most regions except Central Sierra and Upstate California which went down, and Central Coast and Central Valley which remained the same.
By County:
By Legislative District:
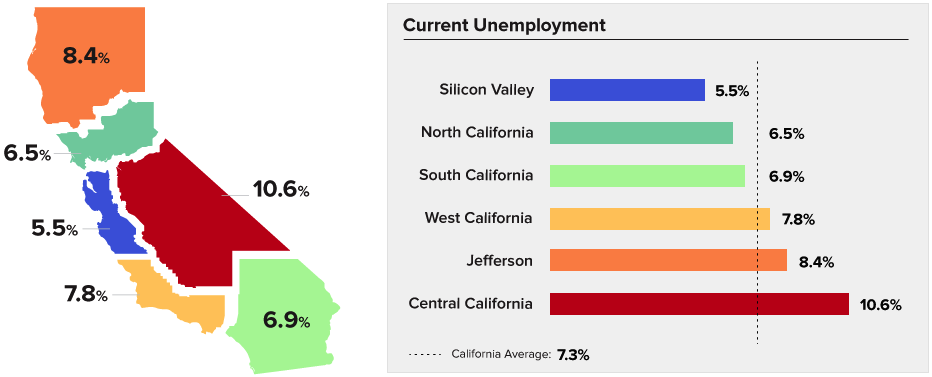
Six Californias
As another example of regional differences, the proposed “Six Californias” initiative recently submitted signatures for verification. The table below shows the June 2014 (not seasonally adjusted) unemployment rates for this proposed regional grouping. As indicated, there is still a spread in the unemployment rates, but a narrower spread (1.92) between the highest and lowest rates.

