Highlights for policy makers:
- Unemployment Rate Increases to 6.4%; Total Employment Climbs 59,100
- State Employment Growth Rankings
- Labor Force Participation Rate Increases to 62.5%
- Nonfarm Jobs Increase 54,200
- 6 Industries Remain Below 2007 Pre-Recession Job Levels
- 7 Counties Remain in Double-Digit Unemployment, Down from 10 in April
- Two-Tier Economy Persists
- Two-Tier Economy by Demographic Group
- Two-Tier Economy by Demographic Group: Ethnicity/Race
- Two-Tier Economy by Demographic Group: Age
Unemployment Rate Increases to 6.4%; Total Employment Climbs 59,100
The Labor Force data for May 2015 (seasonally adjusted; California preliminary) is shown below, along with the change from the prior month:
The related not seasonally adjusted numbers (California preliminary), with the change from May 2014:
California Employment Development Department’s (EDD) latest release shows on a seasonally adjusted basis, total employment grew by 59,100 from April, while the number of unemployed increased by 12,800. California’s seasonally adjusted unemployment rate increased from 6.3% in April to 6.4% in May. The unadjusted rate decreased from 7.2% in May 2014 to 6.2% in May 2015.
Total US employment grew at a slightly lower rate (seasonally adjusted increase of 272,000), while the number of unemployed increased at a slightly higher rate (seasonally adjusted increase of 125,000).
Both California and the US saw increases in the labor force participation rates, a factor that played a role in the unemployment rate increase as more people moved back into the jobs market. While this is only a one-month occurrence that has yet to prove a trend, if it continues, it would be indicative of wage and hour increases causing people to re-enter the labor force.
State Employment Growth Rankings
California’s seasonally adjusted unemployment rate was 16% higher than the national rate. California’s ranking worsened slightly to be the 9th highest unemployment rate among the states (including DC).
Between May 2014 and May 2015, Bureau of Labor Statistics (BLS) data shows the total number of employed in California increased by 487,325 (seasonally adjusted), or 15.9% of the total net employment gains in this period for the US. Because it is significantly larger than any other state, California generally will rank at or near the top in total number of new employed. Measures that adjust for size will generally give a better ranking based on economic performance. This situation is also illustrated by Texas, which ranked 3rd highest by the number of employed, but ranked well below other states this month based on relative performance.
Measured by total employment gains, California continued to be highest among the states. Measured by percentage change in employment over the year, California was 16th. Adjusted for population, California was the 18th highest. Taken together, these rankings suggest that while California continues to improve its employment growth overall, it still is underperforming relative to its size. Employment gains have yet to match population growth since the recession.
Labor Force Participation Rate Increases to 62.5%
California’s participation rate (seasonally adjusted) increased to 62.5%, returning to the marginal gains seen last fall. The comparable US rate also improved slightly to 62.9%.
While an improvement, California has recorded this rate level only twice previously: in June 1976 at the beginning of a long-term increase in the participation rate, and in August 2013 during the most recent sustained decline period.
Nonfarm Jobs Increase 54,200
EDD reported that between April and May 2015, seasonally adjusted nonfarm payroll jobs increased by 54,200. The April job gains were revised downwards from the preliminary estimate of 29,500 to 17,200.
Looking at the not seasonally adjusted numbers, the change in nonfarm payroll jobs from April 2015 saw the largest increases in Administrative & Support & Waste Services (19,000), Accommodation & Food Services (15,900), and Construction (13,800). Declines were felt in Information (-6,400), Educational Services (-4,300), and Professional, Scientific & Technical Services (-2,800). Total Farm jobs increased 63,700 for the month.
By total number of new jobs, California had the highest increase in seasonally adjusted nonfarm jobs among the states from May 2014 to May 2015, at 465,700 or 16.6% of the US total. By percentage growth in jobs, California was the 7th highest; and by population adjusted jobs growth, 8th highest.
civilian noninstitutional population)
6 Industries Remain Below 2007 Pre-Recession Job Levels
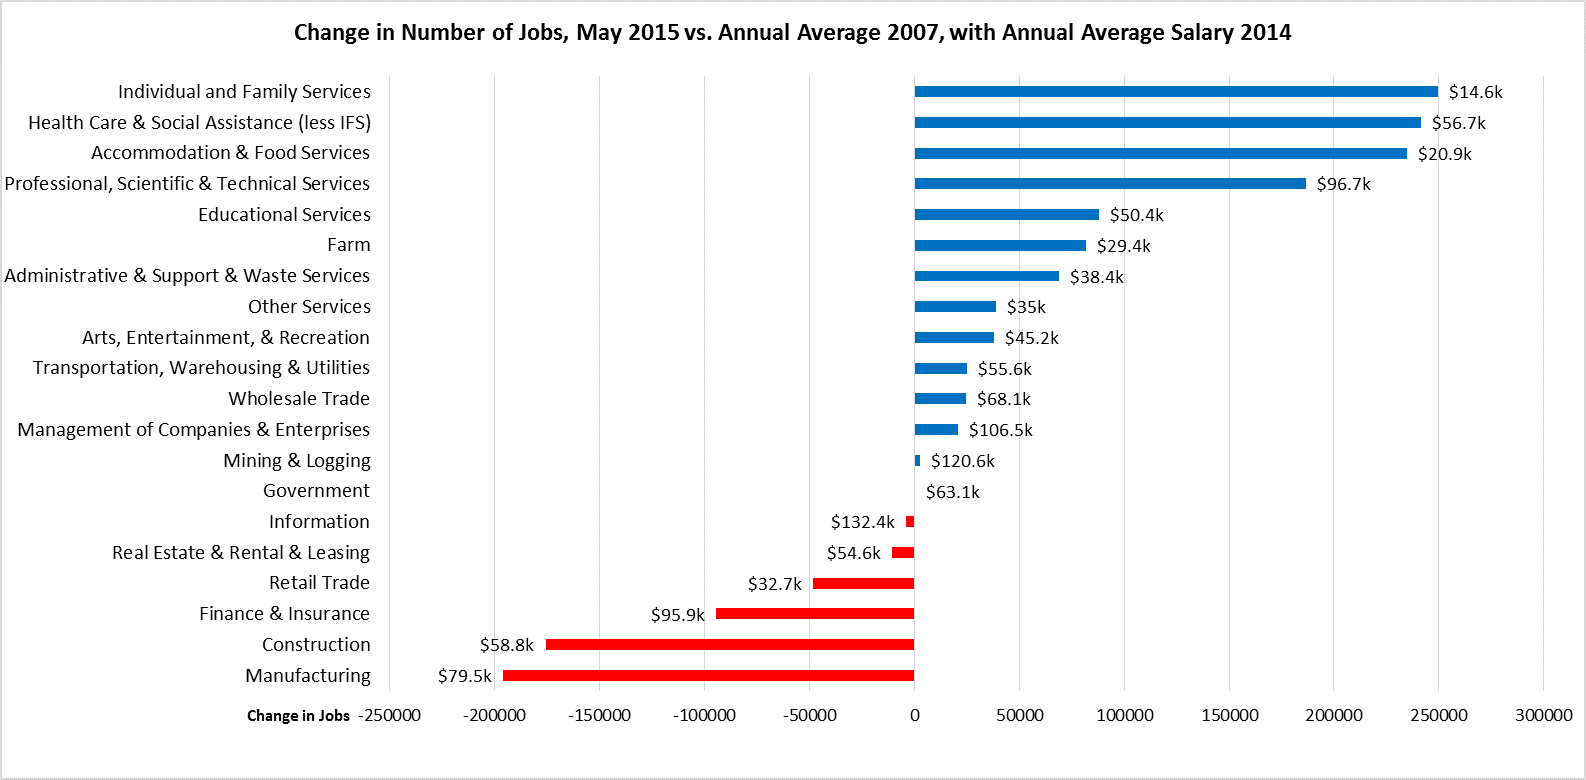
Comparing the number of jobs by industry in May 2015 (not seasonally adjusted), 6 industries remain below the 2007 pre-recession levels. Government shows a net increase of only 500 in the May numbers; this industry will begin showing a negative balance under the unadjusted numbers as schools recess for the summer.
As indicated in the figure above, growth continues to be primarily in the lower wage and higher wage industries, with two of the top three growth industries paying well under $2,000 a month in average wages. The largest gaps remain in the middle class-wage industries of Manufacturing and Construction.
7 Counties Remain in Double-Digit Unemployment, Down from 10 in April

Two-Tier Economy Persists
Unemployment rates (all data is not seasonally adjusted) continue to vary widely across the state, ranging from 4.2% in the Bay Area to more than double at 9.8 in the Central Valley.
Ratio of Highest to Lowest Rate: 2.36
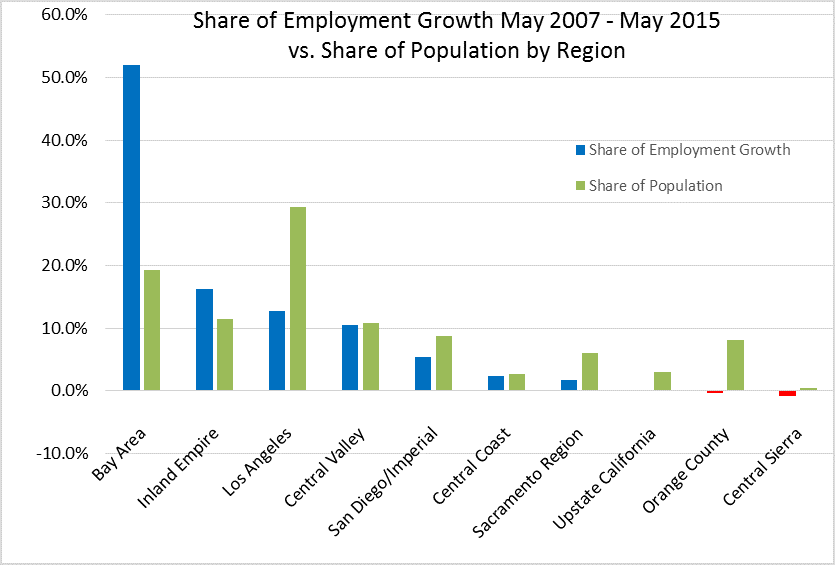
The Bay Area continues to dominate employment growth since the recession; with 19% of the state’s population, this region contains 52% of the net employment growth since May 2007. Inland Empire continues to contain the second highest share of net employment growth, 16%. Los Angeles with 29% of the population remains with only 13% of the net employment growth.
By County:
Ratio of Highest to Lowest Rate: 6.45
By Legislative District:
Ratio of Highest to Lowest Rate: Senate 4.27
Ratio of Highest to Lowest Rate: Assembly 4.00
Two-Tier Economy by Demographic Group
Each month, EDD publishes a demographic report to accompany their labor force releases. This report provides additional data drawn from the Current Population Survey (CPS) showing labor force broken down by selected ethnicity/race, sex, age, education, and other factors. Several of these data points are tracked in the Indicator series maintained by the Center.
While previous Center commentaries have focused on the regional differences in California’s developing two-tier economy, the demographic data provides yet another view of this continuing trend and how the jobs structure evolving under the state’s current regulatory, tax, energy, and other policies is affecting different demographic groups.
The following discussion draws from EDD’s demographic reports along with additional data obtained through a request to EDD. In order to minimize seasonal effects, EDD reports this data as 12-month moving averages; but as a result, data will not be directly comparable with the EDD’s seasonally adjusted data which is calculated through a different method. Comparable US data was developed from BLS files along with California averages from EDD’s CPS data.
Two-Tier Economy by Demographic Group: Ethnicity/Race
Labor force data is shown above for the 4 largest ethnic/racial groups, comparing the April 2015 state data to January 2008 (California’s pre-recession peak employment month). Note that these are not discrete groupings; the CPS definition for Latinos covers Latinos of any race.
- Asian Californians lead in employment recovery at 19.0%, followed by Latino Californians at 12.9%. White Californians are the only population group still to recover to the pre-recession employment level.
- Asian Californian unemployment rates are nearing levels historically considered as full employment; Asians are also the only group to show unemployment rates below the current US 12-month moving average. Latinos remain elevated above both the pre-recession level and the state average. Black Californians remain at double-digit rates—double the rate of Whites and more than double the rate of Asians.
- Labor force participation rates remain below pre-recession levels for all four groups, but significantly less in the case of the Black Californian population. Black Californians, however, have experienced labor force participation rates significantly below the state average throughout this period. Latino labor force participation rates consistently have been above the other groups.
Comparing the California data to the US, all 4 groups remain economically below the national averages. This situation is especially significant for Black Californians, who continue to experience unemployment levels 2.5 percentage points worse than the US average for Blacks and participation rates nearly 2 points below.
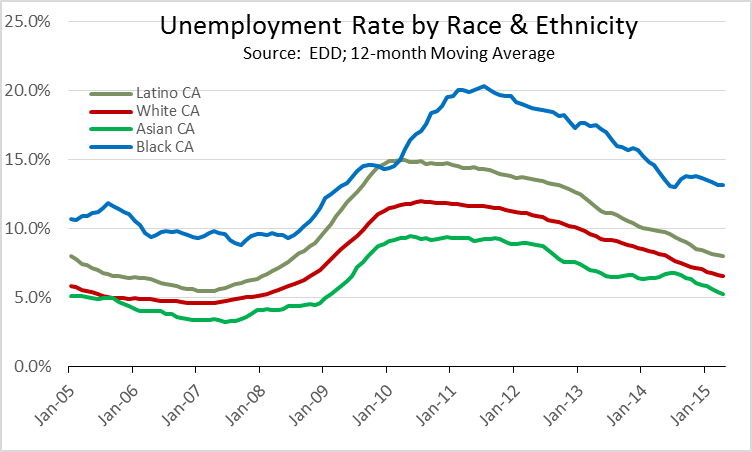
Looking at a longer term shown in the graph, the relative relationship between the unemployment rates has generally held since 2005 with some key differences:
- Latino and Black unemployment rates converged in the 4th quarter of 2009. Latino unemployment then went through steady improvement, while Black unemployment rates continued to climb to a high of 20.3% in July 2011. In essence, Black Californians continued to experience a recession nearly a year longer than the other three groups, and even now continue to show unemployment rates at recessionary levels.
- Asian unemployment rates were on a faster decline in 2012 prior to leveling out in the second half of 2013. They have since begun to drop faster than White rates again in the last 6 months.
- Latino Californians experienced a steeper increase in unemployment rates than Whites and Asians during the recent recession. The Latino unemployment rate went from a low of 5.5% in January-April 2007 to a peak of 15.0% in March-April 2010—a change of 9.5 percentage points. White Californians in this same period experienced a change of 7.2 percentage points; Asians a change of only 6.0 percentage points.

- Asian Californians have an unemployment rate profile that tracks more closely to the national demographic averages than the other 3 groups. Black Californians similarly tracked closely to the national averages prior to 2010, but a large gap opened up as their unemployment situation continued to worsen in this state while improving elsewhere in the US.
- Latinos in California have faced relatively fewer employment opportunities than Latinos nation-wide, as indicated by the gap that opened up in the unemployment rates (along with labor force participation rate differences) beginning in 2007. In fact, the unemployment profile for Latinos for the US as a whole has instead tracked closely with the employment conditions for White Californians, while Latinos living in California remain at elevated rates.
Two-Tier Economy by Demographic Group: Age
- Younger workers in general have been hit harder by the changing jobs structure than older workers. Net employment among workers 54 years and younger remains down by nearly 700,000, while growing more than 900,000 among workers 55 and older. Older workers with jobs have been more likely to keep them or shift to self-employment using their acquired skills, while younger workers have found fewer opportunities as they have tried to enter the work force.
- Youth (ages 16-19) and young adults (ages 20-24 and 25-34) also continue to show signs of delayed recovery through both elevated unemployment rates and depressed labor force participation rates. This situation is an indication that many at this formative phase of their employment lives continue to miss out on the opportunity to develop critical employment skills, a factor which will continue to affect their employment opportunities in the future.
- Older workers are continuing to work longer, including those needing to work for additional retirement income. Workers aged 65 and older are the only demographic group which has seen an improved labor force participation rate.
- All age groups continue to experience higher unemployment rates than their counterparts nation-wide. Young adults (ages 20-24) show the narrowest gap, but only as a result of a substantially lower labor force participation rate than the US average for their group.
- Conversely, older Californians (ages 55+) show higher participation rates than the US averages, in part likely a reflection of the need to continue working in order to cope with the higher costs of living in this state.
- Youth (ages 16-19) show the greatest disparities. California unemployment rate remains 4.0% higher than the US average for this group, while the labor force participation rate is 8.2% below.
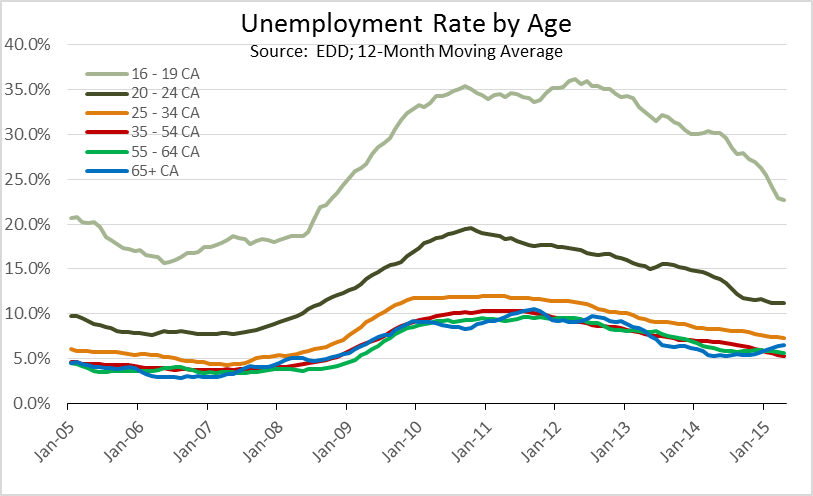
- Looking at the longer term, youth (ages 16-19) and young adults (ages 20-24) have generally experienced elevated unemployment rates, but both groups saw substantial spikes during the recession. While the gaps have narrowed somewhat, significant gaps remain while the other age groups have returned to a much smaller range between their unemployment rates.

- Compared to the US averages, California youth (ages 16-19) show substantially higher unemployment rates, a situation likely affected by the state’s lag in creating employment opportunities at the same pace as employment growth as well as California’s substantially higher minimum wage.
- Young adults—ages 20-24 and 25-34—tracked closer with their national counterparts prior to the recession and following the gap that opened up during the recession, and generally returning to these trends. Differences remain, however, through the much lower labor force participation rates.
- Ages 35-54 and 55-64 have continued to follow an unemployment rate profile similar to the US averages. Ages 65+ (not shown) show a less consistent relationship, likely due to a combination of employment factors and the smaller CPS sample size for this group.
Note: All data sources, methodologies, and historical data series available at CenterforJobs.org.