Highlights for policy makers:
- Unemployment Rate Rises to 5.4%; Total Employment Eases by 3,200
- Labor Force Participation Rate Unchanged at 61.9%
- State Employment Growth Rankings
- Nonfarm Jobs Increase 40,300
- Five Industries Below 2007 Pre-Recession Job Levels
- Two-Tier Economy Persists
- 8 California MSAs in the 10 Worst Unemployment Rates Nationally
Unemployment Rate Rises to 5.4%; Total Employment Eases by 3,200
The Labor Force data for June 2016 (seasonally adjusted; California preliminary) is shown below, along with the change from the prior month:
| Seasonally Adjusted | California | US | ||
|---|---|---|---|---|
| Jun 2016 | Change from May 2016 | Jun 2016 | Change from May 2016 | |
| Unemployment Rate | 5.4 | 0.2 | 4.9 | 0.2 |
| Labor Force | 19,100,900 | 0.1% | 158,880,000 | 0.3% |
| Participation Rate | 61.9 | 0.0 | 62.7 | 0.1 |
| Employment | 18,078,500 | 0.0% | 151,097,000 | 0.0% |
| Unemployment | 1,022,400 | 2.8% | 7,783,000 | 4.7% |
The related not seasonally adjusted numbers (California preliminary), with the change from June 2015:
| Not Seasonally Adjusted | California | US | ||
|---|---|---|---|---|
| Jun 2016 | Change from Jun 2015 | Jun 2016 | Change from Jun 2015 | |
| Unemployment Rate | 5.7 | -0.5 | 5.1 | -0.4 |
| Labor Force | 19,181,200 | 1.0% | 160,135,000 | 1.2% |
| Participation Rate | 62.2 | -0.1 | 63.2 | 0.1 |
| Employment | 18,093,500 | 1.5% | 151,990,000 | 1.6% |
| Unemployment | 1,087,700 | -7.8% | 8,144,000 | -5.7% |
California Employment Development Department’s (EDD) latest release shows on a seasonally adjusted basis, total employment essentially remained level, edging down 3,200 from May. Unemployed rose by 27,400. California’s seasonally adjusted unemployment rate rose from 5.2% in May to 5.4% in June. The unadjusted rate decreased from 6.2% in June 2015 to 5.7% in June 2016. California’s seasonally adjusted unemployment rate was the 16th highest among the states.
Total US employment saw a seasonally adjusted increase of only 67,000, while the number of unemployed increased by 347,000. The US unemployment rate rose from 4.7% in May to 4.9% in June.
Labor Force Participation Rate Unchanged at 61.9%
California’s participation rate (seasonally adjusted) remained unchanged from May 2016 at 61.9%. The comparable US rate increased 0.1% to 62.7%.
California’s seasonally adjusted labor force participation rate continues to remain below the previous lows recorded in 1976. The revised labor force data shows the participation rate has remained essentially level since August 2015, alternating between 61.9% and 62.0% during this period.
The labor force participation rate has direct implications to a range of current policy challenges. As households have fewer income earners, the disparity in household incomes increases while the ability of households to afford the state’s continuously rising housing costs decreases. This relative decline in employed also translates into a relatively smaller tax base for state government finances, increasing the overall volatility of a system that is increasingly dependent on the incomes of only a few income earners. The 4% drop since 2008 represents 1.2 million Californians who are not now in the labor force; the 5.3% drop from the prior 2001 peak represents 1.6 million. While some of this shift can be attributed to demographic changes, California has a relatively younger population than the US average and like the rest of the US, has seen increases in the age at which workers retire, yet the state’s participation rate has remained below the US average since 2002.
State Employment Growth Rankings
| Rank | Number of Employed | Percentage Change | Population Adjusted (employment growth per 1,000 civilian noninstitutional population) |
|---|---|---|---|
| 1 | CA 308,211 | OR 5.7% | OR 33.0 |
| 2 | TX 234,004 | TN 4.3% | DE 24.9 |
| 3 | FL 188,316 | DE 4.2% | TN 24.2 |
| 4 | GA 146,672 | AR 3.9% | DC 23.4 |
| 5 | NC 133,046 | DC 3.6% | AR 21.2 |
| 6 | MI 132,536 | AZ 3.4% | IN 19.8 |
| 7 | TN 124,873 | GA 3.3% | CO 19.2 |
| 8 | OR 106,205 | IN 3.3% | AZ 19.2 |
| 9 | IN 101,563 | SC 3.2% | GA 18.9 |
| 10 | AZ 101,019 | CO 3.0% | SC 17.7 |
| 11 | OH 97,791 | NC 3.0% | NC 17.1 |
| 12 | IL 90,916 | MI 3.0% | MI 16.8 |
| 13 | CO 81,420 | WA 2.4% | WA 14.0 |
| 14 | PA 79,422 | ID 2.2% | NH 13.4 |
| 15 | WA 78,846 | FL 2.1% | UT 13.3 |
| 16 | SC 67,545 | UT 2.0% | ID 13.3 |
| 17 | NJ 65,399 | NH 2.0% | WI 12.1 |
| 18 | NY 56,516 | TX 1.9% | FL 11.6 |
| 19 | WI 54,867 | WI 1.9% | TX 11.4 |
| 20 | MA 49,537 | KY 1.8% | OH 10.7 |
| 21 | AR 48,742 | OH 1.8% | CA 10.1 |
| 22 | MO 46,788 | CA 1.7% | MD 9.9 |
| 23 | MD 46,630 | AL 1.7% | MO 9.9 |
| 24 | AL 33,843 | HI 1.6% | KY 9.8 |
| 25 | KY 33,671 | MO 1.6% | HI 9.7 |
| 26 | UT 28,672 | MD 1.6% | NJ 9.2 |
| 27 | MN 25,974 | NJ 1.5% | AL 8.9 |
| US 2,375,000 | US 1.6% | US 9.4 |
Between June 2015 and June 2016, Bureau of Labor Statistics (BLS) data shows the total number of employed in California increased by 308,211 (seasonally adjusted), or 13.0% of the total net employment gains in this period for the US. Measured by percentage change in employment over the year, California was 22nd highest. Adjusted for population, California ranked 21st.
Nonfarm Jobs Increase 40,300
EDD reported that between May and June 2016, seasonally adjusted nonfarm payroll jobs increased by 40,300. May’s gains were revised upwards to 27,500 from the previously reported gain of 15,200.
Looking at the not seasonally adjusted numbers, hiring saw increases in all but 2 industries. The change in total payroll jobs from May 2016 saw the largest increases in Accommodation & Food Services (15,500), Arts, Entertainment & Recreation (14,900), and Professional, Scientific & Technical Services (11,900). Declines were in Government (-2,900) and Educational Services (-11,500) as schools began to enter the summer vacation period.
| Not Seasonally Adjusted Payroll Jobs | May 2016 | Jun 2016 | Change Jun 2016 – May 2016 | Change Jun 2016 – Jun 2015 |
|---|---|---|---|---|
| Total Farm | 480,300 | 484,300 | 4,000 | 15,800 |
| Mining & Logging | 25,500 | 26,300 | 800 | -3,100 |
| Construction | 759,900 | 767,500 | 7,600 | 37,500 |
| Manufacturing | 1,278,900 | 1,290,300 | 11,400 | -6,800 |
| Wholesale Trade | 738,400 | 745,500 | 7,100 | 26,200 |
| Retail Trade | 1,665,600 | 1,672,900 | 7,300 | 34,600 |
| Transportation, Warehousing & Utilities | 561,700 | 563,700 | 2,000 | 16,000 |
| Information | 493,400 | 494,900 | 1,500 | 10,700 |
| Finance & Insurance | 528,700 | 530,000 | 1,300 | 4,800 |
| Real Estate & Rental & Leasing | 281,000 | 283,800 | 2,800 | 11,700 |
| Professional, Scientific & Technical Services | 1,252,400 | 1,264,300 | 11,900 | 67,700 |
| Management of Companies & Enterprises | 233,700 | 234,700 | 1,000 | 4,400 |
| Administrative & Support & Waste Services | 1,075,400 | 1,084,800 | 9,400 | 38,000 |
| Educational Services | 375,000 | 363,500 | -11,500 | 31,600 |
| Health Care & Social Assistance | 2,177,700 | 2,177,900 | 200 | 81,700 |
| Individual & Family Services | 585,200 | 591,900 | 6,700 | 24,400 |
| Arts, Entertainment, & Recreation | 307,700 | 322,600 | 14,900 | 24,700 |
| Accommodation & Food Service | 1,595,200 | 1,610,700 | 15,500 | 58,400 |
| Other Services | 555,900 | 558,400 | 2,500 | 10,200 |
| Government | 2,567,900 | 2,565,000 | -2,900 | 69,500 |
| Total Nonfarm | 16,474,000 | 16,556,800 | 82,800 | 517,800 |
| Total Wage & Salary | 16,954,300 | 17,041,100 | 86,800 | 533,600 |
By total number of new jobs, California had the highest increase in seasonally adjusted nonfarm jobs among the states from June 2014 to June 2015, at 461,100 or 18.8% of the US net increase. By percentage growth in jobs, California was 7th highest, and by population adjusted jobs growth, 9th highest.
| Rank | Number of Jobs | Employment Growth (%) | Population Adjusted (job growth per 1,000 civilian noninstitutional population) |
|---|---|---|---|
| 1 | CA 461,100 | OR 3.2% | UT 19.9 |
| 2 | FL 244,500 | UT 3.2% | DE 18.4 |
| 3 | TX 171,100 | DE 3.1% | OR 17.6 |
| 4 | GA 123,200 | FL 3.0% | WA 15.9 |
| 5 | NY 103,100 | AZ 2.9% | DC 15.6 |
| 6 | MI 91,500 | GA 2.9% | GA 15.6 |
| 7 | WA 90,700 | CA 2.9% | ID 15.1 |
| 8 | NC 89,100 | WA 2.9% | NV 15.0 |
| 9 | OH 81,600 | ID 2.8% | CA 15.0 |
| 10 | AZ 76,300 | NV 2.7% | FL 14.7 |
| 11 | VA 74,500 | SC 2.6% | AZ 14.2 |
| 12 | NJ 69,000 | CO 2.4% | CO 14.2 |
| 13 | MA 67,300 | TN 2.3% | SC 13.5 |
| 14 | TN 66,800 | HI 2.3% | HI 13.4 |
| 15 | PA 62,700 | MD 2.2% | TN 12.8 |
| 16 | CO 61,500 | MI 2.2% | MD 12.3 |
| 17 | MD 58,600 | NC 2.1% | MA 12.1 |
| 18 | OR 57,700 | VA 1.9% | MI 11.6 |
| 19 | SC 52,300 | MA 1.9% | VA 11.4 |
| 20 | WI 47,800 | AR 1.7% | NC 11.3 |
| US 2,451,000 | US 1.7% | US 9.7 |
Five Industries Below 2007 Pre-Recession Job Levels
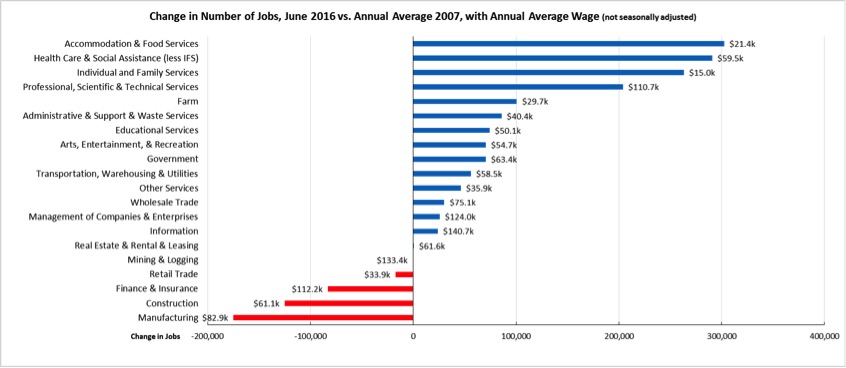
Comparing the number of jobs by industry in June 2016 (not seasonally adjusted), five industries showed employment below the 2007 pre-recession levels. In the highest gain industries, Accommodation & Food Services—the second lowest wage industry—became the leading industry as a result of seasonal tourism. The highest wage blue collar industry—Mining & Logging—remained slightly in negative territory as oil prices remained low.
Two-Tier Economy Persists
Unemployment rates (all data is not seasonally adjusted) continue to vary widely across the state, ranging from 4.2% in the Bay Area to more than double at 9.7% in the Central Valley.
| Not Seasonally Adjusted | Unemployment Rate (%) June 2016 |
|---|---|
| California | 5.7 |
| Bay Area | 4.2 |
| Orange County | 4.4 |
| Los Angeles | 5.2 |
| Sacramento Region | 5.6 |
| Central Coast | 5.8 |
| San Diego/Imperial | 6.0 |
| Central Sierra | 6.0 |
| Inland Empire | 6.6 |
| Upstate California | 7.3 |
| Central Valley | 9.7 |
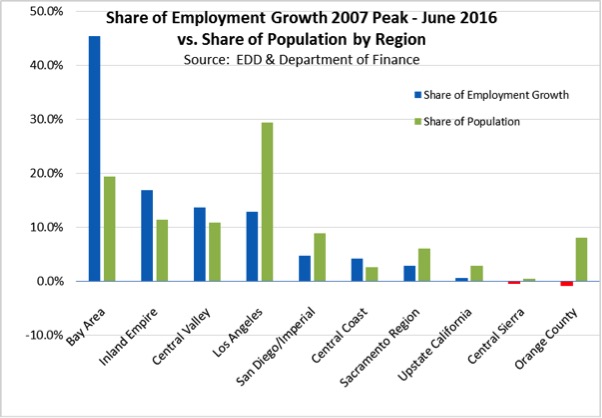
Looking at the regional shifts in the state’s economy, the Bay Area continues to dominate net employment growth. Compared to the precession employment peak, the Bay Area with just under 20% of the population accounts for 45.4% of the net employment growth. Inland Empire and Central Valley have both generated higher employment growth than Los Angeles Region, which with nearly 30% of the population contains only 12.9% of the net employment gains.
By Legislative District:
| Lowest 10 Unemployment Rates | |||||
|---|---|---|---|---|---|
| CD 18 (Eshoo – D) | 3.3 | SD 13 (Hill – D) | 3.2 | AD 22 (Mullin – D) | 3.1 |
| CD 12 (Pelosi – D) | 3.3 | SD 11 (Leno – D) | 3.6 | AD 16 (Baker – R) | 3.1 |
| CD 45 (Walters – R) | 3.6 | SD 37 (Moorlach – R) | 3.8 | AD 24 (Gordon – D) | 3.3 |
| CD 33 (Lieu – D) | 3.7 | SD 26 (Allen – D) | 3.8 | AD 28 (Low – D) | 3.4 |
| CD 14 (Speier – D) | 3.7 | SD 39 (Block – D) | 4.0 | AD 17 (Chiu – D) | 3.6 |
| CD 52 (Peters – D) | 3.7 | SD 36 (Bates – R) | 4.2 | AD 66 (Hadley – R) | 3.6 |
| CD 17 (Honda – D) | 3.8 | SD 25 (Liu – D) | 4.3 | AD 19 (Ting – D) | 3.6 |
| CD 27 (Chu – D) | 3.9 | SD 15 (Beall – D) | 4.3 | AD 77 (Maienschein – R) | 3.7 |
| CD 48 (Rohrabacher – R) | 4.2 | SD 32 (Mendoza – D) | 4.4 | AD 74 (Harper – R) | 3.7 |
| CD 02 (Huffman – D) | 4.2 | SD 07 (Glazer – D) | 4.4 | AD 73 (Brough – R) | 3.8 |
| Highest 10 Unemployment Rates | |||||
|---|---|---|---|---|---|
| CD 36 (Ruiz – D) | 7.1 | SD 28 (Stone – R) | 6.4 | AD 80 (Gonzalez – D) | 7.7 |
| CD 08 (Cook – R) | 7.2 | SD 31 (Roth – D) | 6.7 | AD 03 (Gallagher – R) | 8.2 |
| CD 41 (Takano – D) | 7.5 | SD 20 (Leyva – D) | 6.7 | AD 23 (Patterson – R) | 8.3 |
| CD 09 (McNerney – D) | 7.9 | SD 04 (Nielsen – R) | 7.0 | AD 34 (Grove – R) | 8.8 |
| CD 10 (Denham – R) | 8.6 | SD 08 (Berryhill – R) | 8.0 | AD 13 (Eggman – D) | 8.9 |
| CD 22 (Nunes – R) | 8.9 | SD 05 (Galgiani – D) | 8.3 | AD 26 (Mathis – R) | 10.6 |
| CD 23 (McCarthy – R) | 9.2 | SD 12 (Cannella – R) | 9.0 | AD 31 (Arambula – D) | 10.7 |
| CD 16 (Costa – D) | 10.6 | SD 16 (Fuller – R) | 9.0 | AD 21 (Gray – D) | 10.8 |
| CD 21 (Valadao – R) | 11.8 | SD 40 (Hueso – D) | 10.2 | AD 32 (Salas – D) | 12.7 |
| CD 51 (Vargas – D) | 12.0 | SD 14 (Vidak – R) | 12.4 | AD 56 (Garcia – D) | 14.0 |
8 California MSAs in the 10 Worst Unemployment Rates Nationally
While employment continues to improve in parts of the state, other portions of California continue to experience some of the worst unemployment rates in the nation. Of the 10 Metropolitan Statistical Areas (MSAs) with the worst unemployment rates nationally, 8 are in California. Of the 20 worst, 10 are in California.
| US Rank | MSA | May 2016 Unemployment Rate |
|---|---|---|
| 367 | Stockton-Lodi, CA Metropolitan Statistical Area | 7.1 |
| 369 | Atlantic City-Hammonton, NJ Metropolitan Statistical Area | 7.2 |
| 369 | Lafayette, LA Metropolitan Statistical Area | 7.2 |
| 369 | Vineland-Bridgeton, NJ Metropolitan Statistical Area | 7.2 |
| 372 | Danville, IL Metropolitan Statistical Area | 7.3 |
| 373 | Casper, WY Metropolitan Statistical Area | 7.5 |
| 374 | Weirton-Steubenville, WV-OH Metropolitan Statistical Area | 7.6 |
| 375 | Yakima, WA Metropolitan Statistical Area | 7.7 |
| 376 | Modesto, CA Metropolitan Statistical Area | 8.0 |
| 377 | Farmington, NM Metropolitan Statistical Area | 8.1 |
| 378 | Ocean City, NJ Metropolitan Statistical Area | 8.3 |
| 379 | Fresno, CA Metropolitan Statistical Area | 8.5 |
| 379 | Madera, CA Metropolitan Statistical Area | 8.5 |
| 379 | Yuba City, CA Metropolitan Statistical Area | 8.5 |
| 382 | Hanford-Corcoran, CA Metropolitan Statistical Area | 8.6 |
| 383 | Visalia-Porterville, CA Metropolitan Statistical Area | 9.5 |
| 384 | Bakersfield, CA Metropolitan Statistical Area | 9.7 |
| 384 | Merced, CA Metropolitan Statistical Area | 9.7 |
| 386 | El Centro, CA Metropolitan Statistical Area | 19.4 |
| 387 | Yuma, AZ Metropolitan Statistical Area | 20.9 |
Note: All data sources, methodologies, and historical data series available at CenterforJobs.org.