Highlights for policy makers:
- Unemployment Rate Continues Dropping to 4.7%; Total Employment Down 21,300
- Labor Force Participation Rate Remains at Lowest Level Since 1976
- State Employment Growth Rankings—California Remains in 3rd Place Behind Florida and Texas
- Nonfarm Jobs Down 1,400
- 6 Industries below 2007 Pre-Recession Job Levels
- Job Gains by Wage Level
- Two-Tier Economy Persists—Central Valley Unemployment More than Twice as High as Bay Area
- Bay Area Provided 44% of Net Employment Growth Since Recession
- 7 California MSAs in the 10 Worst Unemployment Rates Nationally
- Bay Area Paid 40% of Personal Income Tax in 2015 Tax Year
Unemployment Rate Remains Level at 4.7%; Total Employment Down 21,300
The Labor Force data for June 2017 (seasonally adjusted; California preliminary) is shown below, along with the change from the prior month:
| Seasonally Adjusted | California | US | ||
|---|---|---|---|---|
| Jun 2017 | Change from May 2017 | Jun 2017 | Change from May 2017 | |
| Unemployment Rate | 4.7% | 0.0 | 4.4% | 0.1 |
| Labor Force | 19,136,800 | -0.1% | 160,145,000 | 0.2% |
| Participation Rate | 62.0% | -0.1 | 62.8% | 0.1 |
| Employment | 18,237,000 | -0.1% | 153,168,000 | 0.2% |
| Unemployment | 899,800 | 0.2% | 6,977,000 | 1.7% |
The related not seasonally adjusted numbers (California preliminary), with the change from June 2016:
| Not Seasonally Adjusted | California | US | ||
|---|---|---|---|---|
| Jun 2017 | Change from Jun 2016 | Jun 2017 | Change from Jun 2016 | |
| Unemployment Rate | 4.9% | -0.7 | 4.5% | -0.6 |
| Labor Force | 19,145,700 | 0.2% | 161,337,000 | 0.8% |
| Participation Rate | 61.9% | -0.4 | 63.3% | 0.1 |
| Employment | 18,208,300 | 0.9% | 154,086,000 | 1.4% |
| Unemployment | 937,400 | -11.6% | 7,250,000 | -11.0% |
California Employment Development Department’s (EDD) latest release shows on a seasonally adjusted basis, total employment dropped 21,300 from May, while the number of unemployed essentially remained level with an improvement of only 1,400. The labor force dropped by 19,900.
California’s seasonally adjusted unemployment rate remained level at 4.7%, matching the previous lows (since 1976) in November and December 2000. California tied with Nevada for the 12th highest unemployment rate among the states. The unadjusted rate dropped from 5.6% in June 2016 to 4.9%.
Total US employment saw a seasonally adjusted increase of 245,000 from May, while the number of unemployed increased by 116,000. The national unemployment rate edged up 0.1 point to 4.4%. The national labor force numbers expanded by 361,000.
Labor Force Participation Rate at Lowest Level Since 1976
California’s participation rate (seasonally adjusted) in June was unchanged at 62.0%, while the US rate edged up 0.1 point to 62.8%.
The seasonally adjusted California participation rate in June remained at its lowest level since 1976.
State Employment Growth Rankings—California Remains in 3rd Place Behind Florida and Texas
| Rank | Number of Employed | Percentage Change | Population Adjusted (employment growth per 1,000 civilian noninstitutional population) |
|---|---|---|---|
| 1 | FL 409,600 | OR 4.4% | UT 28.8 |
| 2 | TX 220,800 | UT 4.3% | CO 26.2 |
| 3 | CA 198,000 | FL 4.3% | OR 25.9 |
| 4 | NY 182,500 | CO 4.1% | FL 24.1 |
| 5 | GA 153,300 | KY 4.1% | KY 22.2 |
| 6 | CO 113,300 | GA 3.3% | GA 19.4 |
| 7 | VA 97,300 | AZ 2.9% | DC 18.1 |
| 8 | MI 94,800 | DC 2.7% | MA 17.0 |
| 9 | MA 93,900 | MA 2.7% | WI 16.7 |
| 10 | WA 89,700 | WA 2.6% | AZ 16.4 |
| 11 | AZ 88,200 | WI 2.6% | WA 15.7 |
| 12 | NC 86,200 | VA 2.4% | VA 14.9 |
| 13 | OR 85,000 | CT 2.4% | CT 14.8 |
| 14 | KY 76,800 | NV 2.3% | MD 14.8 |
| 15 | WI 76,500 | MD 2.3% | NV 13.6 |
| 16 | MD 69,800 | MS 2.3% | ME 13.4 |
| 17 | OH 67,900 | AR 2.2% | HI 12.4 |
| 18 | PA 63,500 | ME 2.2% | AR 12.4 |
| 19 | UT 63,400 | SC 2.1% | RI 12.4 |
| 20 | TN 56,200 | MI 2.1% | ND 12.0 |
| 21 | IN 54,000 | HI 2.1% | MI 12.0 |
| 22 | NJ 49,000 | RI 2.0% | MS 12.0 |
| 23 | MN 47,300 | NY 2.0% | SC 11.8 |
| 24 | SC 45,900 | TN 1.9% | NY 11.5 |
| 25 | CT 42,400 | NC 1.9% | MN 11.0 |
| 26 | AL 36,900 | AL 1.8% | NC 10.9 |
| 27 | NV 31,200 | TX 1.7% | TN 10.8 |
| 28 | AR 28,700 | ND 1.7% | TX 10.6 |
| 29 | MS 27,400 | IN 1.7% | IN 10.5 |
| 30 | IL 14,800 | AK 1.7% | AK 10.3 |
| 31 | ME 14,700 | MN 1.6% | AL 9.7 |
| 32 | HI 13,600 | ID 1.4% | ID 8.6 |
| 33 | NM 11,200 | NM 1.3% | OH 7.4 |
| 34 | ID 10,900 | OH 1.3% | NM 7.0 |
| 35 | OK 10,900 | WV 1.2% | NJ 6.9 |
| 36 | RI 10,600 | NJ 1.1% | CA 6.5 |
| 37 | DC 10,100 | CA 1.1% | PA 6.2 |
| 38 | KS 9,600 | PA 1.0% | WV 6.0 |
| 39 | WV 8,800 | SD 0.8% | SD 5.6 |
| 40 | ND 7,000 | NH 0.7% | NH 4.7 |
| US 1,865,000 | US 1.2% | US 7.4 |
Between June 2016 and June 2017, Bureau of Labor Statistics (BLS) data shows the total number of employed in California increased by 198,000 (seasonally adjusted), or 10.6% of the total net employment gains in this period for the US. California remained in 3rd place behind Florida (which has a civilian working age population only 55% as large as California’s) at 400,700 and Texas (68% as large) at 220,800. Measured by percentage change in employment over the year, California dropped to 37th highest. Adjusted for working age population, California dropped to 36th.
Nonfarm Jobs Down 1,400
EDD reported that between May and June 2017, seasonally adjusted nonfarm wage and salary jobs declined by 1,400. May’s gains were revised up to 24,600 from the previously reported 17,600
Looking at the not seasonally adjusted nonfarm numbers, hiring saw increases in all but three industries over the year. The change in total payroll jobs from June 2016 saw the largest increases in Construction (54,200), Government (50,300), and Food Services (34,300). Declines were in Manufacturing (-8,200), Utilities (-1,200), and Mining & Logging (-1,100).
| Not Seasonally Adjusted Payroll Jobs | Jun 2017 | May 2017 | Change Jun 2017 – May 2017 | Change Jun 2017 – Jun 2016 |
|---|---|---|---|---|
| Total Farm | 486,100 | 484,300 | 1,800 | 11,400 |
| Mining and Logging | 23,700 | 22,800 | 900 | -1,100 |
| Construction | 827,500 | 810,100 | 17,400 | 54,200 |
| Manufacturing | 1,299,300 | 1,295,800 | 3,500 | -8,200 |
| Wholesale Trade | 737,200 | 735,700 | 1,500 | 17,800 |
| Retail Trade | 1,665,200 | 1,660,300 | 4,900 | 11,900 |
| Utilities | 58,300 | 58,300 | 0 | -1,200 |
| Transportation & Warehousing | 535,600 | 529,500 | 6,100 | 16,300 |
| Information | 523,900 | 528,900 | -5,000 | 0 |
| Finance & Insurance | 548,300 | 546,500 | 1,800 | 5,100 |
| Real Estate & Rental & Leasing | 283,700 | 280,700 | 3,000 | 6,300 |
| Professional, Scientific & Technical Services | 1,228,900 | 1,224,800 | 4,100 | 23,800 |
| Management of Companies & Enterprises | 228,900 | 227,200 | 1,700 | 3,300 |
| Administrative & Support & Waste Services | 1,103,600 | 1,085,100 | 18,500 | 23,900 |
| Educational Services | 363,000 | 376,500 | -13,500 | 17,400 |
| Health Care | 1,481,300 | 1,482,400 | -1,100 | 33,000 |
| Social Assistance | 753,300 | 755,900 | -2,600 | 24,700 |
| Arts, Entertainment & Recreation | 318,300 | 306,100 | 12,200 | 10,200 |
| Accommodation | 231,800 | 225,300 | 6,500 | 7,300 |
| Food Services | 1,418,600 | 1,415,400 | 3,200 | 34,300 |
| Other Services | 579,100 | 577,200 | 1,900 | 24,400 |
| Government | 2,595,800 | 2,611,500 | -15,700 | 50,300 |
| Total Nonfarm | 16,805,300 | 16,756,000 | 49,300 | 353,700 |
| Total Wage and Salary | 17,291,400 | 17,240,300 | 51,100 | 365,100 |
By total number of new jobs, California continued to show the second highest increase in seasonally adjusted nonfarm jobs among the states from June 2016 to June 2017, at 261,400 or 11.7% of the US net increase. Texas led jobs growth with 319,300 jobs, and Florida was a close third with 238,600. By percentage growth in jobs, California remained at 23rd highest at 1.6%, equal to the US average of 1.6%. By population adjusted jobs growth, California rose to 28th highest, slightly below the US average.
| Rank | Number of Jobs | Employment Growth (%) | Population Adjusted (job growth per 1,000 civilian noninstitutional population) |
|---|---|---|---|
| 1 | TX 319,300 | NV 3.8% | NV 21.2 |
| 2 | CA 261,400 | UT 3.0% | UT 19.7 |
| 3 | FL 238,600 | FL 2.9% | DC 18.2 |
| 4 | NY 148,300 | GA 2.8% | GA 15.6 |
| 5 | GA 122,600 | OR 2.7% | TX 15.3 |
| 6 | WA 76,400 | TX 2.7% | OR 15.3 |
| 7 | PA 74,000 | WA 2.4% | MN 14.5 |
| 8 | NC 72,200 | ID 2.2% | FL 14.4 |
| 9 | MA 65,900 | MN 2.2% | WA 13.4 |
| 10 | MN 62,600 | CO 2.1% | CO 12.7 |
| 11 | MI 60,800 | AZ 2.1% | ID 11.9 |
| 12 | TN 59,300 | MD 2.1% | MA 11.9 |
| 13 | AZ 56,900 | AL 2.1% | MD 11.9 |
| 14 | OH 56,800 | AR 2.0% | ND 11.5 |
| 15 | MD 56,100 | TN 2.0% | TN 11.4 |
| 16 | CO 54,900 | MA 1.9% | NE 11.1 |
| 17 | IL 54,100 | NC 1.7% | AR 10.8 |
| 18 | OR 50,200 | NH 1.7% | AL 10.6 |
| 19 | VA 50,000 | MO 1.6% | AZ 10.6 |
| 20 | NV 48,700 | IA 1.6% | IA 10.5 |
| 21 | NJ 48,300 | KY 1.6% | NH 10.1 |
| 22 | MO 46,600 | NE 1.6% | MO 9.8 |
| 23 | IN 45,200 | CA 1.6% | NY 9.4 |
| 24 | UT 43,400 | NY 1.6% | NC 9.2 |
| 25 | AL 40,600 | ND 1.5% | HI 9.0 |
| 26 | WI 38,400 | HI 1.5% | KY 8.9 |
| 27 | KY 30,900 | IN 1.5% | IN 8.8 |
| 28 | SC 29,700 | SC 1.4% | CA 8.5 |
| 29 | IA 25,600 | MT 1.4% | WI 8.4 |
| 30 | AR 24,900 | MI 1.4% | MT 8.1 |
| 31 | LA 20,700 | RI 1.4% | RI 7.8 |
| 32 | NE 16,200 | WI 1.3% | MI 7.7 |
| 33 | CT 15,400 | DC 1.3% | VA 7.6 |
| US 2,238,000 | US 1.6% | US 8.8 |
Six Industries Below 2007 Pre-Recession Job Levels
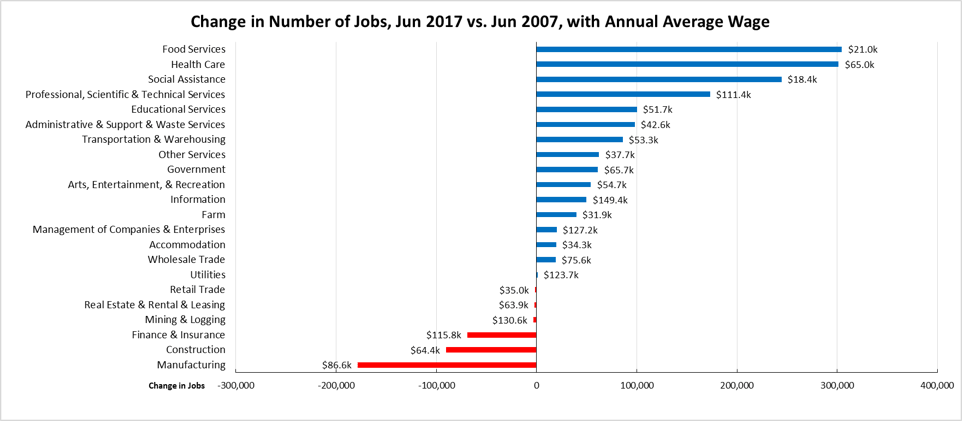
Comparing the number of jobs by industry in June 2017 (not seasonally adjusted), 6 industries had employment below the 2007 pre-recession levels. In the highest gain industries, lower wage Food Services and Health Care were essentially tied as the leading job gains, while lower wage Social Assistance and higher wage Professional, Scientific & Technical Services remained in 3rd and 4th place, respectively. Of the lagging industries, three—Manufacturing, Mining & Logging, and Construction—are blue collar middle class wage industries, while the higher wage Finance & Insurance also continued to lose ground.
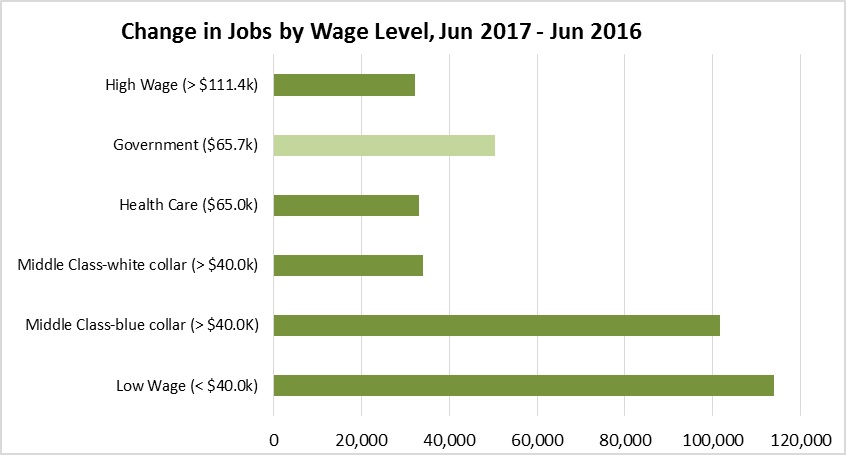
Job Gains by Wage Level
In the recent May Budget Revision, the Governor again pointed to the increasing share of lower wage jobs as one of the prime causes of slowing state revenues growth: The level of wages has been revised downward, and cash receipts have been significantly below forecast. The following chart illustrates this trend, according to the industry wage classification used previously in other Center analyses of this issue. In the chart below, Private sector jobs are shown in the dark green bands, while Government is shown in the lighter. As indicated, nearly one-third of jobs growth over the past 12 months has been in the low wage industries. Middle Class-blue collar jobs also show improvement primarily as a result of growth in Construction over the year.
Two-Tier Economy Persists – Central Valley Unemployment More than Twice as High as Bay Area
Unemployment rates (all data is not seasonally adjusted) continue to vary widely across the state, ranging from 3.7% in the Bay Area to more than twice as large at 8.6% in the Central Valley.
| Not Seasonally Adjusted | Unemployment Rate (%) June 2017 |
|---|---|
| California | 4.9 |
| Bay Area | 3.7 |
| Orange County | 3.8 |
| Los Angeles | 4.5 |
| Sacramento Region | 4.8 |
| Central Sierra | 5.0 |
| Central Coast | 5.0 |
| San Diego/Imperial | 5.1 |
| Inland Empire | 5.5 |
| Upstate California | 6.2 |
| Central Valley | 8.6 |
By Legislative District:
| Lowest 10 Unemployment Rates | |||||
|---|---|---|---|---|---|
| CD18 (Eshoo-D) | 2.8 | SD13 (Hill-D) | 2.8 | AD16 (Baker-R) | 2.6 |
| CD12 (Pelosi-D) | 3.0 | SD11 (Wiener-D) | 3.2 | AD22 (Mullin-D) | 2.7 |
| CD52 (Peters-D) | 3.1 | SD26 (Allen-D) | 3.3 | AD24 (Berman-D) | 2.9 |
| CD45 (Walters-R) | 3.2 | SD39 (Atkins-D) | 3.4 | AD28 (Low-D) | 2.9 |
| CD33 (Lieu-D) | 3.2 | SD37 (Moorlach-R) | 3.4 | AD77 (Maienschein-R) | 3.1 |
| CD14 (Speier-D) | 3.3 | SD36 (Bates-R) | 3.5 | AD17 (Chiu-D) | 3.2 |
| CD17 (Khanna-D) | 3.3 | SD32 (Mendoza-D) | 3.7 | AD66 (Muratsuchi-D) | 3.2 |
| CD27 (Chu-D) | 3.4 | SD15 (Beall-D) | 3.7 | AD19 (Ting-D) | 3.2 |
| CD15 (Swalwell-D) | 3.5 | SD07 (Glazer-D) | 3.7 | AD73 (Brough-R) | 3.3 |
| CD49 (Issa-R) | 3.5 | SD10 (Wieckowski-D) | 3.7 | AD78 (Gloria-D) | 3.3 |
| Highest 10 Unemployment Rates | |||||
|---|---|---|---|---|---|
| CD08 (Cook-R) | 6.1 | SD31 (Roth-D) | 5.5 | AD80 (Gonzalez-D) | 6.7 |
| CD41 (Takano-D) | 6.1 | SD21 (Wilk-R) | 5.5 | AD03 (Gallagher-R) | 6.9 |
| CD44 (Barragán-D) | 6.3 | SD20 (Leyva-D) | 5.6 | AD23 (Patterson-R) | 7.4 |
| CD09 (McNerney-D) | 6.8 | SD04 (Nielsen-R) | 5.9 | AD34 (Fong-R) | 7.6 |
| CD10 (Denham-R) | 7.3 | SD08 (Berryhill-R) | 7.0 | AD13 (Eggman-D) | 7.8 |
| CD22 (Nunes-R) | 8.0 | SD05 (Galgiani-D) | 7.2 | AD21 (Gray-D) | 9.5 |
| CD23 (McCarthy-R) | 8.0 | SD16 (Fuller-R) | 7.8 | AD26 (Mathis-R) | 9.6 |
| CD16 (Costa-D) | 9.6 | SD12 (Cannella-R) | 7.9 | AD31 (Arambula-D) | 9.7 |
| CD51 (Vargas-D) | 10.2 | SD40 (Hueso-D) | 8.7 | AD32 (Salas-D) | 11.5 |
| CD21 (Valadao-R) | 10.7 | SD14 (Vidak-R) | 11.5 | AD56 (Garcia-D) | 11.6 |
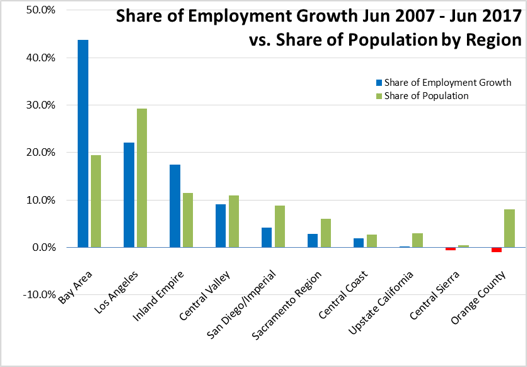
Bay Area Provided 44% of Net Employment Growth Since Recession
Containing just under 20% of the state’s population, the Bay Area was responsible for 43.8% of the net growth in employment since the pre-recession peaks in 2007. Los Angeles Region provided the next largest share at 22.1%, but spread over 29.2% of the population. Inland Empire is the only other region showing employment gains above their population share.
Seven California MSAs in the 10 Worst Unemployment Rates Nationally
According to BLS data, of the 10 Metropolitan Statistical Areas (MSAs) with the worst unemployment rates nationally, 7 are in California. Of the 20 worst, 9 are in California.
| Metropolitan Area | May 2017 rate | Rank |
|---|---|---|
| Atlantic City-Hammonton, NJ Metropolitan Statistical Area | 6.3 | 368 |
| Yakima, WA Metropolitan Statistical Area | 6.3 | 368 |
| East Stroudsburg, PA Metropolitan Statistical Area | 6.4 | 371 |
| Las Cruces, NM Metropolitan Statistical Area | 6.8 | 372 |
| Rocky Mount, NC Metropolitan Statistical Area | 6.8 | 372 |
| Beaumont-Port Arthur, TX Metropolitan Statistical Area | 7.0 | 374 |
| Brownsville-Harlingen, TX Metropolitan Statistical Area | 7.0 | 374 |
| Modesto, CA Metropolitan Statistical Area | 7.0 | 374 |
| Farmington, NM Metropolitan Statistical Area | 7.2 | 377 |
| Madera, CA Metropolitan Statistical Area | 7.2 | 377 |
| Fresno, CA Metropolitan Statistical Area | 7.4 | 379 |
| McAllen-Edinburg-Mission, TX Metropolitan Statistical Area | 7.5 | 380 |
| Ocean City, NJ Metropolitan Statistical Area | 7.5 | 380 |
| Yuba City, CA Metropolitan Statistical Area | 7.5 | 380 |
| Hanford-Corcoran, CA Metropolitan Statistical Area | 7.9 | 383 |
| Bakersfield, CA Metropolitan Statistical Area | 8.4 | 384 |
| Merced, CA Metropolitan Statistical Area | 8.5 | 385 |
| Visalia-Porterville, CA Metropolitan Statistical Area | 8.6 | 386 |
| Yuma, AZ Metropolitan Statistical Area | 18.9 | 387 |
| El Centro, CA Metropolitan Statistical Area | 20.5 | 388 |
Bay Area Paid 40% of Personal Income Tax in 2015 Tax Year
The uneven economic performance across California is also reflected in the relative contributions to state revenues from the different regions.
The state budget along with the higher baseline spending commitments made in recent years’ budget decisions have become increasingly dependent on Personal Income Tax (PIT) revenues. PIT accounts for 69.3% of all General Fund revenues in the recently enacted budget bill (up from 53.5% in 2007-08), and 50.8% of all General and Special Funds revenues (up from 44.0% in 2007-08). At the same time, the revenues that can be expected in future budget years have become increasingly volatile as an already steeply progressive revenue source has become even more so through the enactment of Propositions 30 and 55 as well the expanding use of credits and other special tax provisions as the economic effects of higher tax incidence have become apparent on specific consumer and employer decisions.
The most current data released by the Franchise Tax Board is the zip code data for the 2015 tax year (taxes paid in 2016). This data is subject to some revision in the final county tabulations that will eventually be published in the Board’s annual reports, due to amended tax filings in this and subsequent years. However, the zip code data is a “first look” that enables comparisons between the different counties and regions, as well as forming the base for the Center’s estimates of PIT paid by legislative district
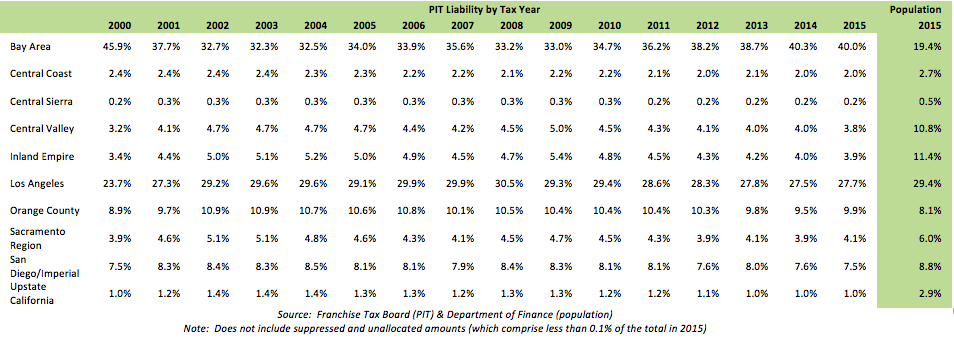
The following table shows the distribution of PIT liability by region by tax year beginning in 2000, with the population distribution from 2015 shown as a point of comparison. As indicated, the Bay Area accounted for 40% of total PIT liability in the 2015 tax year while containing only 19.4% of the state’s population. Only one other region—Orange County—contributed more PIT than its population share, but at a considerably lower premium. On a relative basis, the lowest shares came from Central Valley, Inland Empire, and Upstate California, with each accounting for a PIT share at about 1/3 their population share.
PIT Liability Distribution by Region
The table above suggests that much of the state’s budget history in the 2000s has been tied to the economic performance of the Bay Area, a point that becomes more apparent when looking at the PIT amounts shown in the following table.
PIT Liability by Region
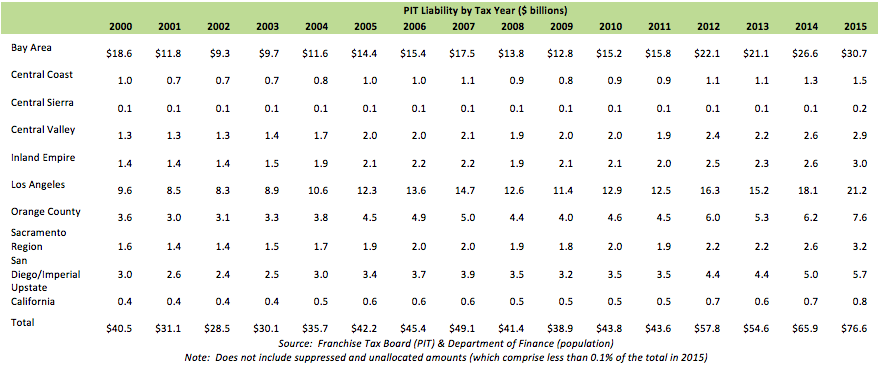
The 2000 revenues, in particular the bonus revenues from the Bay Area capital gains were the basis for significant baseline spending increases adopted at the beginning of this period. These actions provided the basic budget structure throughout most of this period, including the creation of the need for budget cuts as subsequent revenues were unable to sustain the resulting levels of spending.
As indicated in this second table, the revenue shortfalls coming from the Bay Area were much deeper and much more sustained than what occurred elsewhere in the state. The $6.8 billion PIT drop from the Bay Area accounted for nearly three-quarters of the total PIT shortfall in 2001, with the Bay Area accounting for nearly all of the further deterioration of PIT revenues in 2002. By 2004, all other regions other than Central Coast were producing PIT revenues above their 2000 levels. It took the Bay Area another 8 years and the passage of Proposition 30 to reach this benchmark, in 2012.
These trends suggest the following observations:
- Contrary to the popular assessment of California as successful model of a high regulation/high tax state, the ability of the state budget to finance that model has rebuilt its over dependence on the Bay Area and the industries of Silicon Valley—arguably among the least regulated in the nation.
- The state’s fiscal restraint shown in the early years of the economic recovery has shifted as tens of billions in baseline spending commitments have been added in recent years, largely restarting the process seen at the beginning of the 2000s. The expectations for how this spending will be covered relies on the same but now more volatile revenue source as before. Rather than balanced economic growth across all regions that would provide a wider base of public revenues, the state remains once again reliant on the Bay Area.
- The ability of the Bay Area to continue the jobs growth and revenue base growth of recent years now faces increasing constraints. The ability to hire is challenged by growing barriers to labor mobility due to high housing costs and the state’s use of a “road diet” as a regulatory strategy. The continued low performance of the state’s schools limits the available skills. These conditions exist elsewhere in the state, but the level of the associated costs in the Bay Area have to date been much higher. The failure of the state to enact reforms to contain these costs should also be considered in light of fiscal needs of the state’s current budgetary path.
Note: All data sources, methodologies, and historical data series available at CenterforJobs.org.