Highlights for policy makers:
- Unemployment Unchanged at 4.2%; Employment Down 45,300
- Labor Force Participation Rate Dips to 62.2%
- Employment Growth Ranking—California Drops to 9th
- Nonfarm Jobs Up 46,200 for Month; California Remains Ranked #2 for 12-month Gain
- Jobs Change by Industry
- Structural Shifts in State’s Economy
- Unemployment Rates by Region
- Unemployment Rates by Legislative District
- Employment Growth by Region
- MSAs with the Worst Unemployment Rates
- Chart of the Month: Economic Confidence
Unemployment Unchanged at 4.2%; Employment Down 45,300
EDD reported total employment (seasonally adjusted; June preliminary) was down 45,300 from the revised May numbers, while the number of unemployed was down 12,400. Unemployment rate was unchanged at 4.2%. The unadjusted rate was down 0.3 point from the year earlier to 4.1%.
California again had the 10th highest unemployment rate.
Total US employment saw a seasonally adjusted gain of 247,000, with the number of unemployed rising 87,000 as the national labor grew. The unemployment rate notched up to 3.7%.
| wdt_ID | Seasonally Adjusted | California (June 2019) | California (Change from May 2019) | US (June 2019) | US (Change from May 2019) |
|---|---|---|---|---|---|
| 1 | Unemployment Rate | 4.2% | 0 | 3.7% | 0.1 |
| 2 | Labor Force | 19,421,500 | -0.3% | 162,981,000 | 0.2% |
| 3 | Participation Rate | 62.2% | -0.2 | 62.9% | 0.1 |
| 4 | Employment | 18,607,800 | -0.2% | 157,005,000 | 0.2% |
| 5 | Unemployment | 813,700 | -1.5% | 5,975,000 | 1.5% |
Figure Sources: California Employment Development Department; US Bureau of Labor Statistics
Labor Force Participation Rate Dips to 62.2%
California’s seasonally adjusted labor force participation rate continued a 3–month decline to 62.2%. Nationally, the participation rate edged up to 62.9%. With the gap again expanding, the state continues to experience lower than average participation rates in spite of having a relatively younger population than the rest of the US.
For the 12 months ending June 2019, the seasonally adjusted data shows the California labor force grew only 0.3% compared to the rest of the US at 0.6%.
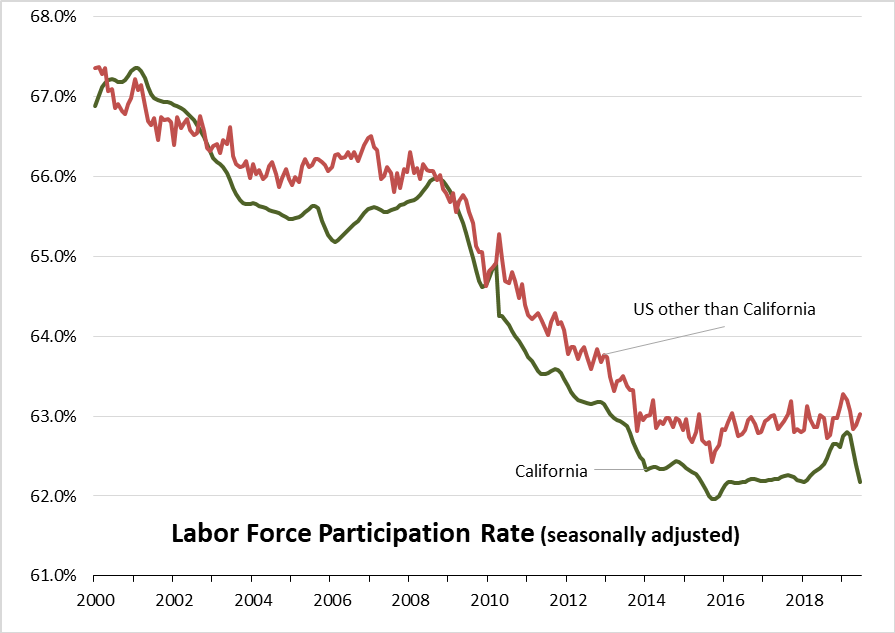
Figure Source: California Employment Development Department; US Bureau of Labor Statistics
Employment Growth Ranking—California Drops to 9th
In another sign of the economy’s slowing, the total number of persons employed (seasonally adjusted) over the 12 months ending in June grew by only 58,000. California dropped to 9th place with Texas leading with an additional 240,800 persons employed over this period, and Florida in second place with a gain of 139,400.
Based on percentage growth, California had a 0.3% expansion in employment, below the average for the rest of the US at 1.0%. Ranked among the states, California’s growth rate dropped to 39th place, while Tennessee led at 3.1%.
| wdt_ID | State Overview | Employment Change | Percentage Change |
|---|---|---|---|
| 1 | California | 58,600 | 0.3% |
| 2 | State Rank | 9 | 39 |
| 3 | US other than CA | 1,354,351 | 1.0% |
Figure Source: US Bureau of Labor Statistics
Nonfarm Jobs Up 46,200 for Month; California Remains Ranked #2 for 12-month Gain
Nonfarm jobs (seasonally adjusted) were up 46,200 as May’s gains were revised to 21,600 from the previously reported 46,000.
For the 12 months ending June, total jobs growth was 296,100, keeping the state in 2nd place behind Texas which gained 315,600 jobs in this period, with Florida in third at 218,800.
Adjusting for population size, California came in at 14th among the states, with a 12-month jobs growth rate of 1.7%
| wdt_ID | State Overview | Job Change | Percentage Change |
|---|---|---|---|
| 1 | California | 296,100 | 1.7% |
| 2 | State Rank | 2 | 14 |
| 3 | US other than CA | 2,004,900 | 1.5% |
Figure Sources: California Employment Development Department; US Bureau of Labor Statistics
Jobs Change by Industry
In the unadjusted numbers that allow a more detailed look at industry shifts, hiring saw increases in all but 3 industries over the year.
Gains in payroll jobs were led by Professional, Scientific & Technical Services ($122.5k average annual wages), Construction ($70.1k), and Social Assistance ($19.8k) which consists primarily of publicly-funded In-Home Supportive Services (IHSS) workers.
Declines were in Retail Trade ($36.7k), Finance & Insurance ($128.1k), and Wholesale Trade ($78.3k).
All wage data is from the most current 4-quarter average from the Quarterly Census of Employment & Wages.
| wdt_ID | Industry | Not Seasonally Adjusted Payroll Jobs (June 2019) | 12-month change |
|---|---|---|---|
| 1 | Total Farm | 490.1 | 2.7 |
| 2 | Mining & Logging | 23.3 | 0.3 |
| 3 | Construction | 907.1 | 38.5 |
| 4 | Manufacturing | 1,340.3 | 10.9 |
| 5 | Wholesale Trade | 698.5 | -1.9 |
| 6 | Retail Trade | 1,657.2 | -10.1 |
| 7 | Utilities | 57.2 | 0.3 |
| 8 | Transportation & Warehousing | 618.0 | 16.1 |
| 9 | Information | 556.1 | 14.4 |
| 10 | Finance & Insurance | 539.5 | -4.9 |
| 11 | Real Estate & Rental & Leasing | 296.8 | 2.4 |
| 12 | Professional, Scientific & Technical Services | 1,316.8 | 41.5 |
| 13 | Management of Companies & Enterprises | 258.1 | 2.5 |
| 14 | Administrative & Support & Waste Services | 1,154.2 | 27.7 |
| 15 | Educational Services | 375.3 | 6.9 |
| 16 | Health Care | 1,572.9 | 32.8 |
| 17 | Social Assistance | 844.2 | 37.6 |
| 18 | Arts, Entertainment & Recreation | 334.4 | 7.4 |
| 19 | Accommodation | 240.9 | 5.8 |
| 20 | Food Services | 1,488.0 | 34.8 |
| 21 | Other Services | 583.1 | 5.3 |
| 22 | Government | 2,664.4 | 31.8 |
| 23 | Total Nonfarm | 17,526.3 | 300.1 |
| 24 | Total Wage & Salary | 18,016.4 | 302.8 |
Figure Source: California Employment Development Department
Structural Shifts in State’s Economy
Comparing current job numbers to the pre-recession levels in 2007 illustrates the structural shift in the state’s economy, with the primary jobs growth occurring in the higher and lower wage industries.
Jobs growth within the traditional middle class wage—especially blue collar industries such as Manufacturing, Construction, and Mining & Logging—continues to lag with the heavily blue collar Utilities beginning to show shrinkage as well. After stronger gains during the recovery, both Wholesale and Retail Trade have continued to show weakness, reflecting competitive pressures from nontraditional channels as well as greater use of technology in response to growing costs for labor, energy, rent, and regulation. Finance & Insurance also continues to lose ground.
Construction has gained in the past year as activity has picked up. Construction jobs remain 12,700 below the 2007 peak and 59,200 (6%) below the pre-recession high in 2006. Over half (vs. 2007) of these gaps are due to reduced activity in Residential Building Construction.
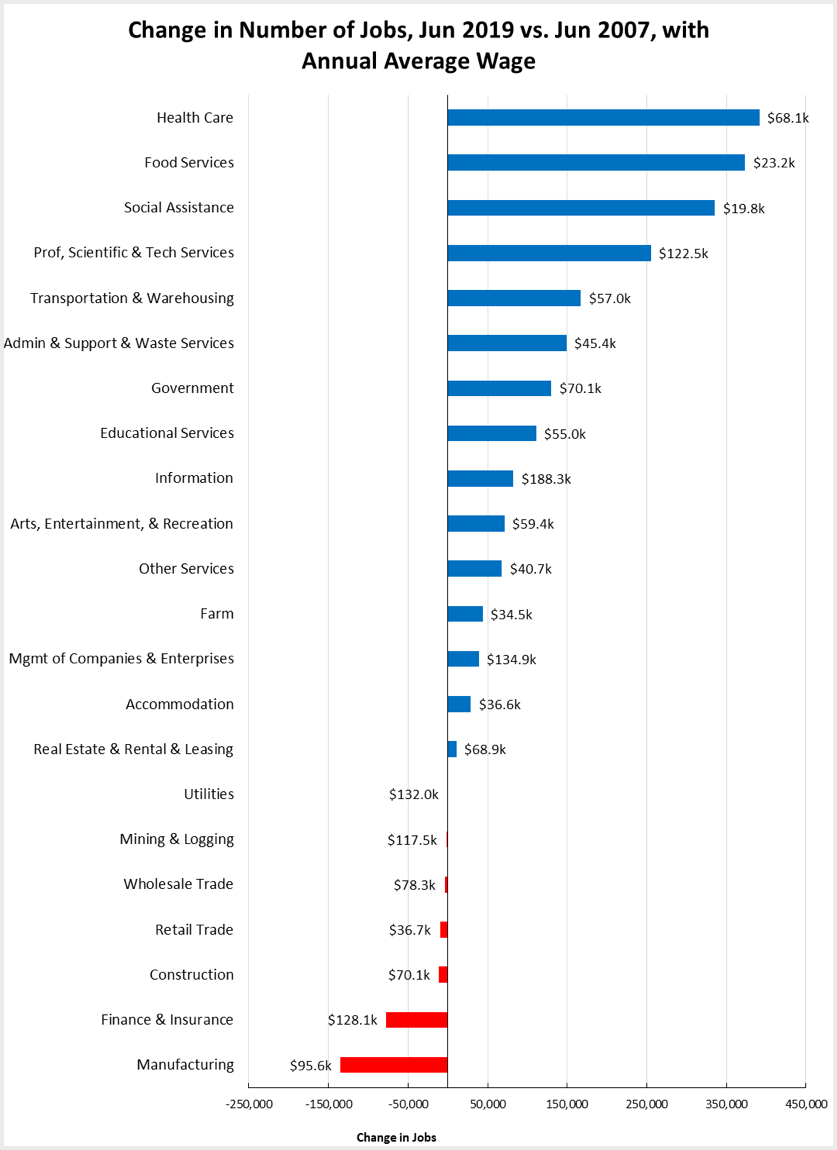
Figure Source: California Employment Development Department
Unemployment Rates by Region
| wdt_ID | Region | Unemployment Rates |
|---|---|---|
| 1 | California | 4.1 |
| 2 | Bay Area | 2.8 |
| 3 | Orange County | 3.0 |
| 4 | Sacramento | 3.7 |
| 5 | Central Sierra | 3.9 |
| 6 | San Diego/Imperial | 4.0 |
| 7 | Central Coast | 4.2 |
| 8 | Inland Empire | 4.3 |
| 9 | Los Angeles | 4.5 |
| 10 | Upstate California | 5.2 |
| 11 | Central Valley | 7.3 |
Figure Source: California Employment Development Department
Unemployment Rates by Legislative District
Lowest (June 2019)
| wdt_ID | Legislative District | Unemployment Rate | Legislative District | Unemployment Rate | Legislative District | Unemployment Rate |
|---|---|---|---|---|---|---|
| 1 | CD12 (Pelosi-D) | 2.2 | SD13 (Hill-D) | 2.0 | AD22 (Mullin-D) | 2.0 |
| 2 | CD18 (Eshoo-D) | 2.2 | SD11 (Wiener-D) | 2.4 | AD16 (Bauer-Kahan-D) | 2.0 |
| 3 | CD14 (Speier-D) | 2.4 | SD36 (Bates-R) | 2.6 | AD24 (Berman-D) | 2.2 |
| 4 | CD17 (Khanna-D) | 2.5 | SD37 (Moorlach-R) | 2.7 | AD17 (Chiu-D) | 2.3 |
| 5 | CD15 (Swalwell-D) | 2.5 | SD39 (Atkins-D) | 2.7 | AD28 (Low-D) | 2.3 |
| 6 | CD52 (Peters-D) | 2.6 | SD10 (Wieckowski-D) | 2.7 | AD25 (Chu-D) | 2.5 |
| 7 | CD49 (Levin-D) | 2.6 | SD15 (Beall-D) | 2.8 | AD19 (Ting-D) | 2.5 |
| 8 | CD45 (Porter-D) | 2.7 | SD07 (Glazer-D) | 2.9 | AD78 (Gloria-D) | 2.5 |
| 9 | CD48 (Rouda-D) | 2.7 | SD02 (McGuire-D) | 3.1 | AD73 (Brough-R) | 2.6 |
| 10 | CD02 (Huffman-D) | 3.0 | SD34 (Umberg-D) | 3.2 | AD74 (Petrie-Norris-D) | 2.6 |
Highest (June 2019)
| wdt_ID | Legislative District | Unemployment Rate | Legislative District | Unemployment Rate | Legislative District | Unemployment Rate |
|---|---|---|---|---|---|---|
| 1 | CD43 (Waters-D) | 5.3 | SD21 (Wilk-R) | 5.2 | AD03 (Gallagher-R) | 6.0 |
| 2 | CD40 (Roybal-Allard-D) | 5.3 | SD33 (Lara-D) | 5.2 | AD59 (Jones-Sawyer-D) | 6.1 |
| 3 | CD09 (McNerney-D) | 5.5 | SD30 (Mitchell-D) | 5.4 | AD64 (Gipson-D) | 6.3 |
| 4 | CD10 (Harder-D) | 6.0 | SD35 (Bradford-D) | 5.6 | AD13 (Eggman-D) | 6.5 |
| 5 | CD44 (Barragan-D) | 6.3 | SD08 (Borgeas-R) | 5.6 | AD34 (Fong-R) | 6.5 |
| 6 | CD22 (Nunes-R) | 6.8 | SD05 (Galgiani-D) | 5.8 | AD21 (Gray-D) | 8.0 |
| 7 | CD23 (McCarthy-R) | 7.0 | SD16 (Grove-R) | 6.7 | AD31 (Arambula-D) | 8.5 |
| 8 | CD16 (Costa-D) | 8.3 | SD12 (M. Caballero-D) | 6.8 | AD26 (Mathis-R) | 8.9 |
| 9 | CD51 (Vargas-D) | 8.4 | SD40 (Hueso-D) | 7.1 | AD32 (Salas-D) | 9.5 |
| 10 | CD21 (Cox-D) | 9.1 | SD14 (Hurtado-D) | 10.0 | AD56 (Garcia-D) | 9.6 |
Employment Growth by Region
Containing 19.6% of the state’s population, the Bay Area has accounted for 42.8% of net employment growth compared to pre-recession levels. Los Angeles Region, with 29.1% of the population, accounted for only 15.7% of net employment gains, while Inland Empire continues to rank the second highest.
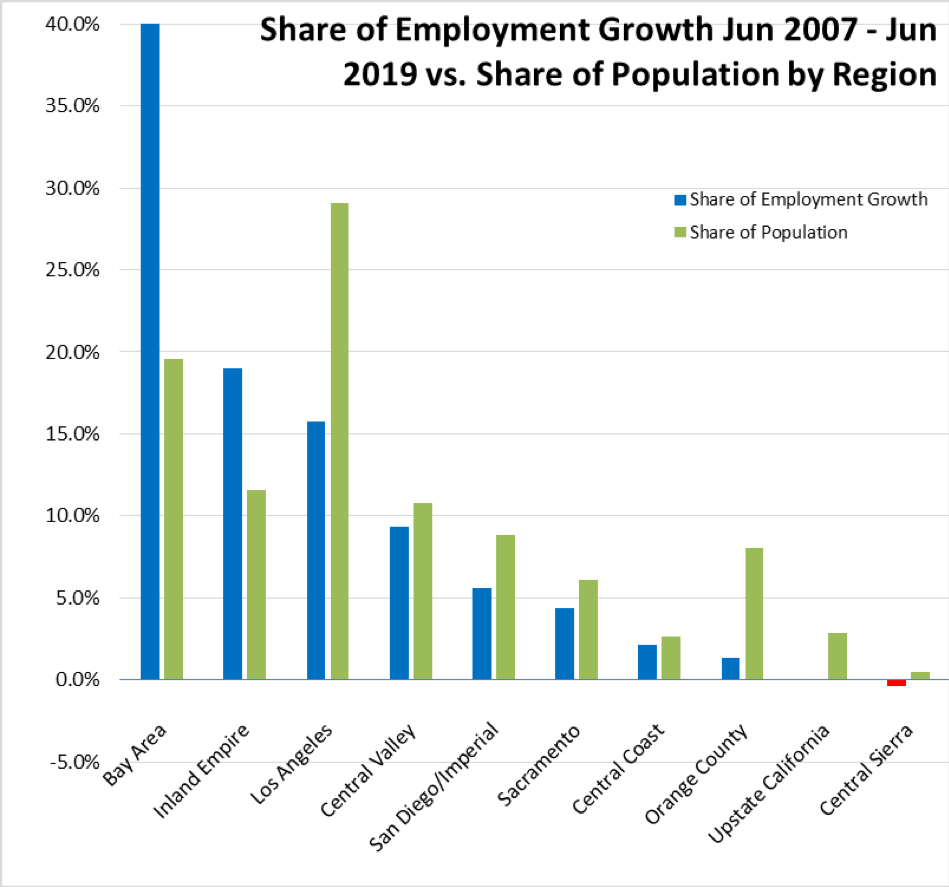
Figure Sources: California Employment Development Department; Department of Finance
MSAs with the Worst Unemployment Rates
Of the 20 Metropolitan Statistical Areas (MSAs) with the worst unemployment rates in May 2018, 9 are in California, El Centro MSA (Imperial County) with the second highest unemployment rate in the country and Visalia-Porterville MSA with the third worst.
| wdt_ID | MSA | Unemp. | Rank |
|---|---|---|---|
| 1 | El Centro, CA MSA | 16.4 | 388 |
| 2 | Visalia-Porterville, CA MSA | 8.1 | 387 |
| 3 | Merced, CA MSA | 7.3 | 386 |
| 4 | Bakersfield, CA MSA | 7.2 | 385 |
| 5 | Hanford-Corcoran, CA MSA | 6.7 | 383 |
| 6 | Fresno, CA MSA | 6.4 | 382 |
| 7 | Madera, CA MSA | 6.3 | 381 |
| 8 | Yuba City, CA MSA | 6.2 | 379 |
| 9 | Modesto, CA MSA | 5.6 | 376 |
Figure Source: US Bureau of Labor Statistics, May 2018 data
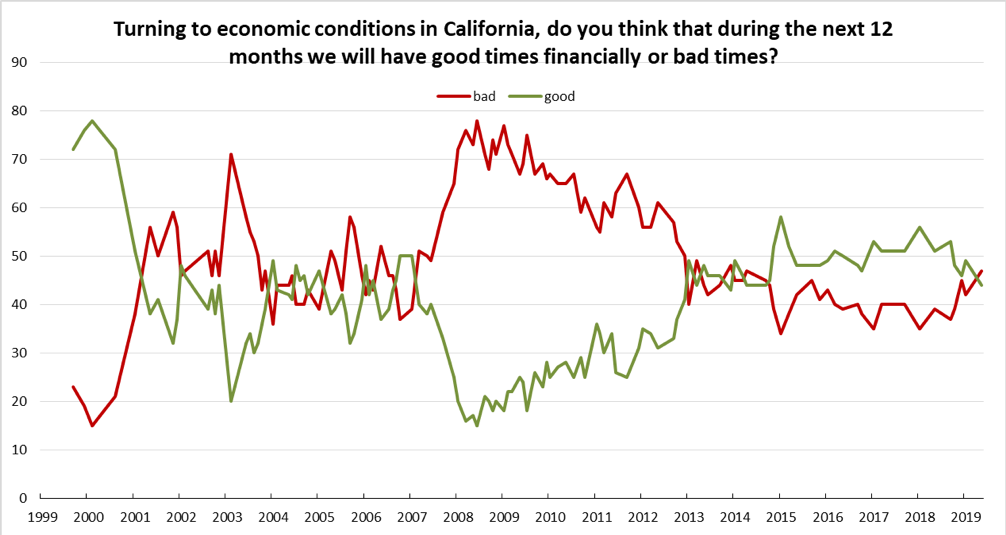
Chart of the Month: Economic Confidence
One of the more closely watched national economic indicators is the consumer confidence survey, looked to as a signal of changes related to the large consumption component of GDP and consequent changes in the business investment producing jobs growth.
This data is available only on the national level, but a comparable measure in the Center’s Indicators is from Public Policy Institute of California’s (PPIC) survey question asked periodically since September 1999: “do you think that during the next 12 months we will have good times financially or bad times?”
As indicated in the chart below, the “bad times” viewpoint has prevailed during much of the period it was asked, coincident with the ups and downs in the state’s economy beginning with the Dot.Com Bust at the beginning of the century. “Good times” pulled out ahead, however, three years into the recent recovery and held this position for the next four years.
Source: PPIC Statewide Survey, Responses from All Adults
The most recent numbers have again begun to converge and cross, much as they did in the uncertain period leading up to the Great Recession.
The reasons for this convergence are not readily clear. As a tracking question, PPIC does not go into much detail on why, and only reports on how people are feeling about their economic future.
One reason may be that the two responses did not diverge that much to begin with. The recent recovery historically was one of the slowest on record, and in California in particular was a two-tier recovery of jobs primarily at the highest and lowest ends of the wage scale. The continuing small spread in the numbers may reflect the results as to whether the recovery since 2012 has been personally good or only somewhat good.
Another reason may be in how people now define good vs. bad times. Historically, the numbers appear to be more closely tied with personal assessments of employment and income prospects. A growing concern among the California public, however, is that no matter how much their income rises, the costs of living continue to rise even faster. In the most recent May 2019 PPIC poll, 52% of adults indicated that the cost of housing is a financial strain. In the July 2019 Quinnipiac University Poll, 45% indicated they feel like they cannot afford to live in California.