Highlights for policy makers:
- COVID-19 and the State Economy
- Unemployment Rate Improves; Employment Up 653,300
- Labor Force Participation Rate Up at 60.7%
- Employment Growth Ranking
- Nonfarm Jobs Up 558.2k
- Jobs Change by Industry
- Unemployment Rates by Region (not seasonally adjusted)
- Unemployment Rates by Legislative District (not seasonally adjusted)
- How Far Back Has the Economy in Each County Been Pushed?
- Employment Share by Region
- MSAs with the Worst Unemployment Rates Now Includes Los Angeles
COVID-19 and the State Economy
Recession Tracking. As a base indicator tool to summarize these changes as they occur, the following chart contains the most recent employment estimates by industry along with the 12-month change taken from the revised data for the same month in the prior year. Because the depth of the current changes overwhelms any seasonal factors, the data used is the unadjusted numbers to show actual job levels held by Californians and to enable use of the average wage and hours worked numbers where available from this series. Within this chart, note that “employment” is the number of persons age 16 and over working, including wage & salary jobs, self-employment, and non-paid family workers in the civilian workforce. “Jobs” are the number of wage & salary jobs, with individual workers holding one or more of these jobs.
As indicated below, job numbers were below the 2019 levels in all but 2 industries, with the greatest contraction in lower wage Leisure & Hospitality where jobs were cut by about a third during what is typically the highest activity period for this industry.
Where the information is available, average hourly earnings rose in all industries. These numbers do not necessarily represent wage growth but instead likely reflect the fact that layoffs have generally affected lower wage workers more heavily. The averages went up because the lower wages were cut more proportionally. These jobs are more likely to require customer contact or a physical presence at a work location, and even where telework is possible, the high litigation risks under California’s labor laws make this work option less likely. Higher wage jobs have been more amenable to retention through telework and other work options, both from the standpoint of work characteristics and the state’s regulations.
Average weekly hours were down pretty much across the board, indicating that even where workers were being brought back, the proportion of part-time work was high due to the tentative nature of the reopenings.
Source: US Bureau of Labor Statistics
June Numbers in Perspective. While still nowhere near full recovery levels, the June job and labor force numbers overall show a substantial uptick from the prior months. Rather than a cause of celebration, they instead represent a cautionary tale for the long recovery period that still lies ahead.
The June numbers as with all these reports are based on surveys done during the week of the 12th in each month. Consequently, the June results cover about a month’s worth of reopenings that took place prior to the recently ordered reclosings.
The five weeks of reopening captured in the June numbers restored only 20% of the employment and 24% of the jobs lost through May. The job losses beginning in March were sharp, deep, and immediate. The June numbers instead suggest that recovery, once it finally does take hold, will be cautious and—as the events of early July show—fragile. These numbers also show California remains well behind the rest of the nation economically—the June numbers show the US as a whole regaining 35% of lost employment and 39% of lost jobs.
A part of this outcome is to be expected. Jobs and employment will expand as household incomes, consumer confidence, and sales return to their prior levels. This process will take time and is reflected in most of the projections now anticipating a “swoosh” or similar pattern in the forthcoming recovery.
But the longer the closings, the more the structural damage restricting the ability of the state’s economy to recover. Analysis of previous natural disasters indicate businesses especially small businesses can be enormously resilient. But as the closings extend—and more critically as they are turned off and on—the financial status of more employers will be undermined. Nationwide, a recent survey estimates that through the first part of May, more than 100,000 small businesses closed due to COVID-19. Others will close as a result of the current response actions accelerating trends that were already underway including an estimated 25,000 retail stores expected to close nationally this year, and 100,000 stores by 2025. Online sales were already undermining the traditional retail jobs structure. The responses to COVID are accelerating this trend.
Other potential effects may also limit the number of jobs that can return, in particular an accelerated turn to automation that likely will affect mid-educated females the hardest. Some industries already are turning to automation for worker safety purposes. Others will pursue this alternative to control operating costs and reduce litigation exposure in an uncertain environment.
Efforts are being taken nationally and in other states to increase the resiliency of the jobs market and the economy and expand the range of growth paths for recovery. California on the other hand continues to pursue actions that will increase the cost and litigation risks of bringing workers back to work with no counterbalancing actions to reduce the growing risk of long-term unemployment and its associated effects on wages and income equality.
As shown in the figure below, the recessionary trend has been toward longer recovery periods, and the more delayed a recovery is, the higher likelihood of more fundamental changes to the economic structure of the state and employability of the labor force as traditional industries contract and skills become dated. The 1990 recession was more severe in California, but an aggressive program of reforms managed to rebuild traditional blue collar jobs such as through a diversified manufacturing base—that restored these jobs save for the direct aerospace companies that moved out of the state—along with emerging industries such as high tech.
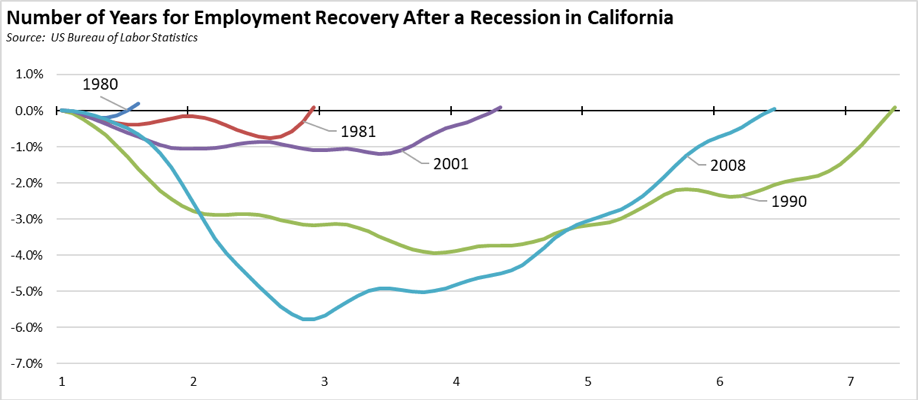
The last recession that began in 2008 instead substantially increased inequality in the state. The primary higher wage job creation was heavily concentrated in high tech and consequently in the Bay Area, and at least some of these jobs were filled by temporary workers (e.g., H1B and L visa holders) with less of a longer-term commitment to the state and the overall skills base because the public schools did not and still do not produce the necessary skills. For too many other workers, skills atrophied or became dated, market demand vanished especially with the gutting of traditional higher wage slots in manufacturing, construction, and extraction, long term unemployment set in, and many left the labor force altogether. The perennial promise of green jobs as heavily promoted as the solution under the Obama Administration and in California had marginal effects at best, producing primarily temporary construction or government-funded positions. This situation instead was finally turning around through the accelerated growth in the past three years. Workers were reentering the labor force, wages were rising, and opportunities expanding for key demographics that had up to that point seen only low if any wage and income growth. The key issue is now to get people back to work as quickly as possible. Workers need to stay connected with the labor force, remain engaged, and developing their skills as the economy changes, not retrained somehow after those changes have taken hold. The alternative is to see the wage levels their skills can command slowly eroding, just as in the prior recession.
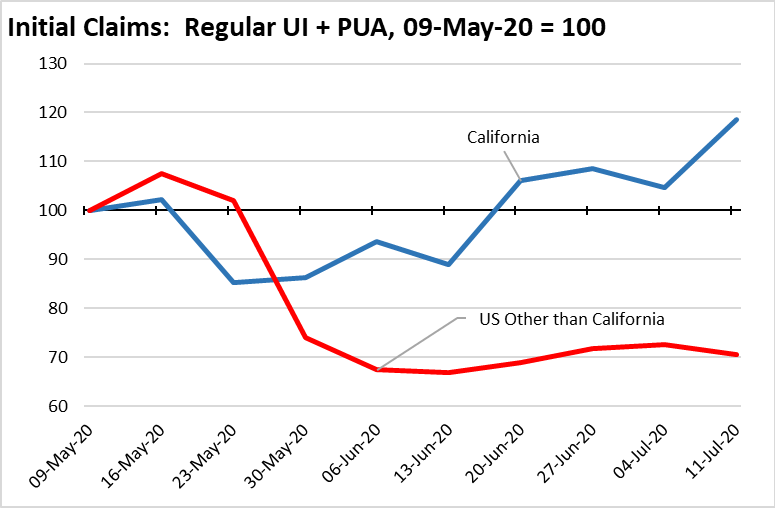
Unemployment Numbers After the Week of June 12th. As a more current economic indicator, initial claims for unemployment insurance show a weakening picture shortly after the June 12 surveys. As indicated in the chart below, total initial claims (regular program plus PUA by the self-employed) had roughly leveled out at about 90% of the level for the week of May 9 (the first week after the initial surge of PUA claims). Immediately after the June 12 surveys, initial claims began growing again and reached 19% above the May 9 level in the most recent data. Initial claims in the rest of the country, however, have remained largely stable. The data in the chart shows a deteriorating situation in California even prior to the recent orders for new closures coming into effect. The numbers will also be affected as more employers turn from temporary layoffs to restructuring decisions to cope with increasingly uncertain economic period. From this more current data, the relatively positive numbers are likely to be reversed in the reports for the coming months.
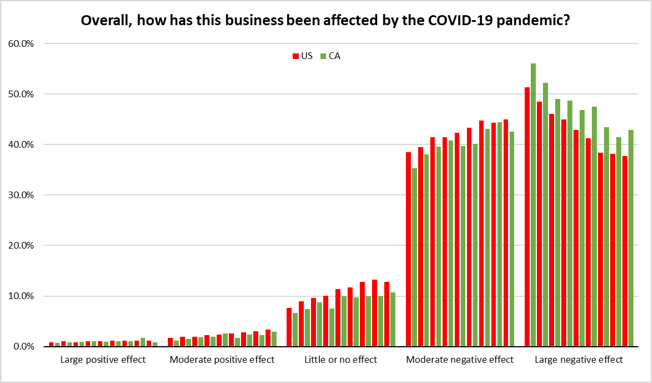
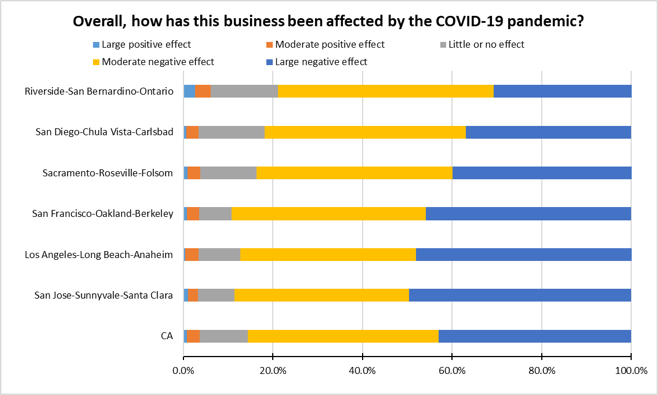
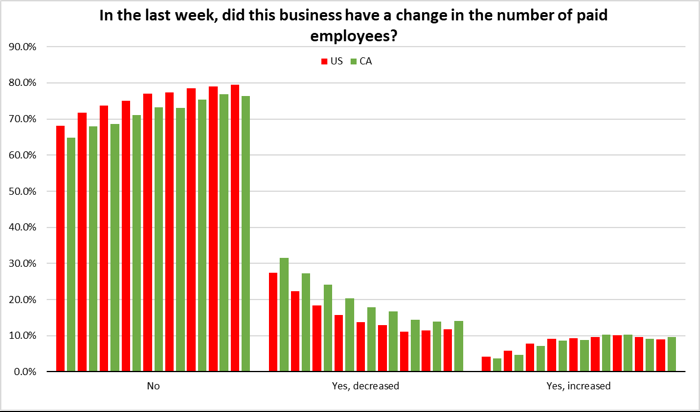
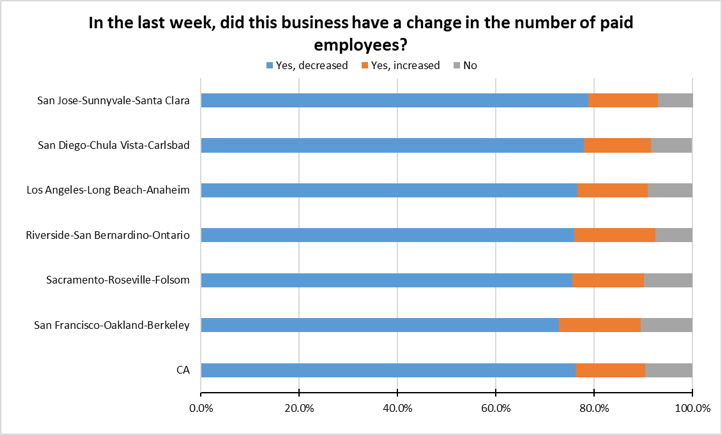
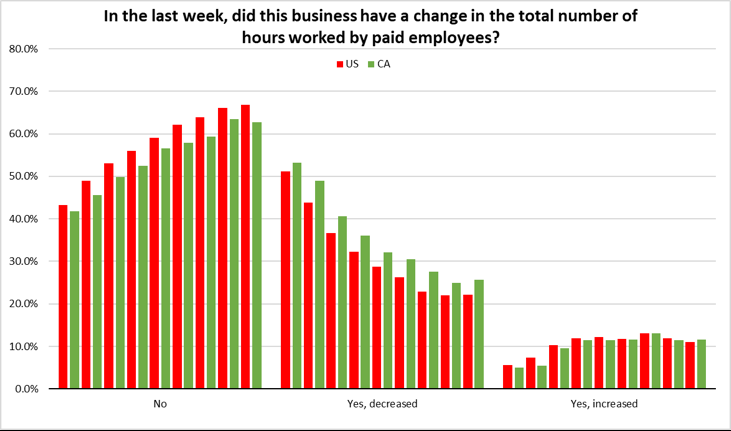
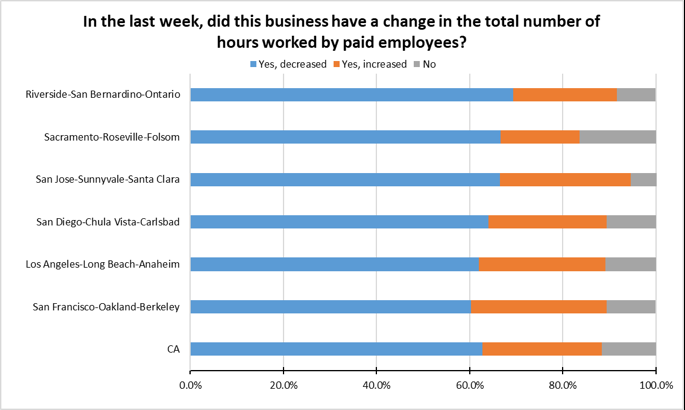
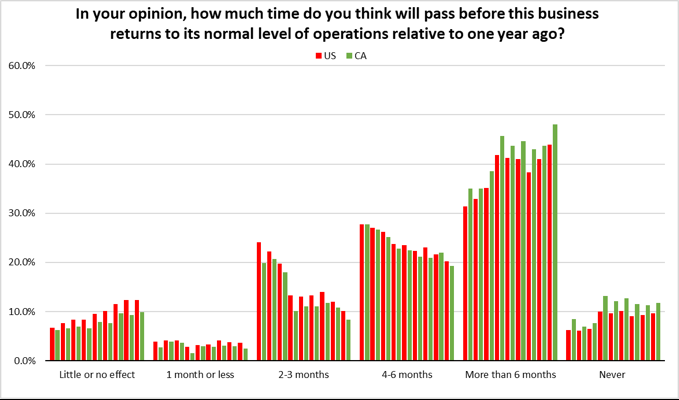
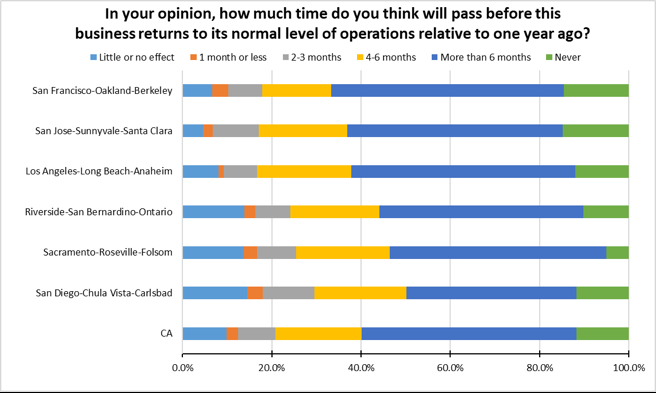
Other Current Indicators—Impacts on Small Businesses. As another current indicator of economic changes due to COVID-related measures, US Census Bureau has been conducting a series of weekly pulse surveys. The small business data covers nonfarm small businesses with 1-499 employees and weekly receipts of $1,000 or more. Data is available by state, the 50 largest MSAs, and by industry. The charts below summarize key survey responses to date, beginning with the first survey from the week of April 26 and continuing through the latest for the week of June 21, comparing California to the US average. Also included is a comparison of the six covered MSAs in California to the state average from the latest data for the week of June 21. Note that in all cases there is an element of self-selection involved where improving trends are indicated. Small businesses indicating the more extreme response in one week (e.g., laying off employees, minimal to no cash flow) have not necessarily been around to respond to surveys in subsequent weeks. As indicated in at least one analysis, an estimated 22% of small businesses nationally had closed as of mid-May.
Taken as a whole, the survey responses indicate that at least for small businesses, the economic disruption is not yet over. While in many cases at declining rates—but at generally higher rates in California than the US average— small businesses still are entrenching through location closures, layoffs, and hours cutbacks. More importantly, large percentages report low cash flow balances, and in the state, over half expect their businesses either to take 6 months or more to recover or they expect them never to recover. These businesses are planning investments and hiring accordingly, adding to the increasing probability the state will face yet another long and shallow recovery similar to the one following the 2008 downturn. A policy response that views the economy as something that can simply be switched back on fails to take into account the ongoing damage reflected in this data. The strength and speed of the recovery will once again depend greatly on the health and resiliency of small businesses and actions taken to accelerate their return to normal.
Overall Impacts. The share of small businesses indicating a “large negative effect” had been steadily declining, but with an uptick in the state results in the latest survey. The overall response remains at a high level, with 86% reporting moderate or large negative impacts. California small businesses continue to feel the effects more strongly, a possible result of the social distancing measures being introduced earlier, lasting longer, and being more widespread. Differences by MSA are less pronounced, but with Bay Area and Los Angeles firms reporting stronger negative effects.
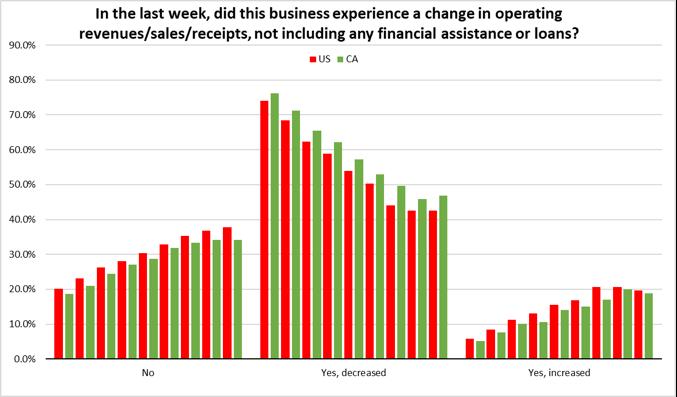
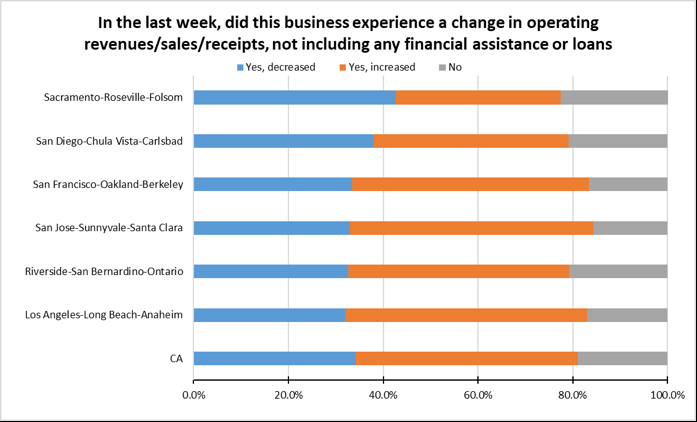
Revenues/Sales. Nearly half of small businesses continue to experience sales declines, although the percentage has eased from the beginning of the crisis. California remains above the US in decreased sales, but differences are less for the MSAs. Small businesses in Sacramento and San Diego are somewhat above the state average for sales drops, while the other MSAs are closer to the average.
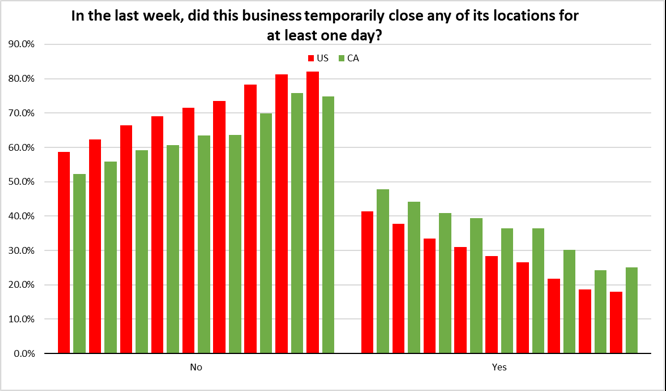
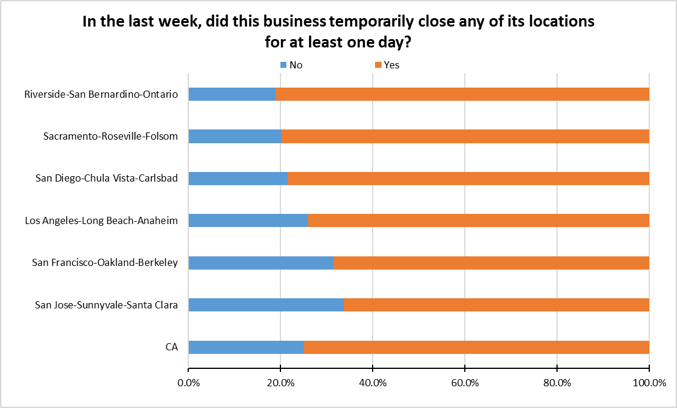
Closings. Closings continue within the state, although down from the beginning of the crisis. California remains higher than the US, with about a quarter of small businesses reporting closings. The number of small businesses continuing to report closing has shown a more gradual decline, with California again above the US. Small businesses in the Bay Area were more likely to report closings, while Inland Empire and Sacramento were below the state average.
Layoffs. Small businesses were still more likely to report closing a location rather than laying off more employees, but layoffs continue to be a component of their overall COVID response as reflected in the UI data. The rate of layoffs has declined by about half since the surveys began, but has leveled off in the past month. The rate of those hiring, however, has changed little in this period. Only small differences are in the MSA data.
Hours. But even for employees still at work, cutbacks in hours are reported by about a quarter of firms, with the percentage again higher in California and showing an uptick in the latest survey. Increased hours are also reported, but at a stable rate of around 10%. The share of firms reporting increased hours was higher in San Jose, but lower in Sacramento.
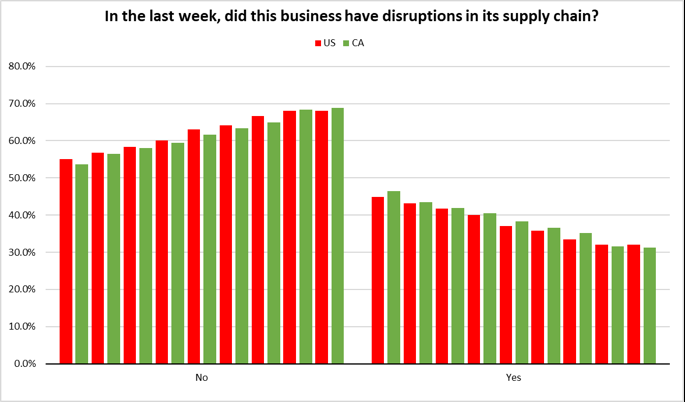
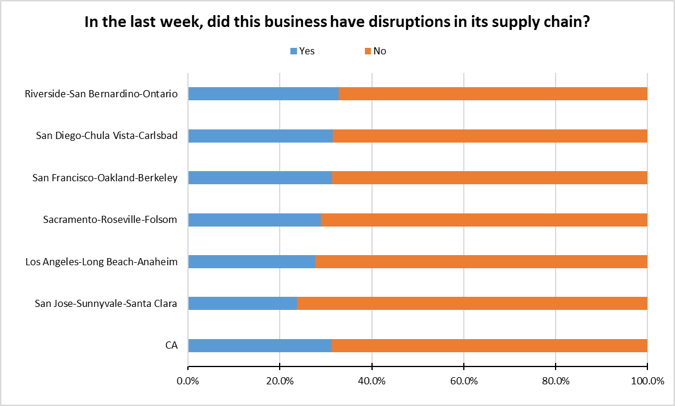
Supply Chains. Reported disruptions have eased only slightly in this period, with nearly a third of small businesses reporting disruptions. Differences between California and the US are far more narrow than in the other issues. Differences among the MSAs are also narrow but with tech-based San Jose reporting relatively fewer problems.
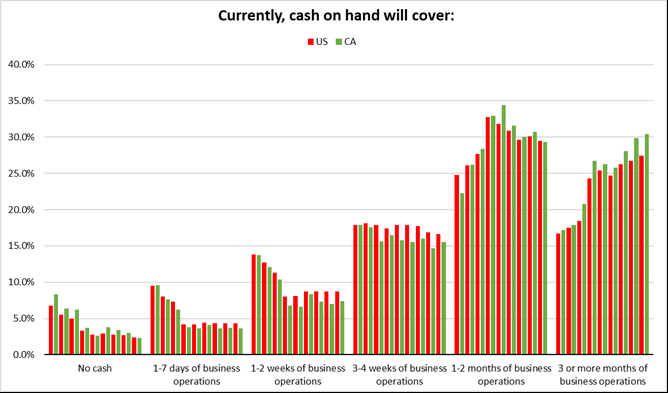
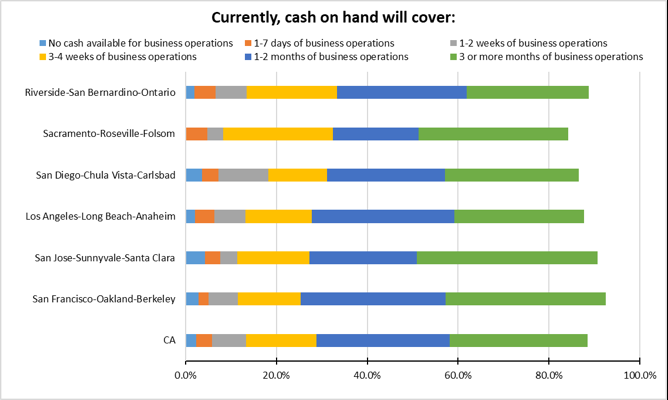
Cash on Hand. The reported financial health of small businesses has largely stabilized, but likely because firms reporting low cash balances in the early part of this period are no longer in business. Still, about a third of small businesses report having 4 weeks or less of cash on hand. The share reporting 3 months or more has increased faster in California, likely reflecting a difference in survival rate as much as a strengthening of small business finances. Among the MSAs, Inland Empire and Sacramento small businesses were more likely to have a month or less of cash.
Return to Normal. California small businesses are far more likely to be planning for an extended recovery period, with 60% expecting the return to normal to take more than 6 months or expecting that they will never get back to normal. This pessimistic outlook has been growing, and shows one of the strongest differences between the state and national responses among the survey questions. This same strong belief is also held regionally, with San Diego, Inland Empire, and Sacramento small businesses only slightly more optimistic.
Unemployment Rate Improves; Employment Up 653,300
EDD reported total employment (seasonally adjusted; June preliminary) rose 653,300 from the revised May numbers, while the number of unemployed dropped by 212,000. The reported unemployment rate improved 1.5 points to 14.9%. The unadjusted rate was off 11.0 points from the year earlier at 15.1%.
California had the 5th highest unemployment rate among the states.
Total US employment saw a seasonally adjusted gain of 4,940,000, with the number of unemployed dropping by 3,235,000. The reported unemployment rate dropped 2.2 points to 11.1%.
Figure Sources: California Employment Development Department; US Bureau of Labor Statistics
As in the prior months, the reported data does not capture the full unemployment picture. As indicated above, the UI data shows unemployment conditions accelerating just after the surveys for the labor force data were completed. Many workers continue to be unemployed but for various technical reasons are not counted in the official numbers. The surveys themselves continue to have technical issues, although recent changes appear to have reduced the scale of this problem:
- The response rate for the establishment survey used to estimate the job numbers was 63.1% in June, well below the 73.8% average for 2019 and the lowest to date in 2020. Response rates were particularly low for certain industries notably financial activities. Response rate for the household survey used for the labor force numbers was also the lowest at 64.9%, compared to the prior average of 82.5%. BLS indicates, however, the data still met its significance standards.
- Misclassification of the unemployed remains an issue, but at a much smaller level. Incorporating the up to 2.0 million workers in this category, the unadjusted unemployment rate would have been up to 12.4% instead of the reported 11.2%.
Labor Force Participation Rate Up at 60.7%
California’s seasonally adjusted labor force participation rate rose to 60.7%. Nationally, the participation rate rose to 61.5%.
For the 12 months ending June 2020, the seasonally adjusted data shows the California labor force was down 401,900 workers (-2.1% loss) compared to the rest of the US loss of 2,799,100 (-1.9%). The reported unemployment rates also have to be viewed in the context that large numbers of workers no longer are in the labor force.
Employment Growth Ranking
The total number of persons employed (seasonally adjusted) over the 12 months ending in June plunged by 2,451,900. California had the lowest level among the states in terms of absolute employment loss over the year.
Adjusted to account for differences in the size of each state economy, California over the year showed a 13.2% contraction, far deeper than for the rest of the US with a loss of 9.0%. Ranked among the states, California had the 4th worst loss rate.
Figure Source: US Bureau of Labor Statistics
Nonfarm Jobs Up 558.2k
Nonfarm jobs (seasonally adjusted) rose 558,200 as May’s seasonally adjusted gains were revised to 134,200 from the previously reported 141,600.
In spite of these gains, nonfarm jobs remained down 1,740,600 over the year. Adjusting for population size, California loss rate was 37th among the states, with a 12-month jobs loss rate of -10.0% compared to the rest of the US at -8.4%.
Figure Sources: California Employment Development
Department; US Bureau of Labor Statistics
The June numbers also show a continued convergence between the job and employment numbers. In recent years, the employment series had been diverging significantly from the number of nonfarm jobs for a number of reasons but including the increasing number of self-employed. Some of the convergence in recent months has been the result of workers with multiple jobs losing one but not all in the current situation, but the divergence began at a much higher point in California and has shrunk much more rapidly. Part of this difference is due to the destructive elements coming from last year’s AB 5, which eliminated many self-employment options at the same time the affected industries are being hit by the closure and related orders.
Jobs Change by Industry
In the unadjusted numbers that allow a more detailed look at industry shifts, all but 2 industries continued to post job losses over the 12-month period. Utilities as an essential service and Finance & Insurance with a high incidence of telework opportunities remained positive although largely unchanged.
Industries showing the greatest contractions were those generally requiring customer contact or a physical presence at a work location. These were led by lower wage Food Services, Retail Trade, Other Services, and Accommodation but also included the middle-class wage level Government, Arts, Entertainment & Recreation, and Administrative & Support & Waste Services.
| Not Seasonally Adjusted Payroll Jobs (1,000) | June 2020 | 12-month change | Nonfarm Growth Rank | % 12-month Change | Avg. Annual Wage |
|---|---|---|---|---|---|
| Total Farm | 375.8 | -112.4 | -23.0% | $35.5k | |
| Mining & Logging | 22.7 | -0.1 | 3 | -0.4% | $119.5k |
| Construction | 857.3 | -38.2 | 8 | -4.3% | $72.5k |
| Manufacturing | 1,220.0 | -107.2 | 15 | -8.1% | $97.1k |
| Wholesale Trade | 646.5 | -49.5 | 11 | -7.1% | $80.4k |
| Retail Trade | 1,443.6 | -190.6 | 19 | -11.7% | $37.7k |
| Utilities | 57.3 | 1.0 | 2 | 1.8% | $137.0k |
| Transportation & Warehousing | 609.6 | -25.4 | 7 | -4.0% | $62.0k |
| Information | 509.5 | -46.1 | 10 | -8.3% | $188.7k |
| Finance & Insurance | 543.0 | 6.0 | 1 | 1.1% | $133.0k |
| Real Estate & Rental & Leasing | 287.6 | -16.0 | 4 | -5.3% | $71.2k |
| Professional, Scientific & Technical Services | 1,284.6 | -43.3 | 9 | -3.3% | $126.8k |
| Management of Companies & Enterprises | 241.4 | -16.1 | 5 | -6.3% | $135.1k |
| Administrative & Support & Waste Services | 1,006.6 | -125.2 | 16 | -11.1% | $47.3k |
| Educational Services | 348.4 | -24.4 | 6 | -6.5% | $56.0k |
| Health Care | 1,516.5 | -58.3 | 13 | -2.4% | $69.6k |
| Social Assistance | 777.3 | -57.9 | 12 | -6.9% | $20.9k |
| Arts, Entertainment & Recreation | 210.2 | -132.3 | 17 | -38.6% | $60.0k |
| Accommodation | 142.0 | -99.8 | 14 | -41.3% | $39.7k |
| Food Services | 1,093.9 | -388.6 | 21 | -26.2% | $24.1k |
| Other Services | 446.9 | -133.2 | 18 | -23.0% | $41.9k |
| Government | 2,436.9 | -206.9 | 20 | -7.8% | $72.0k |
| Total Nonfarm | 15,701.8 | -1,752.1 | -10.0% | ||
| Total Wage & Salary | 16,077.6 | -1,864.5 | -10.4% | ||
Figure Source: California Employment Development Department;
Wages based on most recent Quarterly Census of Employment & Wages
Unemployment Rates by Region (not seasonally adjusted)
Regions with jobs providing greater telework options—both due to the nature of the jobs and under the state’s regulations—including the Bay Area, Orange County, and Sacramento saw somewhat lower unemployment rates. Regions with higher concentrations of blue collar and lower wage jobs including the Central Valley and Los Angeles had much higher rates.
| wdt_ID | Region | Unemployment Rates |
|---|---|---|
| 2 | California | 15.1 |
| 6 | Bay Area | 12.1 |
| 10 | Upstate California | 12.6 |
| 14 | Sacramento | 12.8 |
| 18 | Central Coast | 13.3 |
| 22 | Orange County | 13.7 |
| 26 | Central Sierra | 13.7 |
| 30 | Inland Empire | 14.3 |
| 34 | San Diego/Imperial | 14.5 |
| 38 | Central Valley | 15.8 |
| 39 | Los Angeles | 18.7 |
Figure Source: California Employment Development Department
Unemployment Rates by Legislative District (not seasonally adjusted)
Lowest
| wdt_ID | Congressional District | Unemployment Rate |
|---|---|---|
| 2 | CD18 (Eshoo-D) | 9.0 |
| 3 | CD17 (Khanna-D) | 10.4 |
| 4 | CD02 (Huffman-D) | 10.9 |
| 5 | CD15 (Swalwell-D) | 11.5 |
| 6 | CD52 (Peters-D) | 11.3 |
| 7 | CD49 (Levin-D) | 11.1 |
| 9 | CD24 (Carbajal-D) | 11.5 |
| 10 | CD12 (Pelosi-D) | 11.8 |
| 12 | CD01 (LaMalfa-R) | 12.0 |
| 13 | CD14 (Speier-D) | 12.1 |
| wdt_ID | Senate District | Unemployment Rate |
|---|---|---|
| 2 | SD13 (Hill-D) | 9.7 |
| 3 | SD15 (Beall-D) | 11.3 |
| 4 | SD01 (Dahle-R) | 11.4 |
| 5 | SD10 (Wieckowski-D) | 11.5 |
| 6 | SD02 (McGuire-D) | 11.5 |
| 7 | SD39 (Atkins-D) | 11.6 |
| 8 | SD36 (Bates-R) | 11.6 |
| 9 | SD03 (Dodd-D) | 12.0 |
| 10 | SD07 (Glazer-D) | 12.4 |
| 11 | SD19 (Jackson-D) | 12.5 |
| wdt_ID | Assembly District | Unemployment Rate |
|---|---|---|
| 2 | AD28 (Low-D) | 9.1 |
| 3 | AD16 (Bauer-Kahan-D) | 9.2 |
| 4 | AD22 (Mullin-D) | 10.0 |
| 5 | AD24 (Berman-D) | 9.6 |
| 6 | AD77 (Maienschein-R) | 11.3 |
| 7 | AD10 (Levine-D) | 10.8 |
| 8 | AD06 (Kiley-R) | 10.4 |
| 9 | AD25 (Chu-D) | 10.3 |
| 10 | AD78 (Gloria-D) | 10.9 |
| 11 | AD37 (Limón-D) | 11.3 |
Highest
| wdt_ID | Congressional District | Unemployment Rate |
|---|---|---|
| 2 | CD21 (Cox-D) | 18.8 |
| 3 | CD28 (Schiff-D) | 19.4 |
| 4 | CD32 (Napolitano-D) | 19.4 |
| 5 | CD43 (Waters-D) | 20.6 |
| 6 | CD29 (Cardenas-D) | 20.4 |
| 7 | CD37 (Bass-D) | 19.7 |
| 9 | CD34 (Gomez-D) | 20.9 |
| 10 | CD51 (Vargas-D) | 22.5 |
| 12 | CD40 (Roybal-Allard-D) | 22.6 |
| 13 | CD44 (Barragan-D) | 25.1 |
| wdt_ID | Senate District | Unemployment Rate |
|---|---|---|
| 2 | SD32 (Archuleta-D) | 16.9 |
| 3 | SD22 (Rubio-D) | 17.9 |
| 4 | SD21 (Wilk-R) | 19.9 |
| 5 | SD40 (Hueso-D) | 20.7 |
| 6 | SD18 (Hertzberg-D) | 20.4 |
| 7 | SD14 (Hurtado-D) | 20.1 |
| 9 | SD24 (Durazo-D) | 21.3 |
| 10 | SD33 (Gonzalez-D) | 21.9 |
| 12 | SD30 (Mitchell-D) | 21.9 |
| 13 | SD35 (Bradford-D) | 22.2 |
| wdt_ID | Assembly District | Unemployment Rate |
|---|---|---|
| 2 | AD48 (Rubio-D) | 19.9 |
| 3 | AD62 (Burke-D) | 20.1 |
| 4 | AD80 (Gonzalez-D) | 20.4 |
| 5 | AD36 (Lackey-R) | 22.4 |
| 6 | AD46 (Nazarian-D) | 22.3 |
| 7 | AD56 (Garcia-D) | 20.8 |
| 9 | AD63 (Rendon-D) | 23.5 |
| 10 | AD51 (Carrillo-D) | 23.9 |
| 12 | AD64 (Gipson-D) | 24.2 |
| 13 | AD59 (Jones-Sawyer-D) | 24.9 |
How Far Back Has the Economy in Each County Been Pushed?
As an indication of the severity of the current economic downturn, the following chart illustrates how much economic ground each county has lost using employment levels as the measure. Based on annual averages, the chart below indicates the last year each county saw the June employment numbers. Because the current series only goes back to 1990 for most counties, several of the entries indicate “Before 1990.” Los Angeles County is the exception, with data going back to 1976. The “Change” column indicates the change from April, the month reflecting the effects of the initial round of closures.
| wdt_ID | County | Last Year Employment Equal To or Less Than April | Last Year Employment Equal to or Less Than June | Change |
|---|---|---|---|---|
| 2 | Alameda County | 2009 | 2011 | 2 |
| 3 | Alpine County | 2009 | 2009 | 0 |
| 4 | Amador County | 1997 | 1998 | 1 |
| 5 | Butte County | 1998 | 1999 | 1 |
| 6 | Calaveras County | 2012 | 2013 | 1 |
| 7 | Colusa County | 1999 | 2004 | 5 |
| 8 | Contra Costa County | 1997 | 2010 | 13 |
| 9 | Del Norte County | 1992 | Before 1990 | < |
| 10 | El Dorado County | 1999 | 2000 | 1 |
| 11 | Fresno County | 2012 | 2013 | 1 |
| County | Last Year Employment Equal To or Less Than April | Last Year Employment Equal to or Less Than June | Change |
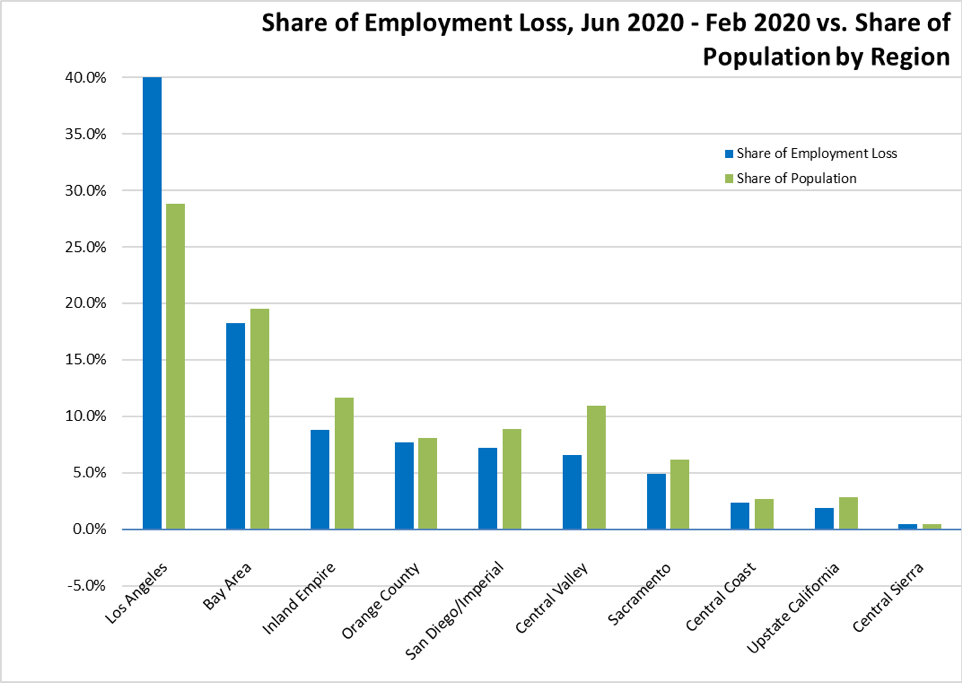
Employment Share by Region
The following chart compares change in employment (compared to pre-Covid February 2020) vs. population share as a measure of the disparate economic effects from the social distancing measures. Los Angeles Region, which experienced relatively greater job creation in lower income, population-serving and tourism industries during the recently ended recovery period, has to date sustained a commensurate far greater relative and absolute employment loss in the current economic downturn. Regions such as the Bay Area and San Diego with a greater incidence of jobs amenable to telework have been slightly less impacted. Regions such as the Central Valley and Inland Empire with a higher degree of essential businesses but also effects from seasonal factors have shown somewhat greater resiliency.
MSAs with the Worst Unemployment Rates Now Includes Los Angeles
As job losses have become more widespread, the number of California MSAs among the 20 regions with the worst unemployment rates in May rose to two: El Centro (Imperial County) with the 4th worst unemployment rate in the country at 27.8% and Los Angeles-Long Beach-Anaheim (Los Angeles and Orange Counties) tying with Lakeland-Winter Haven, FL MSA for the 20th worst unemployment rate at 19.1%.