Highlights for policy makers:
- COVID-19 and the State Economy
- Employment 1.146 Million Below Recovery
- Labor Force Participation Rate
- Nonfarm Jobs: 1.244 Million Below Recovery
- Jobs Change by Industry
- Employment Recovery by Region
- Unemployment Rates by Legislative Districts
- Unemployment Rates by Region
- MSAs with the Worst Unemployment Rates
COVID-19 and the State Economy
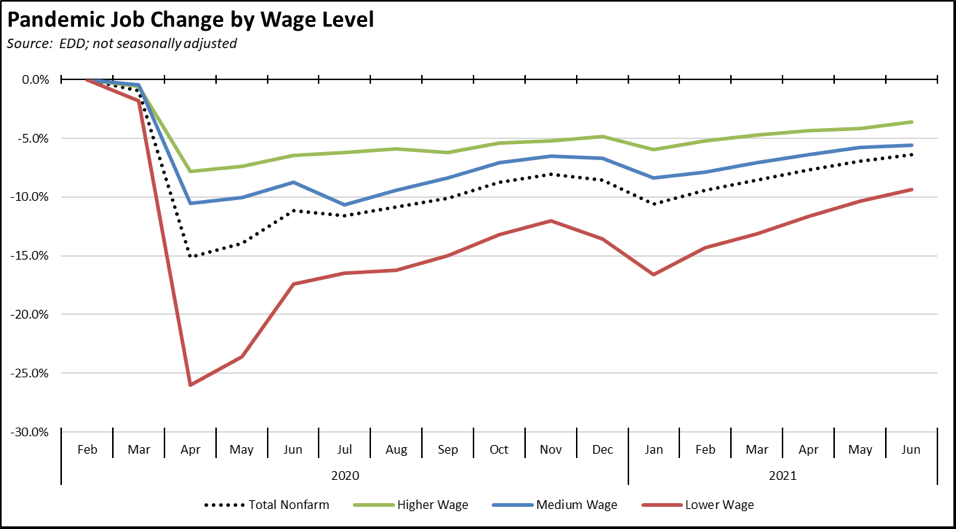
The June numbers are based on surveys conducted just prior to the state’s formal reopening on June 15, but reflect a period when most of the counties had been reclassified to the least-restrictive tier category.
By wage level, jobs growth was mixed. The lower-wage industries again experienced somewhat higher relative growth, but their overall recovery status remains the lowest. The higher-wage industries gained additional ground, but the middle-wage industry advance slowed substantially.
In the chart, higher-wage jobs are those industries with average annual wages above $100,000; medium-wage is $50,000 to $100,000; and lower-wage is below $50,000. Job data is drawn from the industry classifications, unadjusted job numbers, and wage levels generally used in the regular report section below on Nonfarm Jobs.
COVID-Period Transfer Payments and the State’s Economy
The pace of continued jobs growth, however, depends on worker availability. The rise in nonfarm jobs has slowed over the past three months. The labor force in June saw an increase of only 35,400 and remained below the February and March levels. The labor force participation rate was 60.8%, still well below the level of 62.5% in February 2020 and substantially below the 2007 average of 65.7% experienced just prior to the Great Recession. While a variety of factors likely are in play on this issue, including an apparent increase in early retirements, especially for workers age 55-64 without a college degree, the continuing high-level of public benefit payments has made it possible for many to act based on those other factors.
The most recent unemployment insurance claims data indicates the pace of new claims has remained largely level in California since the end of April, while showing a long trend decline since the end of March for the US as a whole. In last week’s data for the week of July 10, total initial claims grew 4.8% in California while dropping 2.2% in the other states.
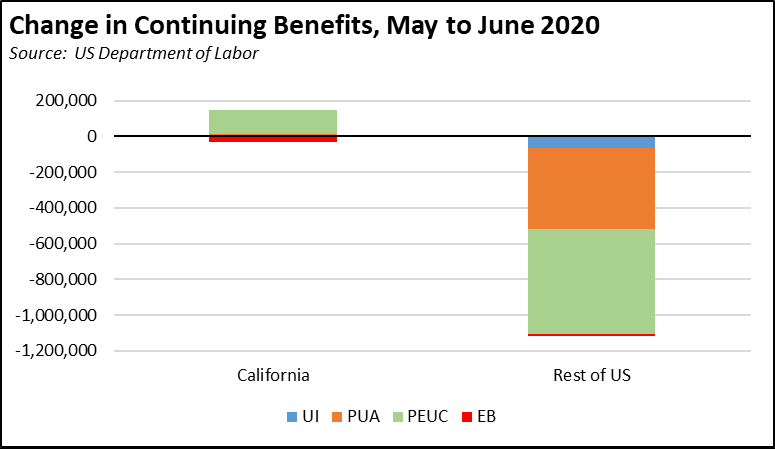
More importantly, the number of Californians continuing to rely on unemployment benefits—and consequently other assistance programs as well—far surpasses the other states. Using the continuing claims data from the weekly Department of Labor releases, California in the week of June 26 contained 22.0% of all persons receiving benefits under the four core programs (regular unemployment insurance (insured unemployment), pandemic unemployment assistance, pandemic emergency unemployment compensation, and extended benefits).
In fact, comparing the numbers between the end of May and end of June—the period when the tier restrictions were at their lowest and then removed on June 15—continuing claims rose in California by 117,500, while dropping 1,118,500 in the other states.
While California reinstated job search requirements as a condition for benefit eligibility, the California provisions cover a range of activities just short of actually applying for jobs as required in many other states. These requirements also depend on effective implementation from an agency that is still struggling with the overall pandemic workload, with a backlog that still exceeds 1 million and call center results showing it still takes applicants nearly 12 tries in order to reach the agency for questions on their applications and benefits.
The recently enacted budget amendments largely continue the approach of increasing payments and services to individuals to ameliorate the economic effects of the state’s pandemic restrictions rather than accelerating jobs recovery to expand income opportunities overall. The “golden state stimulus” being used to return the required tax receipts in excess of the Gann Limit to at least a portion of taxpayers minimizes the employment effect by remaining tied to earned income. While the budget also contains $1.5 billion in assistance to small business and various much smaller programs under GO-BIZ, these amounts are exceeded many times over by the increase in unemployment taxes that will result under the budget provisions—both the continued imposition of the state tax under its highest, F+ rate schedule and the increasing federal tax required to pay off the growing deficit in the state unemployment insurance fund that now appears to be headed towards $30 billion by the end of next year.
California’s job performance in prior years was in no small part the result of a growing population that through internal factors and migration, produced the number and range of skills to support jobs growth. In an era now of shrinking population, immigrants turning more to other states for the economic opportunities they came to the US to find, and reduced labor force participation, California still faces many headwinds to repeating that performance and moving from recovering to creating jobs.
CaliFormer Businesses: Update
Additional CaliFormer companies identified since our last monthly report are as follows. These companies include those that have announced: (1) moving their headquarters or full operations out of state, (2) moving business units out of state (generally back-office operations where the employees do not have to be in a more costly California location to do their jobs), (3) California companies that expanded out of state, and (4) companies turning to permanent telework options, leaving it to their employees to decide where to work and live.
| wdt_ID | Companies | From | To | Reason | Source | Year |
|---|---|---|---|---|---|---|
| 167 | 1Life Healthcare Inc. | San Francisco | Atlanta | Expansions | Read More | 2021 |
| 168 | Aatonomy | San Francisco | Houston | HQ move | Read More | 2018 |
| 169 | Abyss Creations | San Marcos | Las Vegas | HQ move | Read More | 2021 |
| 170 | Adlucent | Irvine | Austin | HQ move | Read More | 2019 |
| 171 | AFC Finishing Systems | Oroville | Idaho | HQ move | Read More | 2020 |
| 172 | AgencyKPI Inc. | Los Angeles | Austin | HQ move | Read More | 2020 |
| 173 | Aging 2.0 | San Francisco | Louisville | HQ move | Read More | 2020 |
| 174 | Airbrake Technologies | San Francisco | Austin | HQ move | Read More | 2020 |
| 175 | Alfresco Software Inc. | San Mateo | Massachusetts | HQ move | Read More | 2019 |
| 176 | Alpha Paw LLC | San Francisco | Austin | HQ move | Read More | 2021 |
| Companies | From | To | Reason | Source | Year |
| wdt_ID | High-Income Taxpayers | Company | To | Source |
|---|---|---|---|---|
| 5 | Helen Mirren/Taylor Hackford | Nevada | Read More |
Employment 1.146 Million Below Recovery
EDD reported that employment (seasonally adjusted; June preliminary) grew 24,500 from the revised May numbers as employment gains slowed from the prior two months, while the number of unemployed dropped 27,100. The unadjusted numbers show a drop of 42,500 after a strong showing in May (note: corrects the unadjusted employment number shown in our initial report from last Friday).
The reported unemployment rate was unchanged at 7.7% following a revision to the May numbers. California’s seasonally adjusted unemployment rate tied with Georgia’s and New York’s for the 4th highest among the states.
Total US employment dipped 18,000, while the number of unemployed rose 168,000. The reported unemployment rate edged up 0.1 point to 5.9%.
Figure Sources: California Employment Development Department; US Bureau of Labor Statistics
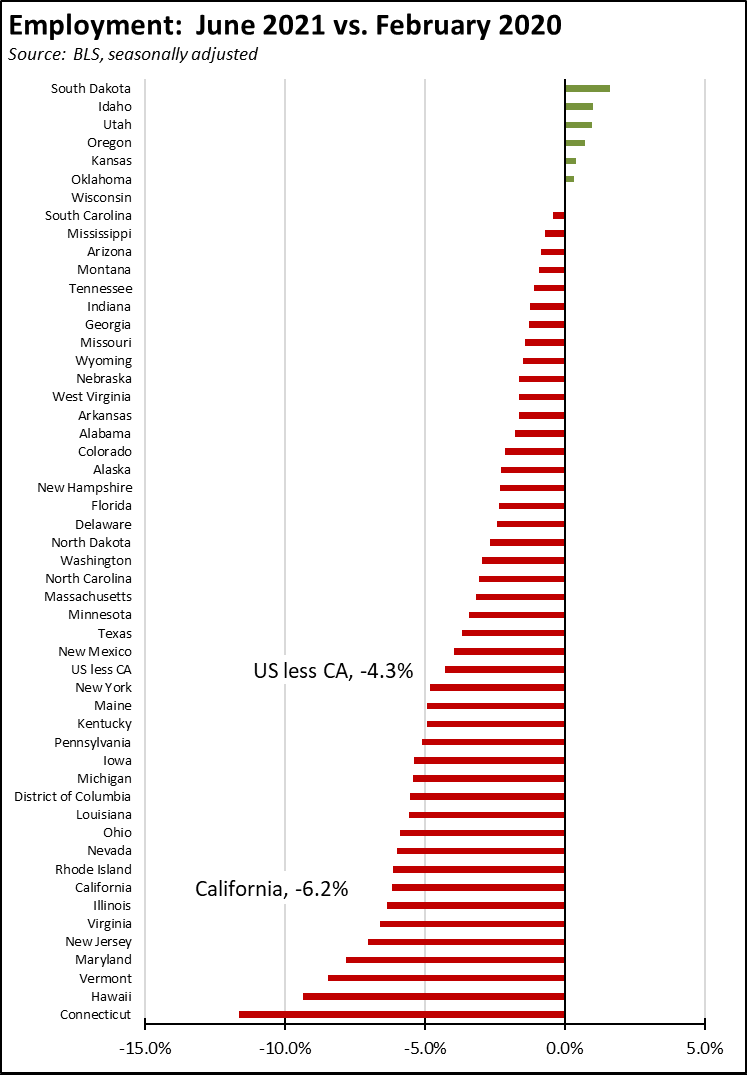
In the seasonally adjusted numbers, California employment remains 1.146 million (6.2%) below the pre-pandemic level in February 2020. Compared to the other states, California edged down to the 8th lowest-ranked by employment recovery level, while seven states were at or above the pre-pandemic February 2020 employment levels.
Labor Force Participation Rate
The labor force participation rate edged up 0.1 point to 60.8%, while the US number was unchanged at 61.6%. The rate remains well below the pre-pandemic level of 62.5%, which in turn was down substantially from prior years. Taking into account the participation rate, California cannot be said to have fully recovered even prior to the pandemic shutdowns. The additional workers leaving the labor force in pandemic period puts that goal further off. Accounting for workers leaving the workforce since February 2020, there were 2.0 million out of work in June.
Nonfarm Jobs: 1.244 Million Below Recovery
Nonfarm wage and salary jobs rose 73,500 (seasonally adjusted) in June, while gains in May were revised 9,800 lower. Nonfarm jobs nationally were up 850,000.
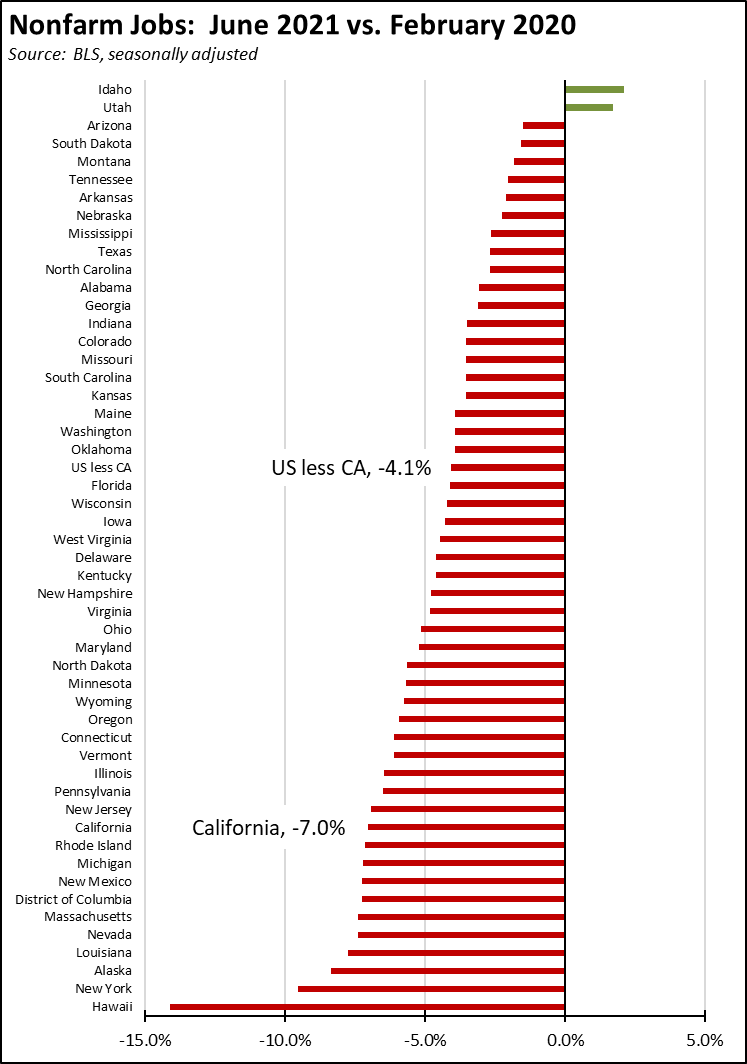
As job gains slowed from the prior three months, California notched down to 11th lowest based on jobs recovery. Compared to the February 2020 numbers (seasonally adjusted) just prior to the current crisis and not accounting for population changes, nonfarm wage and salary jobs in California were 1.244 million short of recovery, or 18.4% of the national shortfall.
In the seasonally adjusted numbers, two states—Utah and Idaho—exceed the pre-pandemic levels, moving from recovery to growth. In the more relevant unadjusted numbers, five additional states—Alaska, Maine, Montana, Nebraska, and South Dakota—have also reached this stage.
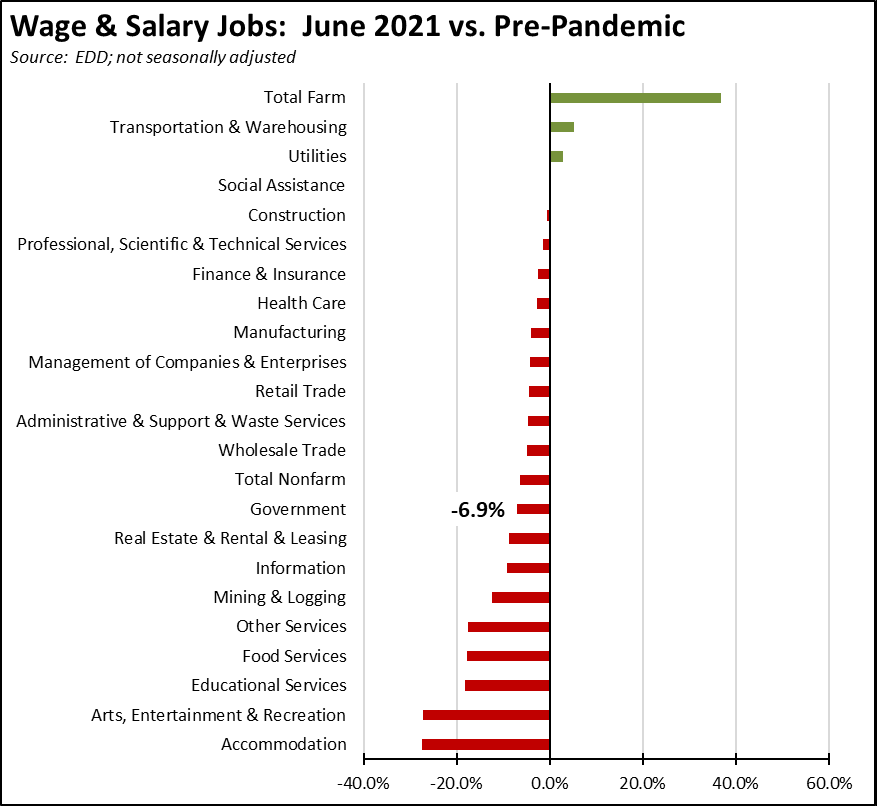
Jobs Change by Industry
Using the unadjusted numbers that allow a more detailed look at industry shifts, four industries showed job levels exceeding pre-pandemic February 2020 levels.
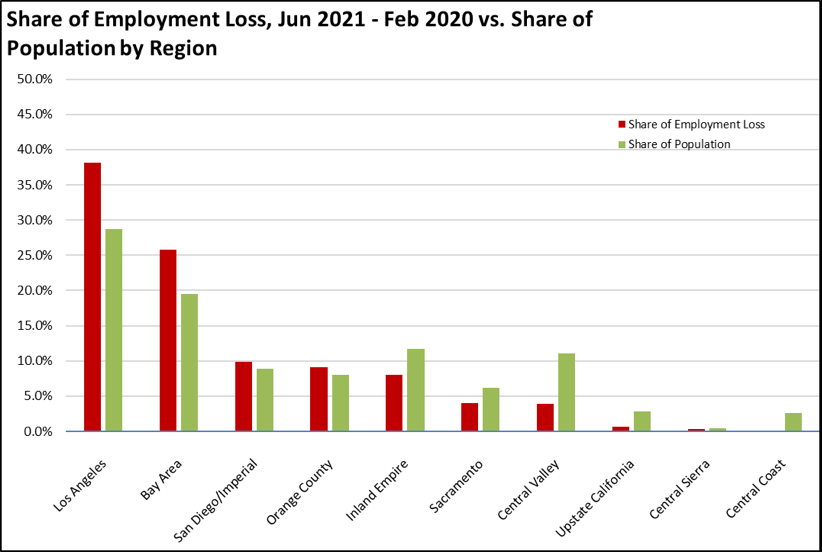
Employment Recovery by Region
All regions continued to show lower employment compared to pre-pandemic February 2020, with Los Angeles and Bay Area still showing the relatively highest losses.
Unemployment Rates by Legislative Districts
The highest and lowest estimated unemployment rates in June are shown below. The legislative district estimates have been updated to reflect both EDD’s revisions to the unemployment data and the most current factors from the American Community Survey.
Lowest
| wdt_ID | Congressional District | Unemployment Rate |
|---|---|---|
| 2 | CD18 (Eshoo-D) | 3.0 |
| 3 | CD17 (Khanna-D) | 3.7 |
| 4 | CD02 (Huffman-D) | 4.1 |
| 5 | CD52 (Peters-D) | 4.1 |
| 6 | CD12 (Pelosi-D) | 3.8 |
| 7 | CD14 (Speier-D) | 3.9 |
| 9 | CD15 (Swalwell-D) | 4.1 |
| 10 | CD19 (Lofgren-D) | 4.3 |
| 12 | CD49 (Levin-D) | 4.3 |
| 13 | CD45 (Porter-D) | 4.3 |
| wdt_ID | Senate District | Unemployment Rate |
|---|---|---|
| 2 | SD13 (Hill-D) | 3.3 |
| 3 | SD15 (Beall-D) | 3.8 |
| 4 | SD11 (Wiener-D) | 4.0 |
| 5 | SD10 (Wieckowski-D) | 4.1 |
| 6 | SD36 (Bates-R) | 4.2 |
| 7 | SD01 (Dahle-R) | 4.5 |
| 8 | SD39 (Atkins-D) | 4.3 |
| 9 | SD02 (McGuire-D) | 4.4 |
| 10 | SD37 (Moorlach-R) | 4.3 |
| 11 | SD17 (Monning-D) | 4.9 |
| wdt_ID | Assembly District | Unemployment Rate |
|---|---|---|
| 2 | AD28 (Low-D) | 3.0 |
| 3 | AD24 (Berman-D) | 3.3 |
| 4 | AD22 (Mullin-D) | 3.3 |
| 5 | AD16 (Bauer-Kahan-D) | 3.6 |
| 6 | AD73 (Brough-R) | 4.0 |
| 7 | AD10 (Levine-D) | 4.0 |
| 8 | AD06 (Kiley-R) | 3.9 |
| 9 | AD25 (Chu-D) | 3.8 |
| 10 | AD17 (Chiu-D) | 3.8 |
| 11 | AD78 (Gloria-D) | 4.1 |
Highest
| wdt_ID | Congressional District | Unemployment Rate |
|---|---|---|
| 2 | CD29 (Cardenas-D) | 7.8 |
| 3 | CD37 (Bass-D) | 7.9 |
| 4 | CD28 (Schiff-D) | 8.0 |
| 5 | CD34 (Gomez-D) | 8.7 |
| 6 | CD16 (Costa-D) | 8.9 |
| 7 | CD32 (Napolitano-D) | 7.9 |
| 9 | CD21 (Cox-D) | 9.5 |
| 10 | CD40 (Roybal-Allard-D) | 9.5 |
| 12 | CD51 (Vargas-D) | 10.6 |
| 13 | CD44 (Barragan-D) | 10.6 |
| wdt_ID | Senate District | Unemployment Rate |
|---|---|---|
| 2 | SD22 (Rubio-D) | 7.1 |
| 3 | SD12 (Caballero-D) | 7.4 |
| 4 | SD21 (Wilk-R) | 8.5 |
| 5 | SD35 (Bradford-D) | 8.8 |
| 6 | SD24 (Durazo-D) | 8.8 |
| 7 | SD18 (Hertzberg-D) | 7.9 |
| 9 | SD30 (Mitchell-D) | 9.0 |
| 10 | SD33 (Gonzalez-D) | 9.1 |
| 12 | SD40 (Hueso-D) | 9.4 |
| 13 | SD14 (Hurtado-D) | 10.4 |
| wdt_ID | Assembly District | Unemployment Rate |
|---|---|---|
| 2 | AD46 (Nazarian-D) | 8.8 |
| 3 | AD31 (Arambula-D) | 9.3 |
| 4 | AD36 (Lackey-R) | 9.2 |
| 5 | AD63 (Rendon-D) | 9.8 |
| 6 | AD32 (Salas-D) | 9.6 |
| 7 | AD26 (Mathis-R) | 9.0 |
| 9 | AD51 (Carrillo-D) | 9.9 |
| 10 | AD64 (Gipson-D) | 10.3 |
| 12 | AD59 (Jones-Sawyer-D) | 10.4 |
| 13 | AD56 (Garcia-D) | 11.3 |
Unemployment Rates by Region
Unemployment rates (not seasonally adjusted) compared to pre-pandemic February 2020 continue to show the Los Angeles region with the worst outcome in the state.
| wdt_ID | Region | June - 21 | Feb - 20 |
|---|---|---|---|
| 2 | California | 8.0 | 4.3 |
| 6 | Bay Area | 5.8 | 2.7 |
| 10 | Orange County | 6.4 | 7.0 |
| 14 | Sacramento | 6.8 | 4.5 |
| 18 | Central Sierra | 6.8 | 8.4 |
| 22 | San Diego/Imperial | 7.4 | 3.9 |
| 26 | Central Coast | 6.8 | 4.6 |
| 30 | Upstate California | 7.4 | 2.8 |
| 34 | Inland Empire | 7.9 | 3.7 |
| 38 | Central Valley | 9.8 | 3.8 |
| 39 | Los Angeles | 10.0 | 6.3 |
Figure Source: California Employment Development Department
MSAs with the Worst Unemployment Rates
California had 11 of the MSAs among the 25 regions with the worst unemployment rates in May.
| wdt_ID | MSA | May Unemployment Rate | US Rank out of 389 |
|---|---|---|---|
| 1 | El Centro MSA | 15.9 | 388 |
| 2 | Visalia-Porterville MSA | 10.2 | 386 |
| 3 | Bakersfield MSA | 10.1 | 384 |
| 4 | Merced MSA | 9.9 | 383 |
| 5 | Hanford-Corcoran MSA | 9.2 | 380 |
| 6 | Los Angeles-Long Beach-Anaheim MSA | 9.1 | 378 |
| 7 | Fresno MSA | 8.8 | 376 |
| 8 | Yuba City MSA | 8.5 | 373 |
| 9 | Madera MSA | 8.4 | 371 |
| 10 | Stockton-Lodi MSA | 8.3 | 370 |
| 11 | Modesto MSA | 8.0 | 365 |