Highlights for policy makers:
- COVID-19 and the State Economy
- CaliFormer Businesses: Update
- CaliFormers: Job Flows to Other States
- Nonfarm Jobs: 176k Below Pre-Covid Peak
- Job Change by Industry
- Job Openings Rise to 1.283 Million
- Employment 189k Below Pre-Covid Level
- Labor Force Participation Rate
- Unemployment Rates by Legislative Districts
- Unemployment Rates by Region
- Employment Recovery by Region
- MSAs with the Worst Unemployment Rates
COVID-19 and the State Economy
The numbers for June remained positive, again nearing but not yet reaching the pre-pandemic highs. Recovery progress, however, continued to slow, with employment gains weakening since March and nonfarm job gains weakening since February.
California employment was still 189,300 short of the pre-pandemic level in February 2020. In nonfarm jobs, California was still 175,900 below.
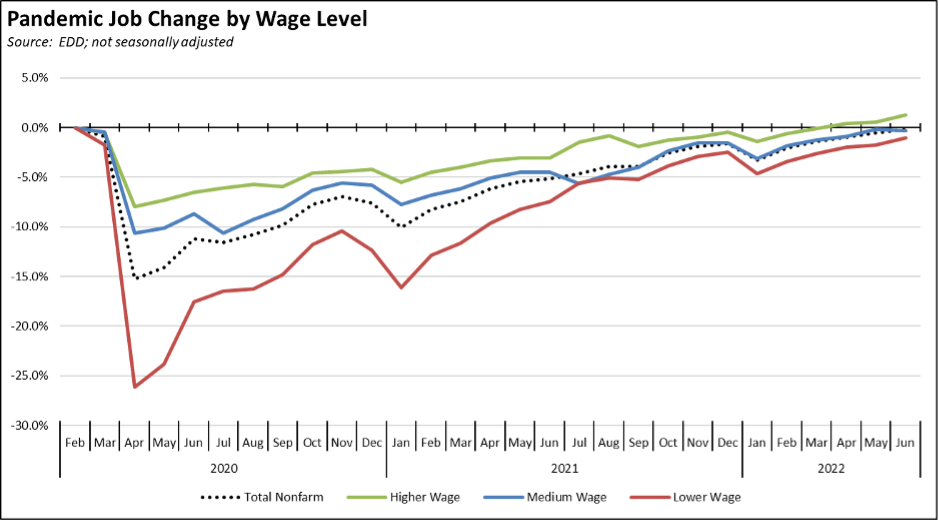
Using the unadjusted numbers to show results by average wage level, the higher wage industries remained in positive territory, while the medium wage industries dipped to 0.3% below. Lower wage industries continued improving with seasonal hiring, closing the gap to only a 1.0% shortfall.
CaliFormer Businesses: Update
Additional CaliFormer companies identified since our last monthly report are shown below. Companies listed below include those that have announced: (1) moving their headquarters or full operations out of state, (2) moving business units out of state (generally back office operations where the employees do not have to be in a more costly California location to do their jobs), (3) California companies that expanded out of state, and (4) companies turning to permanent telework options, leaving it to their employees to decide where to work and live. The list is not exhaustive but is drawn from a monthly search of sources in key cities.
Of particular note has been the recent series of announcements related to the reshoring of semiconductor facilities and the development of new electric vehicles and related battery plants. California was essentially the birthplace of both industries and has made jobs related to the second a high priority as a compensating benefit justifying the costs of its climate change policies and regulations. The rebuilding of the US semiconductor industry, however, has moved to Arizona, Texas, and Ohio, with the latest development being Samsung’s announcement that it is in discussions with Texas for a potential $200 billion investment covering 11 new production facilities. In essence, an entire industry is becoming a CaliFormer. And while California has adopted policies saying it should develop electric vehicle jobs, other states have instead enacted policy reforms that now see them cutting ribbons on the plants that will actually provide them.
The importance of these developments is not just limited to the marquee production plants. Over time, these become the core of a broader network within the supply chain, further expanding the availability of middle-class wage jobs within a state and region. In the case of the electric vehicle industry, these suppliers now include Redwood Materials’ $3.5 billion plant under construction near Reno, which will become one of the first US facilities to produce components for battery cells rather than the battery pack operations contained in other recent industry announcements.
As discussed in our quarterly reports on that industry, China both currently and in the expected future maintains a near-monopoly on the production of these battery cell materials. This supply situation has threatened to undermine the potential expansion of the electric vehicle industry outside that country. The Redwood Materials operations are the first significant US step to address this challenge, but it is being developed in Nevada. Another instance showing that while California believes it is leading on ideas and policy, the state’s high regulations, taxes, and costs mean the products to fulfill those policies continue to be built elsewhere along with the jobs to do it.
| wdt_ID | Companies | From | To | Reason | Source | Year |
|---|---|---|---|---|---|---|
| 168 | All Access | Torrance | Georgia | Expansion | Read More | 2022 |
| 169 | Chevron | San Ramon | San Ramon/Texas | Downsize HQ | Read More | 2022 |
| 170 | Anything Liquid Manufacturing | Carlsbad | Texas | HQ and manufacturing move | Read More | 2022 |
| 171 | Dreamliner Luxury Coaches | Palm Springs | Nashville | HQ move | Read More | 2022 |
| 172 | GAF Energy | San Jose | Texas | Manufacturing expansion | Read More | 2022 |
| 173 | Global Wafers | Taiwan | Texas | $5 billion wafer plant | Read More | 2022 |
| 174 | Learnfully | Redwood City | Denver | Expansion | Read More | 2022 |
| 175 | Matthews Real Estate Investment Services | El Segundo | Nashville | HQ move | Read More | 2022 |
| 176 | Mondee | San Mateo | Austin | HQ move | Read More | 2022 |
| 177 | Outer Aisle Gourmet | Santa Barbara | Texas | Manufacturing expansion | Read More | 2022 |
| 178 | Panasonic | Irvine | Kansas | $4 billion battery plant | Read More | 2022 |
| 179 | SpaceX | Hawthorne | Texas | Manufacturing expansion | Read More | 2022 |
| 180 | Title21 Health Solutions | Pleasanton | Phoenix | HQ move | Read More | 2022 |
| 181 | U.S. Merchants | Beverly Hills | Arizona | Manufacturing expansion | Read More | 2022 |
| 182 | Virgin Galactic | Mojave | Arizona | Manufacturing expansion | Read More | 2022 |
| Companies | From | To | Reason | Source | Year |
CaliFormers: Job Flows to Other States
While California remains 175,900 jobs short of recovery to the pre-pandemic level, the job openings data discussed later below indicates that there were over seven times as many unfilled job openings than what was needed to close this remaining gap. The challenge is not that employers are not creating jobs. The challenge is that they need workers to fill them and fill them on a broad range of wage levels.
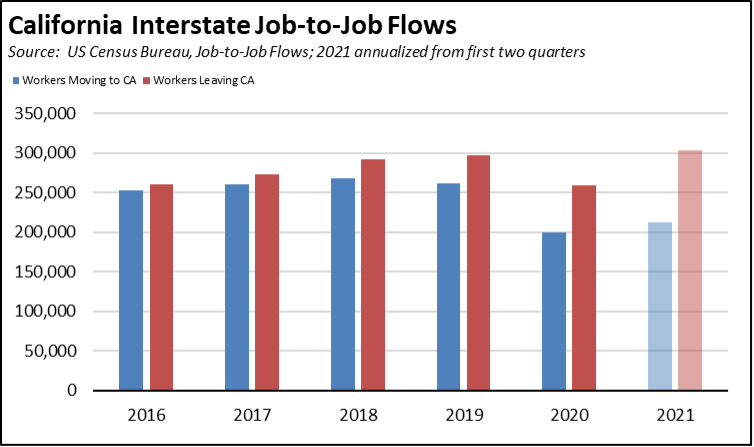
The recent release of the 2021 second quarter Job-to-Job Flow data suggests that California did have the workers, but that an increasing number are instead choosing to move and take jobs in other states.
As indicated in the chart below, the number of workers leaving California to change jobs was largely balanced by workers moving into the state prior to the pandemic. A difference with more moving elsewhere began to appear in 2019, with net out-migration rising even under the difficult circumstances during the pandemic period in 2020 and the first half of 2021. Note that in the chart, 2021 is annualized based on the results from the first two quarters, but continuing net migration at even this rate puts the net outflow of workers during the pandemic years at more than what is needed to close the remaining jobs gap.
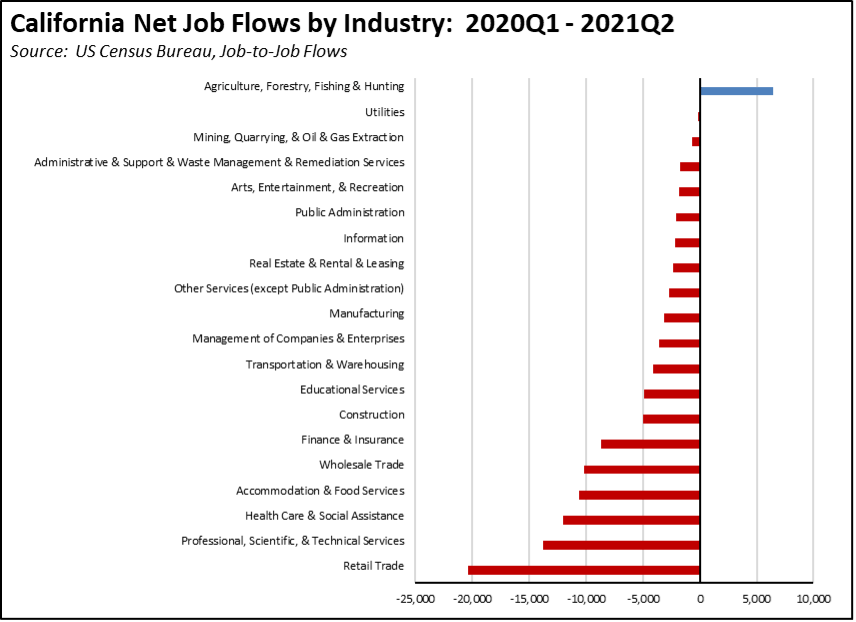
While stories about a “California Exodus” during the pandemic focused heavily on tech workers leaving the state, either through relocation or telecommuting, workers leaving a job in California and taking another in another state has been across a wide range of industries. The highest net outflows shown below occurred both within the tech sectors along with a mix of lower-wage and middle-wage industries. One of the industries with the highest net outmigration rates has been the Management of Companies & Enterprises, reflecting the continuing relocation of headquarters functions to other states. The diverse range of industries covered in the outmigration results suggests that high costs, in general, are causing people to leave the state, and not any circumstances specific to an individual industry.
In using this data, it is important to note that it only provides some additional information on migration such as what has occurred during the pandemic period, not a full accounting of the total into and out of the state. The numbers only incorporate workers with no or only a short (generally up to two months) period of unemployment between jobs, and only workers in covered wage and salary jobs. Not included are other classes of workers (especially self-employed), workers with a longer period of unemployment between jobs, students and others starting out in a job, workers moving to another state but continuing to telecommute to an employer in California, and related household members.
Nonfarm Jobs: 176k Below Pre-Covid Peak
California nonfarm wage and salary jobs were up 19,900 (seasonally adjusted) in June, while the gains in May were revised to 40,800 from the previously reported 42,900.
California showed the 7th highest monthly increase, behind Texas (82,500), Tennessee (32,300), Florida (30,600), New York (26,100), North Carolina (22,700), and Pennsylvania (21,200). California remains 175,900 below the prior peak or 33.6% of the remaining national shortfall.
Considered over the last year, the raw numbers show California doing better—a gain of 850,600 jobs that leads the other states, with second-place Texas at 778,700 and fourth-place Florida at 453,600. But this comparison is fully misleading as the previous restrictions on closing jobs in California were not lifted until the middle of June. Ordering jobs closed and then allowing them to reopen may produce large numbers in the data, but the outcome only reflects the removal of job barriers, not the results of job growth. Both Texas and Florida grew beyond their pre-pandemic peaks last Fall. California still has a way to go before reaching this milestone.
Looking at more meaningful comparison periods, California’s job performance came in second but nearly matched the results in Texas when looking at the past 6 months. Considering performance over the past quarter, California came in third. These comparisons, however, only look at the raw numbers. Texas by size of population and its economy is about 75% as large as California. Florida is just over half as large. California’s performance should not just be coming close to these other states, it should be surpassing to reflect its greater size.
But the issue should not be about bragging rights, whether this or that state is doing better than the others. The issue is that California’s Covid strategies—whatever other effects they may have had—resulted in serious harm to the economy, both to current jobs, especially lower wage jobs, and to future prospects to the economy through effects on educational progress and on long-term wage prospects for the workers who lost their jobs. Rather than a quick economic rebound, the state is taking far longer to recover than other regions in no small part because California also spent the pandemic period raising the cost of living and cost of doing business through an unceasing flow of regulations, restrictions, and additional fees and taxes. Other states instead chose to prioritize reopening their jobs and rebuilding their household income base.
Job Change by Industry
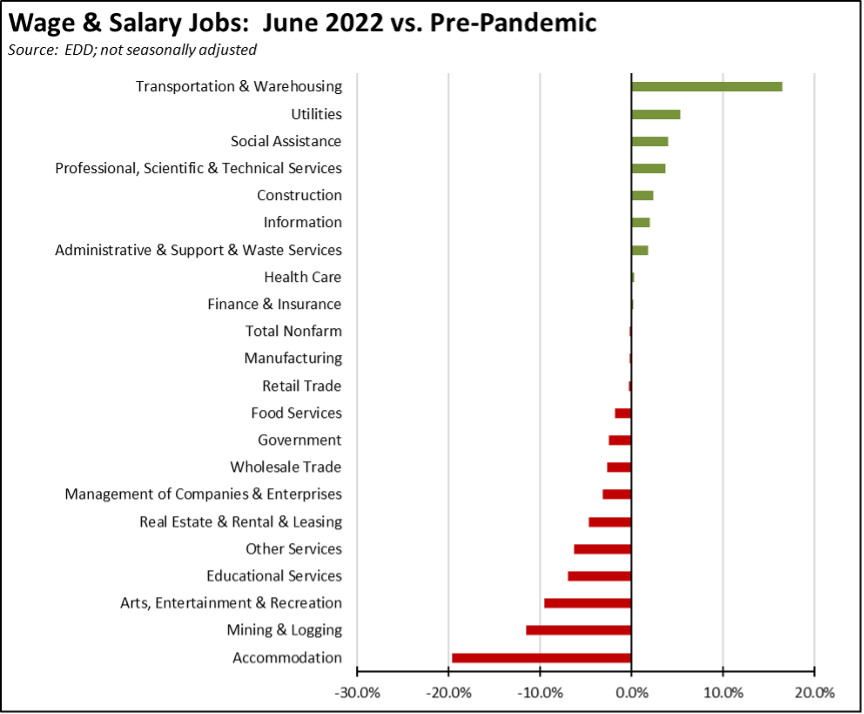
Using the unadjusted numbers that allow a more detailed look at industry shifts, the number of industries showed job levels at or exceeding the pre-pandemic February 2020 levels notched up to 9, with both Finance & Insurance and Health Care showing nominal gains. Transportation & Warehousing again showed the strongest growth by a large margin, with job growth greater than the next 4 industries combined. The rank and scale of remaining losses in the lagging industries showed little change.
Job Openings Rise to 1.283 Million
Unfilled job openings at the end of May rose 32,000 to 1.283 million, essentially maintaining the peak level of this indicator with little change over a period of 4 months. The severity of the labor shortage continued to worsen as the ratio of unemployed to job openings continued its decline from 0.7 in April to 0.6 in May.
Employment 189k Below Pre-Covid Level
EDD reported that employment (seasonally adjusted; June preliminary) was up 75,000 from the revised May numbers. The number of unemployed dipped 9,900.
The reported unemployment rate improved 0.1 point to 4.2%, compared to the revised 4.1% in February 2020 prior to the pandemic. California had the 11th highest unemployment rate among the states and contained 13.9% of the total number of unemployed workers in the US.
In the national numbers, total US employment was down 315,000, and the number of unemployed was down 38,000. The reported unemployment rate was unchanged at 3.6% for the fourth month in a row, compared to the 3.5% rate recorded in February 2020.
Figure Sources: California Employment Development Department; US Bureau of Labor Statistics
In the seasonally adjusted numbers, California employment remains 175,900 (1.0%) below the pre-pandemic level in February 2020; the US as a whole was 0.5% below.
Labor Force Participation Rate
The labor force participation rate rose 0.2 point to 62.5%, exceeding the US number at 62.2%. The California rate still remains below the pre-pandemic level of 62.8%, which in turn was down substantially from prior years. Accounting for workers leaving the workforce since February 2020, there were an estimated 0.9 million out of work in June.
Unemployment Rates by Legislative Districts
The highest and lowest estimated unemployment rates in June are shown below. The estimates are for the current, 2012 vintage districts. Estimates for the new districts under the 2022 redistricting will be released after the required factors from the American Community Survey become available at the end of the year.
Lowest
Highest
Unemployment Rates by Region
Unemployment rates (not seasonally adjusted) compared to pre-pandemic February 2020 are shown below.
Figure Source: California Employment Development Department
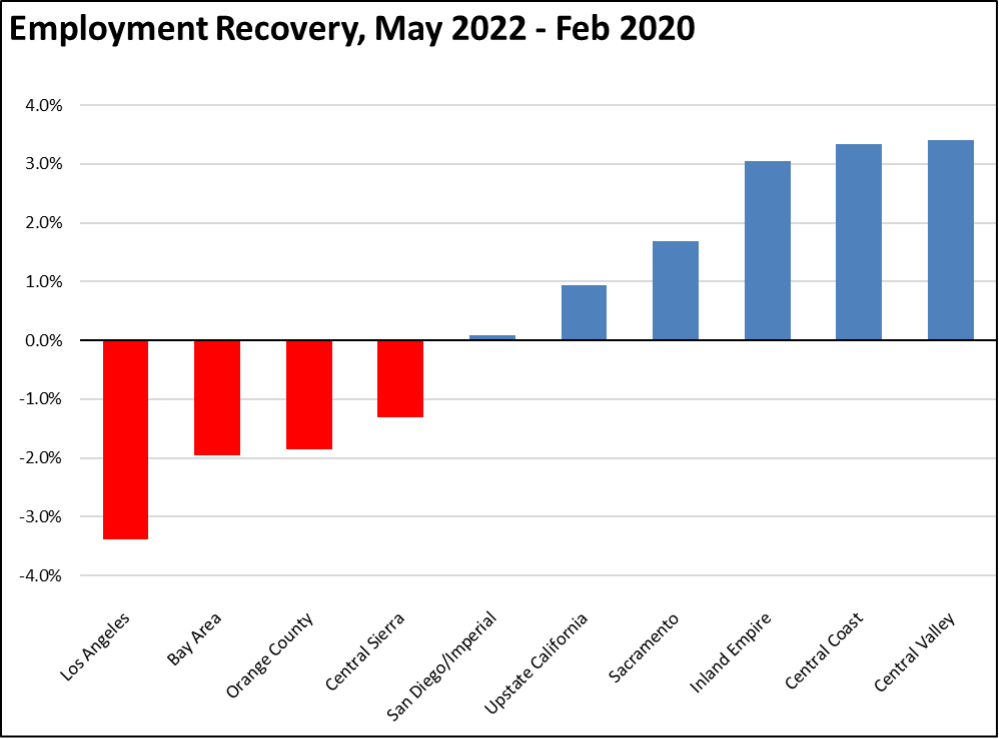
Employment Recovery by Region
With San Diego/Imperial moving back to negative, Los Angeles Region continues to lag the rest of the state in recovery to the pre-pandemic peak employment levels.
MSAs with the Worst Unemployment Rates
California went from 9 to 6 of the MSAs among the 25 regions with the worst unemployment rates in May, including El Centro MSA (Imperial County) with the second worst unemployment rate in the nation. Los Angeles-Long Beach-Anaheim MSA remained out of this group but rose to #289 in a tie with 7 other MSAs in other states. The best performing California urban region was again San Jose-Sunnyvale-Santa Clara MSA, edging up to a tie with 5 other MSAs at #14, with an unemployment rate of 1.9% compared to the best-performing regions, Mankato-North Mankato, MN and Rochester, MN MSAs at 1.3%.