Highlights for policy makers:
- Unemployment Rate Declines to 6.5%; Total Employment Climbs 45,300
- Labor Force Participation Rate Drops to 62.3%, Matching Previous Low in 1976
- Nonfarm Jobs Increase 39,800
- 7 Industries Remain Below 2007 Pre-Recession Job Levels
- 16 Counties Remain in Double-Digit Unemployment, Down from 20 in February
- Two-Tier Economy Persists
Unemployment Rate Declines to 6.5%; Total Employment Climbs 45,300
The Labor Force data for March 2015 (seasonally adjusted; California preliminary) is shown below, along with the change from the prior month:
The related not seasonally adjusted numbers (California preliminary), with the change from March 2014:
California Employment Development Department’s (EDD) latest release shows on a seasonally adjusted basis, total employment grew by 45,300, while the number of unemployed dropped by 53,300. California’s seasonally adjusted unemployment rate declined from 6.7% in February to 6.5% in March. The unadjusted rate increased from 6.8% in February 2014 to 6.5% in March 2015.
By comparison, total US employment remained essentially level (seasonally adjusted increase of 34,000), while the number of unemployed decreased 1.5% (seasonally adjusted decrease of 130,000).
For both California and the US, improvement in the unemployment rate has come primarily as the unemployed have shifted to employed status or left the workforce. There has been little change in the overall labor force, and as discussed below, the labor force participation rate has again declined. While significantly improved over prior years, the current job creation rate has yet to be strong enough—except for some centers such as the Bay Area—to put upward pressure on wages and draw persons back into the workforce.
California’s seasonally adjusted unemployment rate remains 18% higher than the national rate. California’s ranking improved slightly to be the 8th highest unemployment rate among the states.
Between March 2014 and March 2015, Bureau of Labor Statistics (BLS) data shows the total number of employed in California increased by 457,279 (seasonally adjusted). This increase was the highest among the states, ahead of Texas (263,270) and Florida (208,927).
Adjusted for working population size, California had the 16th highest employment increase (15.0 additional employed per 1,000 Civilian Noninstitutional Population (Age 16+)), with Delaware (22.2 per 1,000 population), Massachusetts (21.6 per 1,000 population), and Arizona (21.5 per 1,000 population) in the leading slots.
Labor Force Participation Rate Drops to 62.3%, Matching Previous Low in 1976
The current data releases by both EDD and BLS reflect major revisions incorporating updated estimation methods along with application of the most recent population controls. Revisions to the labor force data in some cases extend back to 1990, including recalculation of the labor force participation rates.
The new data is shown below comparing California to the US. In general, the overall effect of the revisions was to increase the estimated labor force participation rate for California in years prior to 1992 (up to 2.2 percentage points), while revising the rate downwards in the years following (up to 1.0 percentage points lower since 2010).
Under the revised data, California’s participation rate (seasonally adjusted) has essentially remained level since September 2013, hovering between 62.4% and 62.3%, the previous low last experienced in 1976.
Nonfarm Jobs Increase 39,800
EDD reported that between February and March 2015, seasonally adjusted nonfarm payroll jobs increased by 39,800. February’s gains from January were revised downwards to 22,400.
Looking at the not seasonally adjusted numbers, the change in nonfarm payroll jobs from February 2015 saw the largest increases in Government (22,700), Construction (12,800), and Administrative & Support & Waste Services (11,600). Declines were felt in Real Estate & Rental & Leasing (-1,200), Finance & Insurance (-700), and Mining & Logging (-300).
By total number of new jobs, California had the highest increase in seasonally adjusted Nonfarm jobs from March 2014 to March 2015, at 481,900 or 16.5% of the US total. Texas had the second highest, with 327,500 Nonfarm jobs or 11.2% of the US total.
By percentage increase, California’s job growth rate of 3.1% over the year was the 6th highest, behind Utah (3.9%), Florida (3.7%), Washington (3.4%), Oregon (3.3%), and Idaho (3.2%). The US average was 2.1%.
Adjusting for population, California’s job creation rate of 15.0 new jobs per 1,000 Civilian Noninstitutional Population age 16 and over (the available labor force population base) still exceeded the US average of 11.7. Among the states, California’s population adjusted growth rate was 11th largest and just behind Texas at 16.1.
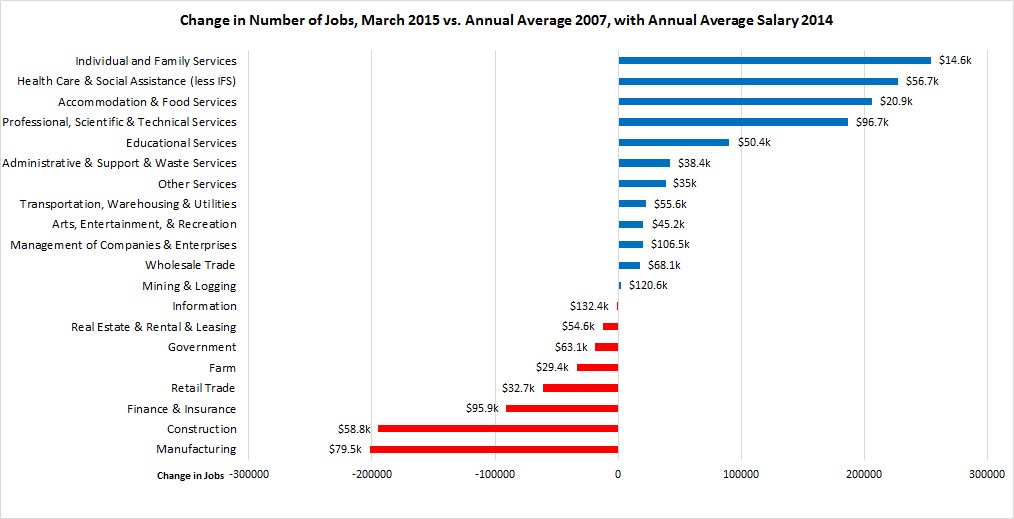
7 Industries Remain Below 2007 Pre-Recession Job Levels

Comparing the number of jobs by industry in March 2015 (not seasonally adjusted), 7 industries remain below the 2007 pre-recession levels and the remaining are above.
As indicated in the figure above, growth has been primarily in the lower wage and higher wage industries, with two of the top three growth industries paying well under $2,000 a month in average wages. The largest gaps remain in the middle class-wage industries of Manufacturing and Construction.
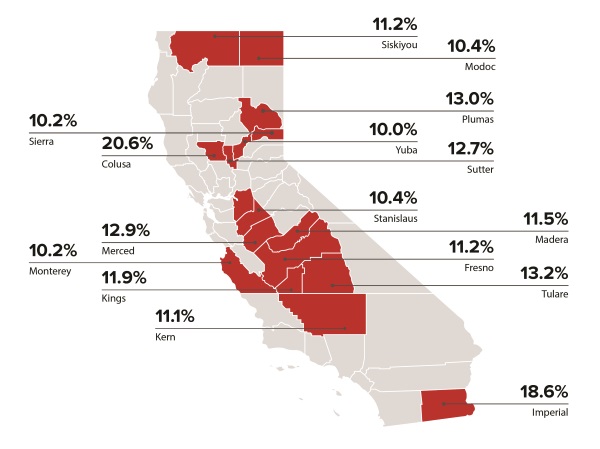
16 Counties Remain in Double-Digit Unemployment, Down from 20 in February
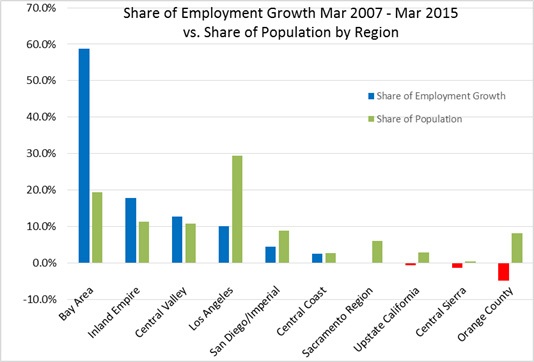
Two-Tier Economy Persists
Unemployment rates and employment (all data is not seasonally adjusted) continue to vary widely across the state.
The Bay Area continues to dominate employment growth since the recession; with 19% of the state’s population, this region contains 59% of the net employment growth since March 2015. Los Angeles with 29% of the population contains only 10% of the net employment growth. Inland Empire, however, has recently shown stronger employment growth relative to its size.
By County:
Ratio of Highest to Lowest Rate: 6.06
By Legislative District:
Ratio of Highest to Lowest Rate: Senate 4.44
Ratio of Highest to Lowest Rate: Assembly 4.27
Note: All data sources, methodologies, and historical data series available at CenterforJobs.org.