Highlights for policy makers:
- Unemployment Rate Eases to 5.4%; Total Employment Rises 46,300
- State Employment Growth Rankings
- Labor Force Participation Rate Unchanged at 62.0%
- Nonfarm Jobs Increase 4,200
- Seven Industries Below 2007 Pre-Recession Job Levels
- 12 Counties Remain in Double-Digit Unemployment; 16 are 5% or Less
- Two-Tier Economy Persists
- 8 California MSAs in the 10 Worst Unemployment Rates Nationally
All data used in this month’s report reflects the March 2015 benchmark revisions recently released by EDD and BLS, and labor force data for all geographic areas in the Center’s Data Tool and Indicators has been updated as well. These revisions affect previously reported data and related estimates beginning in 2010.
Unemployment Rate Eases to 5.4%; Total Employment Rises 46,300
The Labor Force data for March 2016 (seasonally adjusted; California preliminary) is shown below, along with the change from the prior month:
| Seasonally Adjusted | California | US | ||
|---|---|---|---|---|
| Mar 2016 | Change from Feb 2016 | Mar 2016 | Change from Feb 2016 | |
| Unemployment Rate | 5.4 | -0.1 | 5.0 | 0.1 |
| Labor Force | 19,058,100 | 0.1% | 158,286,000 | 0.2% |
| Participation Rate | 62.0 | 0.0 | 63.0 | 0.1 |
| Employment | 18,038,100 | 0.3% | 151,320,000 | 0.2% |
| Unemployment | 1,020,000 | -3.2% | 7,966,000 | 1.9% |
The related not seasonally adjusted numbers (California preliminary), with the change from March 2015:
| Not Seasonally Adjusted | California | US | ||
|---|---|---|---|---|
| Mar 2016 | Change from Mar 2015 | Mar 2016 | Change from Mar 2015 | |
| Unemployment Rate | 5.6 | -1.1 | 5.1 | -0.5 |
| Labor Force | 19,028,200 | 0.4% | 158,854,000 | 1.6% |
| Participation Rate | 61.9 | -0.4 | 62.8 | 0.3 |
| Employment | 17,971,100 | 1.6% | 150,738,000 | 2.1% |
| Unemployment | 1,057,100 | -16.6% | 8,116,000 | -6.5% |
California Employment Development Department’s (EDD) latest release shows on a seasonally adjusted basis, total employment grew by 46,300 from February, while the number of unemployed dropped by 34,000. California’s seasonally adjusted unemployment rate also notched down from 5.7% in February to 5.6% in March. The unadjusted rate decreased from 6.7% in March 2015 to 5.6% in March 2016.
Total US employment saw a seasonally adjusted increase of 246,000, while the number of unemployed increased by 151,000.
The US unemployment rate rose marginally to 5.0% primarily as a result of more workers being drawn into the labor force. On a seasonally adjusted basis, the 396,000 increase in the labor force in March was essentially the sum of the additional employed and unemployed. California’s improved unemployment rate, however, stems primarily from movement between the unemployed to employed. California’s labor force essentially remained the same, growing only 0.07%.
State Employment Growth Rankings
| Rank | Number of Employed | Percentage Change | Population Adjusted (employment growth per 1,000 civilian noninstitutional population) |
|---|---|---|---|
| 1 | CA 350,144 | OR 5.5% | OR 31.7 |
| 2 | FL 264,137 | TN 4.3% | DE 24.7 |
| 3 | TX 241,072 | AR 4.2% | TN 23.7 |
| 4 | NY 193,674 | DE 4.2% | AZ 23.1 |
| 5 | MI 157,420 | AZ 4.1% | AR 23.0 |
| 6 | NC 128,774 | MS 3.8% | CO 20.6 |
| 7 | TN 122,283 | MI 3.5% | MI 20.0 |
| 8 | AZ 121,156 | SC 3.3% | MS 19.7 |
| 9 | GA 114,341 | CO 3.2% | MO 18.8 |
| 10 | NJ 113,022 | HI 3.1% | HI 18.6 |
| 11 | IL 107,293 | MO 3.0% | DC 18.5 |
| 12 | PA 107,061 | FL 2.9% | SC 18.1 |
| 13 | OR 101,872 | NC 2.9% | IN 17.1 |
| 14 | MO 88,897 | DC 2.8% | NC 16.6 |
| 15 | IN 87,315 | IN 2.8% | FL 16.3 |
| 16 | CO 86,917 | NJ 2.6% | NJ 16.0 |
| 17 | WA 82,080 | GA 2.6% | GA 14.8 |
| 18 | OH 80,494 | WA 2.5% | WA 14.7 |
| 19 | SC 68,757 | ID 2.3% | UT 14.2 |
| 20 | MN 60,606 | NV 2.3% | MN 14.2 |
| 21 | WI 57,956 | UT 2.2% | ID 14.0 |
| 22 | MD 53,252 | NY 2.1% | NV 13.4 |
| 23 | AR 52,760 | MN 2.1% | WI 12.7 |
| 24 | MS 44,836 | CA 2.0% | NY 12.2 |
| 25 | VA 41,546 | WI 2.0% | TX 11.8 |
| 26 | AL 30,984 | TX 1.9% | CA 11.5 |
| US 2,987,000 | US 2.0% | US 11.8 |
Between March 2015 and March 2016, Bureau of Labor Statistics (BLS) data shows the total number of employed in California increased by 350,144 (seasonally adjusted), or 11.7% of the total net employment gains in this period for the US. Measured by percentage change in employment over the year, California was 24th highest. Adjusted for population, California ranked 26th. While California remains the leading state when measured by total change in employment, the recent data revisions show a marked drop when ranked by percentage change or change relative to population.
Labor Force Participation Rate Unchanged at 62.0%
California’s participation rate (seasonally adjusted) remained unchanged from February 2016 at 62.0%. The comparable US rate increased 0.1% to 63.0%.
California’s seasonally adjusted labor force participation rate continues to remain below the previous lows recorded in 1976. The revised labor force data shows the participation rate has remained essentially level since August 2015, alternating between 61.9% and 62.0% during this period. This most recent leveling off may suggest a potential low point since the current downward trend began in October 2008, but as indicated in the chart below, the recent experience has been a stepped function, with intermittent periods of essentially level participation rates followed by a period of contraction. A key uncertainty at this point is what the effect will be of continuing state actions that raise the effective cost of employees—higher minimum wage, mandated leave, and pending proposals affecting scheduling and other employment laws—combined with continuing state and local actions aimed at applying traditional regulatory models to the evolving gig economy that has opened up new employment options in recent years.
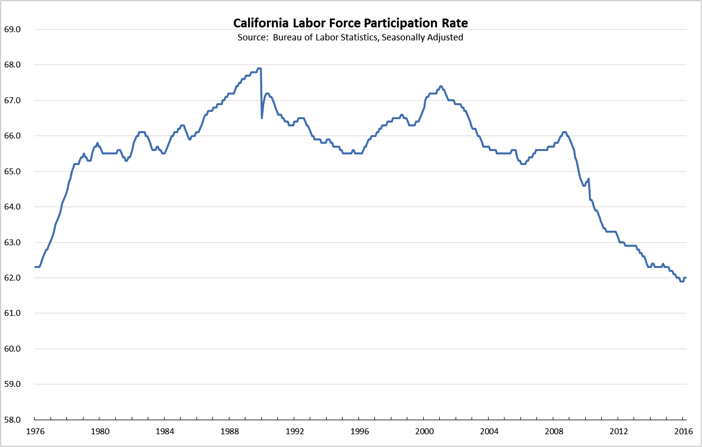
The labor force participation rate has direct implications to a range of current policy challenges, including disparity in household incomes associated with fewer employed per household, the ability of households to afford the state’s continuously rising housing costs, and effects on state and local government finances. The 4% drop since 2008 represents 1.2 million Californians who are not now in the labor force; the 5.3% drop from the prior 2001 peak represents 1.6 million. While some of this shift can be attributed to demographic changes, California has a relatively younger population than the US average and like the rest of the US, has seen increases in the age at which workers retire, yet the state’s participation rate has remained below the US average since 2002.
Nonfarm Jobs Increase 4,200
EDD reported that between February and March 2016, seasonally adjusted nonfarm payroll jobs increased by 4,200. The February job gains were revised upwards to 46,600 from the preliminary estimate of 39,900.
Looking at the not seasonally adjusted numbers, hiring saw increases in all but 3 industries. The change in total payroll jobs from February 2016 saw the largest increases in Government (24,900), Accommodation & Food Services (12,000), and Health Care & Social Services (12,000). Declines were in Mining & Logging (-500), Transportation, Warehousing & Utilities (-200), and Construction (-100).
| Not Seasonally Adjusted Payroll Jobs | Feb 2016 | Mar 2016 | Change Mar 2016 – Feb 2016 | Change Mar 2016 – Mar 2015 |
|---|---|---|---|---|
| Total Farm | 363,700 | 368,100 | 4,400 | 1,200 |
| Mining & Logging | 25,500 | 25,000 | -500 | -3,900 |
| Construction | 739,400 | 739,300 | -100 | 41,100 |
| Manufacturing | 1,275,000 | 1,276,700 | 1,700 | -4,200 |
| Wholesale Trade | 727,800 | 732,600 | 4,800 | 21,000 |
| Retail Trade | 1,654,600 | 1,658,500 | 3,900 | 31,200 |
| Transportation, Warehousing & Utilities | 556,500 | 556,300 | -200 | 16,200 |
| Information | 493,700 | 494,200 | 500 | 14,800 |
| Finance & Insurance | 525,700 | 527,100 | 1,400 | 5,400 |
| Real Estate & Rental & Leasing | 271,800 | 274,200 | 2,400 | 8,500 |
| Professional, Scientific & Technical Services | 1,234,800 | 1,238,400 | 3,600 | 45,400 |
| Management of Companies & Enterprises | 232,100 | 233,700 | 1,600 | 4,600 |
| Administrative & Support & Waste Services | 1,051,000 | 1,052,100 | 1,100 | 19,100 |
| Educational Services | 370,400 | 373,600 | 3,200 | 16,100 |
| Health Care & Social Assistance | 2,157,800 | 2,169,800 | 12,000 | 90,400 |
| Individual & Family Services | 590,100 | 594,100 | 4,000 | 33,300 |
| Arts, Entertainment, & Recreation | 290,300 | 289,800 | -500 | 11,600 |
| Accommodation & Food Service | 1,560,100 | 1,572,100 | 12,000 | 60,600 |
| Other Services | 547,900 | 548,500 | 600 | 9,400 |
| Government | 2,511,800 | 2,536,700 | 24,900 | 51,100 |
| Total Nonfarm | 16,226,200 | 16,298,600 | 72,400 | 438,400 |
| Total Wage & Salary | 16,589,900 | 16,666,700 | 76,800 | 439,600 |
By total number of new jobs, California had the highest increase in seasonally adjusted nonfarm jobs among the states from March 2014 to March 2015, at 420,800 or 15.0% of the US net increase. By percentage growth in jobs, California was 14th highest, and by population adjusted jobs growth, 15th highest. As is the case with employment, California’s relative ranking by these last two measures has dropped under the revised data.
| Rank | Number of Jobs | Employment Growth (%) | Population Adjusted (job growth per 1,000 civilian noninstitutional population) |
|---|---|---|---|
| 1 | CA 420,800 | ID 3.6% | UT 20.6 |
| 2 | FL 234,300 | OR 3.3% | ID 19.0 |
| 3 | TX 185,000 | UT 3.3% | OR 18.0 |
| 4 | NY 132,300 | TN 3.2% | DC 17.7 |
| 5 | GA 130,000 | WA 3.2% | TN 17.6 |
| 6 | VA 108,000 | AZ 3.1% | WA 17.5 |
| 7 | NC 104,300 | GA 3.1% | HI 16.9 |
| 8 | WA 99,700 | HI 2.9% | GA 16.5 |
| 9 | MI 97,300 | FL 2.9% | CO 16.5 |
| 10 | OH 94,700 | NV 2.8% | VA 16.5 |
| 11 | TN 91,800 | VA 2.8% | NV 15.5 |
| 12 | AZ 81,600 | CO 2.8% | DE 15.5 |
| 13 | PA 81,000 | SC 2.7% | AZ 15.3 |
| 14 | IL 79,900 | CA 2.6% | FL 14.2 |
| 15 | NJ 77,900 | DE 2.6% | CA 13.7 |
| 16 | CO 71,000 | NC 2.5% | SC 13.7 |
| 17 | MD 62,400 | MD 2.4% | NC 13.3 |
| 18 | MA 61,400 | MI 2.3% | MD 13.2 |
| 19 | OR 58,600 | AR 2.2% | MI 12.3 |
| 20 | SC 52,800 | KY 2.0% | NE 11.3 |
| US 2,802,000 | US 2.0% | US 11.1 |
Seven Industries Below 2007 Pre-Recession Job Levels
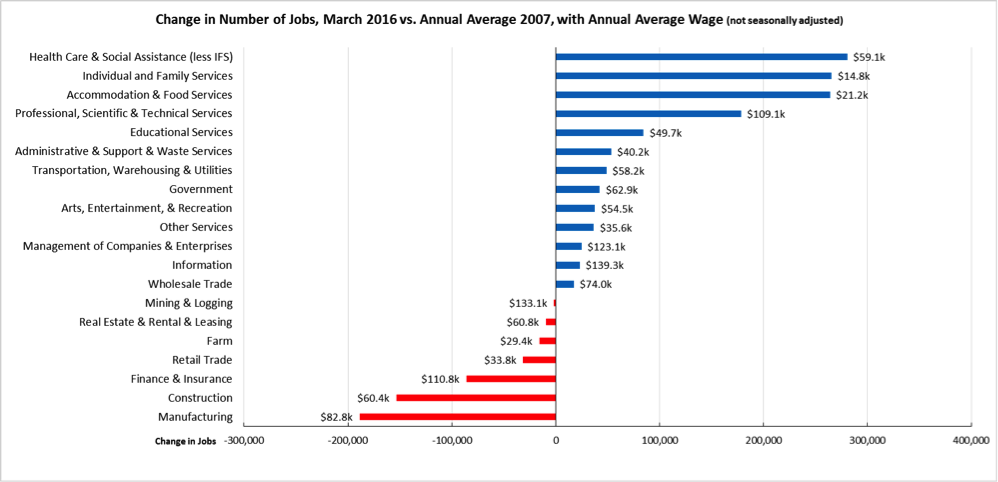
Comparing the number of jobs by industry in March 2016 (not seasonally adjusted), seven industries showed employment below the 2007 pre-recession levels. In the highest gain industries, Health Care & Social Assistance (less Individual & Family Services) remained the leading industry, followed by the two lowest wage industries in 2nd and 3rd place.
12 Counties in Double-Digit Unemployment, 16 are 5% or Less


Two-Tier Economy Persists
Unemployment rates (all data is not seasonally adjusted) continue to vary widely across the state, ranging from 3.9% in the Bay Area to more than double at 10.7% in the Central Valley.
| Not Seasonally Adjusted | Unemployment Rate (%) March 2016 |
|---|---|
| California | 5.6 |
| Bay Area | 3.9 |
| Orange County | 4.0 |
| Los Angeles | 5.0 |
| San Diego/Imperial | 5.3 |
| Sacramento Region | 5.4 |
| Inland Empire | 5.8 |
| Central Sierra | 6.5 |
| Central Coast | 8.2 |
| Upstate California | 8.3 |
| Central Valley | 10.7 |
By Legislative District:
| Lowest 10 Unemployment Rates | |||||
|---|---|---|---|---|---|
| CD 12 (Pelosi – D) | 3.1 | SD 12 (Hill – D) | 2.9 | AD 16 (Baker – R) | 2.8 |
| CD 45 (Walters – R) | 3.2 | SD 11 (Leno – D) | 3.3 | AD 22 (Mullin – D) | 2.8 |
| CD 18 (Eshoo – D) | 3.3 | SD 37 (Moorlach – R) | 3.4 | AD 24 (Gordon – R) | 3.0 |
| CD 14 (Speier – D) | 3.4 | SD 26 (Allen – D) | 3.7 | AD 28 (Low – D) | 3.1 |
| CD 52 (Peters – D) | 3.4 | SD 15 (Block – D) | 3.7 | AD 17 (Chiu – D) | 3.3 |
| CD 17 (Honda – D) | 3.5 | SD 36 (Bates – R) | 3.8 | AD 19 (Ting – D) | 3.4 |
| CD 33 (Lieu – D) | 3.6 | SD 25 (Beall – D) | 4.0 | AD 74 (Harper – R) | 3.4 |
| CD 27 (Chu – D) | 3.7 | SD 07 (Glazer – D) | 4.1 | AD 77 (Maienschein – R) | 3.4 |
| CD 48 (Rohrabacher – R) | 3.8 | SD 10 (Wieckowski – D) | 4.1 | AD 73 (Brough – R) | 3.4 |
| CD 39 (Royce – R) | 3.9 | SD 02 (Liu – D) | 4.1 | AD 66 (Hadley – R) | 3.5 |
| Highest 10 Unemployment Rates | |||||
|---|---|---|---|---|---|
| CD 03 (Garamendi – D) | 7.4 | SD 20 (Leyva – D) | 6.0 | AD 30 (Alejo – D) | 9.0 |
| CD 01 (LaMalfa – R) | 7.5 | SD 35 (Hall – D) | 6.0 | AD 03 (Gallagher – R) | 9.0 |
| CD 09 (McNerney – D) | 8.1 | SD 17 (Monning – D) | 6.6 | AD 13 (Eggman – D) | 9.4 |
| CD 10 (Denham – R) | 9.0 | SD 04 (Nielsen – R) | 7.3 | AD 23 (Patterson – R) | 9.4 |
| CD 20 (Farr – D) | 9.6 | SD 40 (Hueso – D) | 8.7 | AD 34 (Grove – R) | 9.5 |
| CD 23 (McCarthy – R) | 9.9 | SD 05 (Galgiani – D) | 8.7 | AD 56 (Garcia – D) | 11.3 |
| CD 51 (Vargas – D) | 10.2 | SD 08 (Berryhill – R) | 8.9 | AD 31 (Arambula – D) | 12.0 |
| CD 22 (Nunes – R) | 10.2 | SD 16 (Fuller – R) | 9.7 | AD 26 (Mathis – R) | 12.1 |
| CD 16 (Costa – D) | 12.1 | SD 12 (Cannella – R) | 11.1 | AD 21 (Gray – D) | 12.1 |
| CD 21 (Valadao – R) | 13.0 | SD 14 (Vidak – R) | 13.8 | AD 32 (Salas – D) | 13.8 |
8 California MSAs in the 10 Worst Unemplyment Rates Nationally
Of the 10 Metropolitan Statistical Areas (MSAs) with the worst unemployment rates nationally, 8 were in California. Of the 20 worst, 12 are in California.
| US Rank | MSA | Mar 2016 Unemployment Rate |
|---|---|---|
| 368 | Wenatchee, WA Metropolitan Statistical Area | 8.3 |
| 369 | Danville, IL Metropolitan Statistical Area | 8.4 |
| 370 | Wheeling, WV-OH Metropolitan Statistical Area | 8.5 |
| 371 | Santa Cruz-Watsonville, CA Metropolitan Statistical Area | 8.8 |
| 371 | Stockton-Lodi, CA Metropolitan Statistical Area | 8.8 |
| 373 | Weirton-Steubenville, WV-OH Metropolitan Statistical Area | 9.0 |
| 374 | Modesto, CA Metropolitan Statistical Area | 9.4 |
| 375 | Beckley, WV Metropolitan Statistical Area | 9.5 |
| 376 | Madera, CA Metropolitan Statistical Area | 9.9 |
| 377 | Yakima, WA Metropolitan Statistical Area | 10.3 |
| 378 | Fresno, CA Metropolitan Statistical Area | 10.5 |
| 379 | Salinas, CA Metropolitan Statistical Area | 10.8 |
| 380 | Bakersfield, CA Metropolitan Statistical Area | 10.9 |
| 380 | Yuba City, CA Metropolitan Statistical Area | 10.9 |
| 382 | Hanford-Corcoran, CA Metropolitan Statistical Area | 11.3 |
| 383 | Visalia-Porterville, CA Metropolitan Statistical Area | 12.1 |
| 384 | Merced, CA Metropolitan Statistical Area | 12.6 |
| 385 | Ocean City, NJ Metropolitan Statistical Area | 13.4 |
| 386 | Yuma, AZ Metropolitan Statistical Area | 15.1 |
| 387 | El Centro, CA Metropolitan Statistical Area | 18.6 |
Note: All data sources, methodologies, and historical data series available at CenterforJobs.org.