Highlights for policy makers:
- Unemployment Rate Level at 4.3%; Total Employment Gains 2,400
- Labor Force Participation Rate Level Dips to 62.2%
- State Employment Growth Rankings
- Nonfarm Jobs Down 7,200
- Four Industries Below 2007 Pre-Recession Job Levels
- Job Gains by Wage Level
- Two-Tier Economy Persists—Central Valley Unemployment More Than Three Times as High as Bay Area
- Bay Area Provided 39% of Net Employment Growth Since Recession
- Eight California MSAs in the 10 Worst Unemployment Rates Nationally
Unemployment Rate Level at 4.3%; Total Employment Gains 2,400
The Labor Force data for March 2018 (seasonally adjusted; California preliminary) is shown below, along with the change from the prior month:
| Seasonally Adjusted | California | US | ||
|---|---|---|---|---|
| Mar 2018 | Change from Feb 2018 | Mar 2018 | Change from Feb 2018 | |
| Unemployment Rate | 4.3% | 0.0 | 4.1% | 0.0 |
| Labor Force | 19,379,600 | -0.1% | 161,763,000 | -0.1% |
| Participation Rate | 62.2% | -0.1 | 62.9% | -0.1 |
| Employment | 18,552,200 | 0.0% | 155,178,000 | 0.0% |
| Unemployment | 827,500 | -1.8% | 6,585,000 | -1.8% |
The related not seasonally adjusted numbers (California preliminary), with the change from March 2017:
| Not Seasonally Adjusted | California | US | ||
|---|---|---|---|---|
| Mar 2018 | Change from Mar 2017 | Mar 2018 | Change from Mar 2017 | |
| Unemployment Rate | 4.2% | -1.0% | 4.1% | -0.5 |
| Labor Force | 19,343,000 | 0.3% | 161,548,000 | 1.0% |
| Participation Rate | 62.1% | -0.3% | 62.8% | -0.1% |
| Employment | 18,526,000 | 1.3% | 154,877,000 | 1.5% |
| Unemployment | 817,000 | -18.1% | 6,671,000 | -8.4% |
California Employment Development Department’s (EDD) latest data shows on a seasonally adjusted basis, total employment was up 2,400 from February, while the number of unemployed dropped by 15,600. The labor force dipped by 13,200.
California’s seasonally adjusted unemployment rate remained stable at 4.3%, repeating the lowest level in the current data series that began in 1976. California tied with Delaware for the 21st highest unemployment rate among the states. The unadjusted rate dropped from 5.2% in March 2017 to 4.2% as the state’s labor force grew less than a third as fast as the other states.
Total US employment saw a seasonally adjusted loss of 37,000 from February, while the number of unemployed dropped by 121,000. The national unemployment rate was steady at 4.1% for the sixth month in a row. The national labor force numbers dipped by 158,000.
Labor Force Participation Rate Dips to 62.2%
California’s participation rate (seasonally adjusted) in March dipped 0.1 to 62.2%, while the US rate dipped by the same amount to 62.9%. The California rate is improved from the revised series low from 2015, but continues to match levels previously seen in 1976.
Considered by age, the prime working age groups (age 25-54 and 55-64) remain somewhat below their previous highs since 2000. The most significant declines have been among youth and young adults. These trends, in particular, have long-term implications for income distributions in the state, as most studies indicate that work skills developed through early employment are correlated with long-term earnings potential. In contrast to the younger groups, persons 65 and older show a higher labor force participation rate compared to the prior low at the beginning of this period.
Labor Force Participation Rate by Age
| Prior Max | Mar 2018 | |
|---|---|---|
| Total | 67.2% | 62.2% |
| 16-19 | 46.8% | 27.4% |
| 20-24 | 76.4% | 66.0% |
| 25-54 | 82.1% | 80.0% |
| 55-64 | 66.3% | 63.5% |
| Prior Min | ||
| 65+ | 12.1% | 19.5% |
State Employment Growth Rankings
| Rank | Number of Employed | Percentage Change | Population Adjusted (employment growth per 1,000 civilian noninstitutional population) |
|---|---|---|---|
| 1 | CA 290,000 | ID 3.2% | ID 19.8 |
| 2 | TX 284,700 | CO 2.9% | CO 18.9 |
| 3 | FL 175,100 | GA 2.6% | UT 16.8 |
| 4 | GA 125,600 | NV 2.6% | GA 15.8 |
| 5 | CO 82,700 | AZ 2.6% | NV 15.3 |
| 6 | AZ 80,500 | UT 2.5% | AZ 14.8 |
| 7 | NC 69,700 | LA 2.3% | TX 13.5 |
| 8 | TN 69,700 | TN 2.3% | TN 13.3 |
| 9 | WA 67,500 | TX 2.2% | LA 12.9 |
| 10 | VA 50,900 | OR 2.1% | OR 12.8 |
| 11 | MN 48,300 | WA 1.9% | WA 11.6 |
| 12 | LA 46,400 | FL 1.8% | MN 11.1 |
| 13 | OR 42,500 | NM 1.7% | FL 10.4 |
| 14 | MA 41,000 | OK 1.7% | OK 9.7 |
| 15 | WI 39,700 | MN 1.6% | CA 9.4 |
| 16 | OH 39,300 | CA 1.6% | NM 9.2 |
| 17 | UT 37,600 | NC 1.5% | DC 9.2 |
| 18 | NV 35,600 | DC 1.4% | NC 8.7 |
| 19 | IL 31,600 | WI 1.3% | WI 8.7 |
| 20 | OK 28,900 | KY 1.3% | VA 7.7 |
| 21 | ID 25,600 | VA 1.2% | MA 7.4 |
| 22 | KY 24,600 | MA 1.2% | KY 7.1 |
| 23 | MI 23,400 | DE 1.1% | VT 6.6 |
| 24 | IN 18,800 | VT 1.0% | DE 6.6 |
| 25 | SC 18,800 | SD 1.0% | SD 6.5 |
| US 2,114,000 | US 1.4% | US 8.3 |
Between March 2017 and March 2018, Bureau of Labor Statistics (BLS) data shows the total number of employed in California increased by 290,000 (seasonally adjusted), or 13.7% of the total net employment gains in this period for the US. Based on the total numbers, California remained in 1st place ahead of Texas (which has a civilian working-age population only 69% as large as California’s) at a close 284,700 and Florida (55% as large) at 175,100. Measured by percentage change in employment over the year, California dropped to 16th highest. Adjusted for working-age population, California dropped to 15th.
Nonfarm Jobs Down 7,200
EDD reported that between February and March 2018, seasonally adjusted nonfarm wage and salary jobs dipped 7,200. February’s gains were revised to 1,200 from the previously reported 14,000.
In the not seasonally adjusted nonfarm numbers, hiring saw increases in all but 3 industries over the year. The change in total payroll jobs from March 2017 saw the largest increases in Construction (52,200), Social Assistance (42,600), and Government (32,700). Declines were in Other Services (-3,900), Utilities (-1,000), and Management of Companies & Enterprises (-900).
| Not Seasonally Adjusted Payroll Jobs | Mar 2018 | Feb 2018 | Change Mar 2018 – Feb 2018 | Change Mar 2018 – Mar 2017 |
|---|---|---|---|---|
| Total Farm | 366,500 | 363,300 | 3,200 | 7,200 |
| Mining and Logging | 21,200 | 21,200 | 0 | 600 |
| Construction | 832,800 | 837,100 | -4,300 | 52,200 |
| Manufacturing | 1,315,100 | 1,309,900 | 5,200 | 14,300 |
| Wholesale Trade | 727,300 | 725,900 | 1,400 | 12,300 |
| Retail Trade | 1,673,700 | 1,681,800 | -8,100 | 13,700 |
| Utilities | 58,000 | 57,900 | 100 | -1,000 |
| Transportation & Warehousing | 577,300 | 575,500 | 1,800 | 25,300 |
| Information | 530,000 | 531,000 | -1,000 | 9,400 |
| Finance & Insurance | 547,300 | 548,600 | -1,300 | 1,400 |
| Real Estate & Rental & Leasing | 284,400 | 285,300 | -900 | 6,300 |
| Professional, Scientific & Technical Services | 1,250,000 | 1,247,500 | 2,500 | 32,400 |
| Management of Companies & Enterprises | 231,400 | 232,300 | -900 | -900 |
| Administrative & Support & Waste Services | 1,106,700 | 1,102,800 | 3,900 | 18,500 |
| Educational Services | 387,300 | 383,800 | 3,500 | 15,500 |
| Health Care | 1,523,700 | 1,519,800 | 3,900 | 29,900 |
| Social Assistance | 805,000 | 800,800 | 4,200 | 42,600 |
| Arts, Entertainment & Recreation | 305,500 | 303,600 | 1,900 | 7,300 |
| Accommodation | 227,500 | 227,400 | 100 | 4,700 |
| Food Services | 1,432,900 | 1,422,500 | 10,400 | 31,900 |
| Other Services | 556,100 | 558,200 | -2,100 | -3,900 |
| Government | 2,617,100 | 2,595,200 | 21,900 | 32,700 |
| Total Nonfarm | 17,010,300 | 16,968,100 | 42,200 | 345,200 |
| Total Wage and Salary | 17,376,800 | 17,331,400 | 45,400 | 352,400 |
At 321,000, California showed the highest increase in seasonally adjusted nonfarm jobs among the states from March 2017 to March 2018, ahead of Texas at 294,100. By percentage growth in jobs, California dipped to 10th highest at 1.9%, above the US average of 1.5%. By population adjusted jobs growth, California remained at 9th highest.
| Rank | Number of Jobs | Employment Growth (%) | Population Adjusted (job growth per 1,000 civilian noninstitutional population) |
|---|---|---|---|
| 1 | CA 321,000 | UT 3.3% | UT 21.5 |
| 2 | TX 294,100 | ID 3.3% | ID 17.9 |
| 3 | FL 173,100 | NV 2.9% | NV 16.8 |
| 4 | NY 113,300 | WA 2.8% | WA 15.8 |
| 5 | WA 91,600 | TX 2.4% | CO 14.2 |
| 6 | PA 84,000 | CO 2.4% | TX 13.9 |
| 7 | NC 73,300 | AZ 2.3% | OR 12.4 |
| 8 | NJ67,100 | OR 2.2% | AZ 11.7 |
| 9 | GA 65,200 | FL 2.0% | CA 10.4 |
| 10 | AZ 63,300 | CA 1.9% | FL 10.3 |
| 11 | CO 62,200 | SC 1.7% | SD 9.6 |
| 12 | MI 61,300 | OK 1.7% | NJ 9.4 |
| 13 | OH 54,400 | NC 1.7% | OK 9.3 |
| 14 | TN 49,000 | TN 1.6% | TN 9.3 |
| 15 | UT 48,000 | NJ 1.6% | NC 9.2 |
| 16 | MA 41,800 | GA 1.5% | SC 9.1 |
| 17 | OR 41,000 | SD 1.5% | PA 8.2 |
| 18 | VA 39,500 | PA 1.4% | GA 8.2 |
| 19 | NV 39,300 | MI 1.4% | WY 7.8 |
| 20 | IL 39,200 | RI 1.3% | NH 7.7 |
| 21 | SC 35,600 | NH 1.3% | MI 7.7 |
| 22 | WI 29,700 | HI 1.3% | MA 7.5 |
| 23 | MO 28,500 | MS 1.3% | HI 7.5 |
| 24 | OK 27,900 | WY 1.2% | RI 7.4 |
| 25 | IN 27,500 | NY 1.2% | NY 7.1 |
| US 2,261,000 | US 1.5% | US 8.9 |
Four Industries Below 2007 Pre-Recession Job Levels
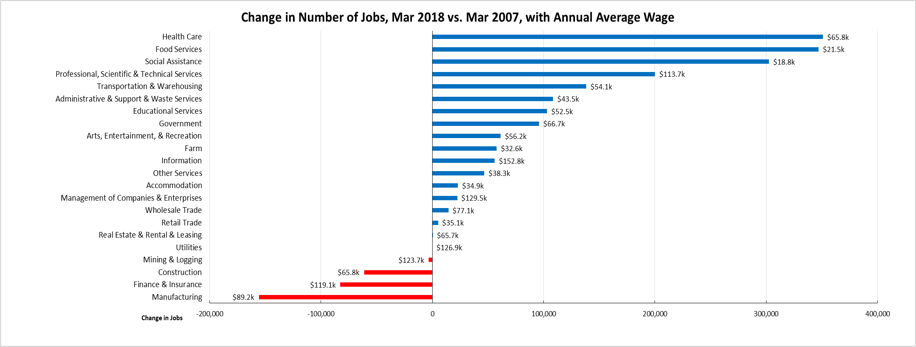
Comparing the number of jobs by industry in March 2018 (not seasonally adjusted), four industries had employment below the 2007 pre-recession levels. The highest gain industries were led by Health Care (with a relatively higher mix of lower and higher wage occupations), lower wage Food Services and Social Assistance, and higher wage Professional, Scientific & Technical Services. Of the lagging industries, three—Manufacturing, Mining & Logging, and Construction—are blue collar middle class wage industries, while the higher wage Finance & Insurance also remained in the minus column. Construction has overall improved but still remains 61,200 below the 2007 level, and 133,500 below the previous high in 2006.
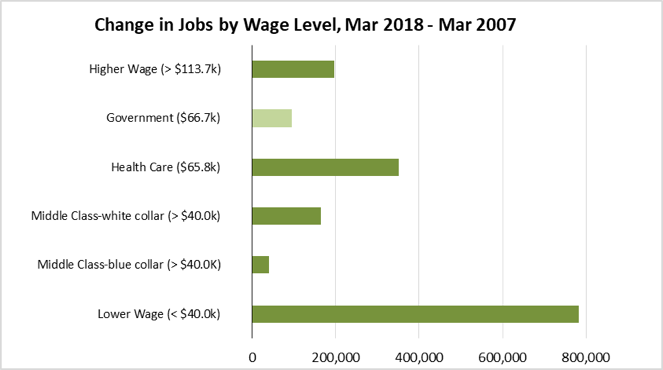
Job Gains by Wage Level
The following chart illustrates the trend for total wage and salary jobs by general wage level, according to the industry wage classification used previously in other Center analyses of this issue. As indicated, over half (59%) of net jobs growth since the recession has been in the lower wage industries. For the 12 months ending March 2018, lower wage industries accounted for about a quarter (24%) of new jobs, while middle class-blue collar jobs produced about another third (30%) as a result of improvements in Construction levels.

Two-Tier Economy Persists—Central Valley Unemployment More than Three Times as High as Bay Area
The level of unemployment rates (all data is not seasonally adjusted) continues to vary widely across the state, ranging from 2.8% in the Bay Area to more than three times as large at 8.7% in the Central Valley.
| Not Seasonally Adjusted | Unemployment Rate (%) March 2018 |
|---|---|
| California | 4.2 |
| Bay Area | 2.8 |
| Orange County | 2.8 |
| San Diego/Imperial | 3.7 |
| Sacramento | 3.9 |
| Inland Empire | 4.1 |
| Los Angeles | 4.1 |
| Central Sierra | 4.7 |
| Upstate California | 6.3 |
| Central Coast | 6.6 |
| Central Valley | 8.7 |
By Legislative District:
| Lowest 10 Unemployment Rates | |||||
|---|---|---|---|---|---|
| CD18 (Eshoo-D) | 2.2 | SD13 (Hill-D) | 2.0 | AD16 (Baker-R) | 1.9 |
| CD12 (Pelosi-D) | 2.2 | SD11 (Wiener-D) | 2.4 | AD22 (Mullin-D) | 2.0 |
| CD52 (Peters-D) | 2.4 | SD39 (Atkins-D) | 2.5 | AD24 (Berman-D) | 2.1 |
| CD45 (Walters-R) | 2.4 | SD36 (Bates-R) | 2.5 | AD28 (Low-D) | 2.2 |
| CD17 (Khanna-D) | 2.4 | SD37 (Moorlach-R) | 2.6 | AD17 (Chiu-D) | 2.4 |
| CD14 (Speier-D) | 2.5 | SD10 (Wieckowski-D) | 2.7 | AD77 (Maienschein-R) | 2.4 |
| CD49 (Issa-R) | 2.5 | SD07 (Glazer-D) | 2.8 | AD73 (Brough-R) | 2.4 |
| CD15 (Swalwell-D) | 2.5 | SD15 (Beall-D) | 2.8 | AD78 (Gloria-D) | 2.4 |
| CD48 (Rohrabacher-R) | 2.7 | SD34 (Nguyen-R) | 3.1 | AD19 (Ting-D) | 2.5 |
| CD02 (Huffman-D) | 3.0 | SD38 (Anderson-R) | 3.1 | AD25 (Chu-D) | 2.5 |
| Highest 10 Unemployment Rates | |||||
|---|---|---|---|---|---|
| CD03 (Garamendi-D) | 5.7 | SD30 (Mitchell-D) | 4.9 | AD03 (Gallagher-R) | 6.9 |
| CD44 (Barragán-D) | 5.7 | SD17 (Monning-D) | 5.0 | AD30 (Caballero-D) | 7.2 |
| CD09 (McNerney-D) | 6.1 | SD35 (Bradford-D) | 5.1 | AD13 (Eggman-D) | 7.3 |
| CD10 (Denham-R) | 6.6 | SD04 (Nielsen-R) | 5.4 | AD23 (Patterson-R) | 7.5 |
| CD51 (Vargas-D) | 7.5 | SD05 (Galgiani-D) | 6.5 | AD34 (Fong-R) | 7.6 |
| CD23 (McCarthy-R) | 8.1 | SD40 (Hueso-D) | 6.5 | AD56 (Garcia-D) | 8.5 |
| CD20 (Panetta-D) | 8.1 | SD08 (Berryhill-R) | 6.9 | AD21 (Gray-D) | 9.6 |
| CD22 (Nunes-R) | 8.6 | SD16 (Fuller-R) | 7.9 | AD31 (Arambula-D) | 10.3 |
| CD16 (Costa-D) | 10.0 | SD12 (Cannella-R) | 9.2 | AD26 (Mathis-R) | 10.7 |
| CD21 (Valadao-R) | 11.1 | SD14 (Vidak-R) | 12.0 | AD32 (Salas-D) | 11.6 |
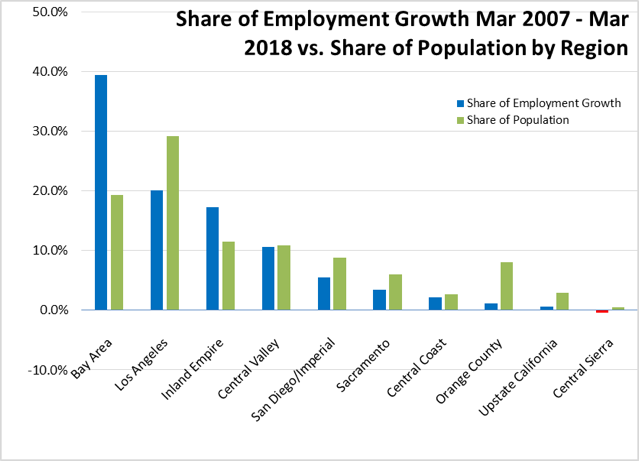
Bay Area Provided 39% of Net Employment Growth Since Recession
Containing 19.4% of the state’s population, the Bay Area was responsible for 39.5% of the net growth in employment since the pre-recession peaks in 2007. Los Angeles Region, containing 29.2% of the population, accounted for the second largest share at 20.1%. Inland Empire is the only other region continuing to show employment gains above their population share.

Eight California MSAs in the 10 Worst Unemployment Rates Nationally
According to BLS data, of the 10 Metropolitan Statistical Areas (MSAs) with the worst unemployment rates nationally, eight are in California. Of the 20 worst, 11 are in California.
| Rank | Metropolitan Area | February 2018 Rate |
|---|---|---|
| McAllen-Edinburg-Mission, TX Metropolitan Statistical Area | 7.1 | 368 |
| Stockton-Lodi, CA Metropolitan Statistical Area | 7.1 | 368 |
| Anchorage, AK Metropolitan Statistical Area | 7.4 | 371 |
| Fairbanks, AK Metropolitan Statistical Area | 7.4 | 371 |
| Modesto, CA Metropolitan Statistical Area | 7.5 | 373 |
| Atlantic City-Hammonton, NJ Metropolitan Statistical Area | 7.6 | 374 |
| Vineland-Bridgeton, NJ Metropolitan Statistical Area | 8.1 | 375 |
| Madera, CA Metropolitan Statistical Area | 8.3 | 376 |
| Yakima, WA Metropolitan Statistical Area | 8.5 | 377 |
| Watertown-Fort Drum, NY Metropolitan Statistical Area | 8.7 | 378 |
| Yuba City, CA Metropolitan Statistical Area | 8.9 | 379 |
| Fresno, CA Metropolitan Statistical Area | 9.1 | 380 |
| Bakersfield, CA Metropolitan Statistical Area | 9.6 | 381 |
| Hanford-Corcoran, CA Metropolitan Statistical Area | 9.7 | 382 |
| Salinas, CA Metropolitan Statistical Area | 10.3 | 383 |
| Merced, CA Metropolitan Statistical Area | 10.6 | 384 |
| Visalia-Porterville, CA Metropolitan Statistical Area | 11.3 | 385 |
| Yuma, AZ Metropolitan Statistical Area | 13.5 | 386 |
| Ocean City, NJ Metropolitan Statistical Area | 14.3 | 387 |
| El Centro, CA Metropolitan Statistical Area | 16.0 | 388 |
Note: All data sources, methodologies, and historical data series available at CenterforJobs.org.