Download March 2019 Jobs Report
Highlights for policy makers:
- Unemployment Level Up at 4.3%; Employment Down 16,900
- Labor Force Participation Rate Stays at 62.8%
- Labor Force Rate by Age
- Employment Growth Ranking—California Remains 1st
- Nonfarm Jobs Up 14,600 for Month; California Remains Ranked #2 for 12-month Gain
- Jobs Change by Industry
- Structural Shifts in State’s Economy
- Unemployment Rates by Region
- Unemployment Rates by Legislative District
- Employment Growth by Region
- MSAs with the Worst Unemployment Rates
- Chart of the Month: Business Employment Dynamics
Unemployment Level Up at 4.3%; Employment Down 16,900
EDD reported total employment (seasonally adjusted; March preliminary) was down 16,900 from February, while the number of unemployed rose 14,400. Unemployment rate rose to 4.3%. The unadjusted rate was up 0.2 point from the year earlier to 4.6%.
California had the 12th highest unemployment rate.
Total US employment saw a seasonally adjusted drop of 201,000, with the number of unemployed dropping 24,000. The unemployment rate remained at 3.8%.
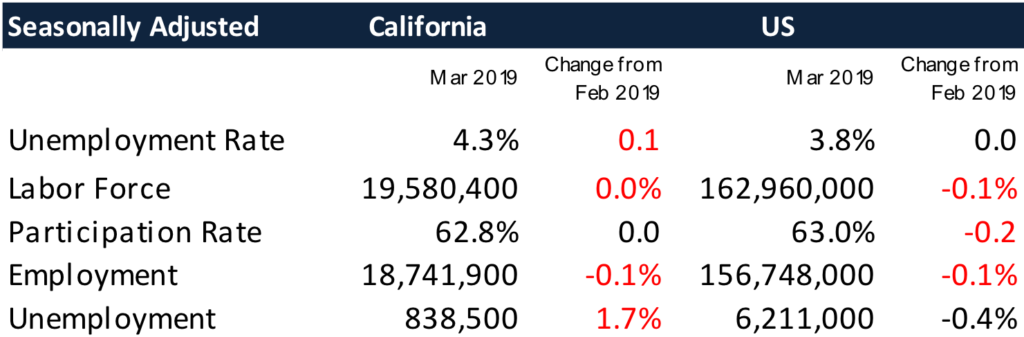
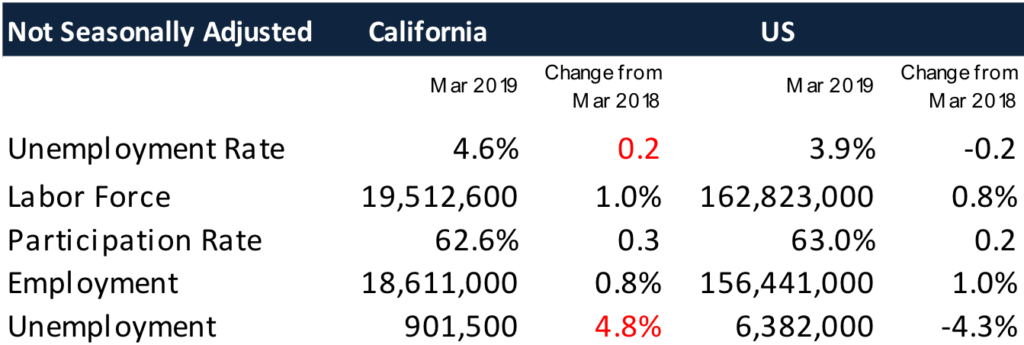
Figure Sources: California Employment Development Department; US Bureau of Labor Statistics
Labor Force Participation Rate Stays at 62.8%
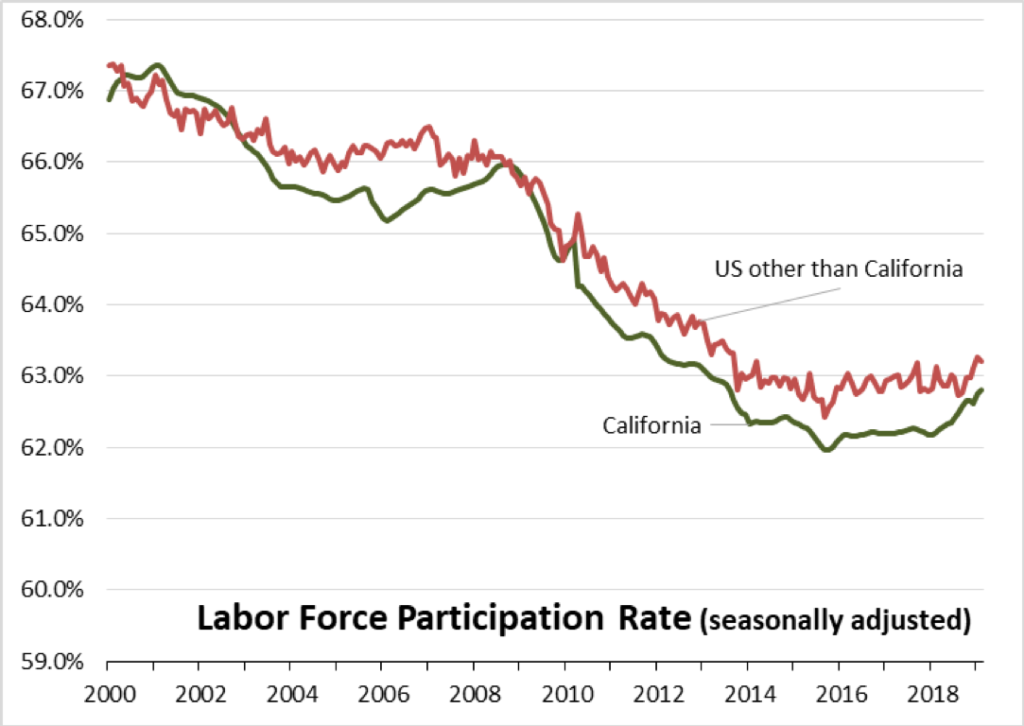
Figure Sources: California Employment Development Department; US Bureau of Labor Statistics
California’s seasonally adjusted labor force participation rate remained at 62.8% with a marginal loss of workers in the labor force. Nationally, the participation rate dipped to 63.0%. Although the gap has narrowed, the state continues to experience lower than average participation rates in spite of having a relatively younger population than the rest of the US.
For the 12 months ending March 2019, the seasonally adjusted data shows the California labor force grew 1.4% compared to the rest of the US at 0.7%.
Labor Force Rate by Age
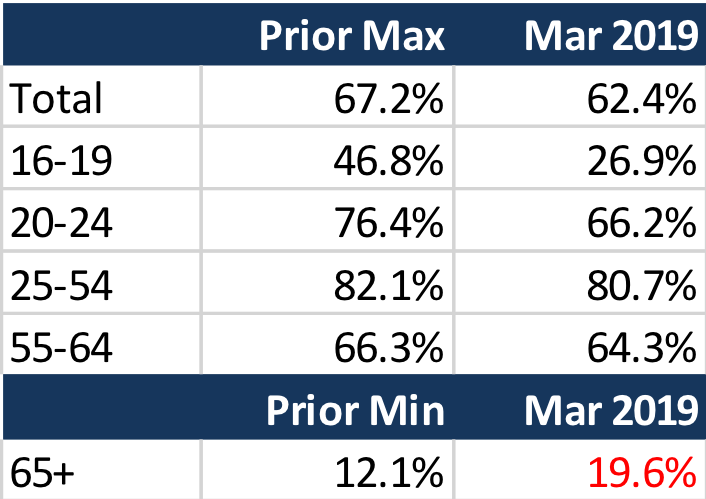
Figure Source: California Employment Development Department
Labor force participation by age (12-month running average) grew for all groups except seniors. The continued low rates for youth and young adults in particular have implications for life-time earnings potential due to the delay in acquiring essential workplace skills. While more people are working past age 65, these gains do not offset the sharp drops in the youngest groups and softness in the prime working age groups.
Employment Growth Ranking—California Remains 1st
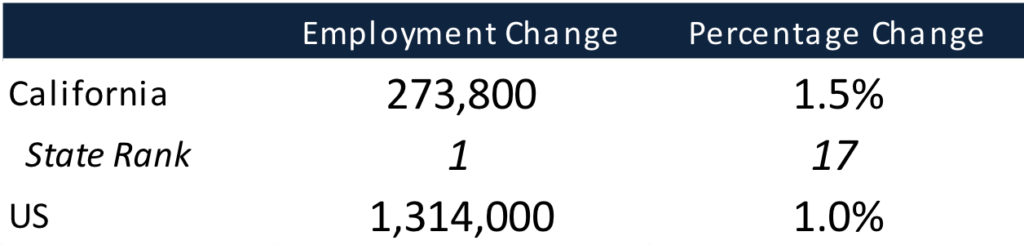
Figure Sources: California Employment Development Department; US Bureau of Labor Statistics
Over the 12 months ending in March, the total number of persons employed (seasonally adjusted) grew by 273,800. California remained in 1st place ahead of Texas, which saw an additional 252,500 persons employed over this period.
Based on percentage growth, California had a 1.5% expansion in employment, above the average for the rest of the US at 1.0%. Ranked among the states, California’s growth rate dipped to 17th place, while Arizona continued to lead at 3.2%.
Nonfarm Jobs Up 24,500 for Month; California Remains Ranked #2 for 12-month Gain
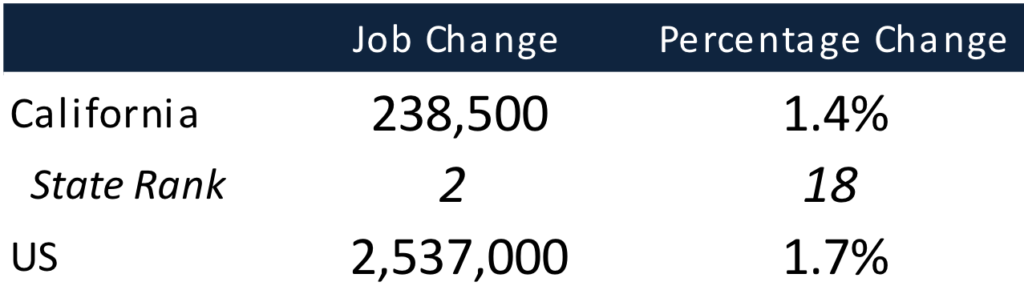
Figure Sources: California Employment Development Department; US Bureau of Labor Statistics
Nonfarm jobs (seasonally adjusted) were up 24,500 from February. February’s gains were revised to 20,900 from the previously reported 14,600.
For the 12 months ending March, total jobs growth was 238,500, keeping the state in 2nd place behind Texas which gained 271,000 jobs in this period, with Florida in a close third at 209,700.
On a percentage basis, California edged up to 18th among the states, with a 12-month jobs growth rate of 1.4% vs. the US average of 1.7%.
Jobs Change by Industry
![]()
Figure Sources: California Employment Development Department; US Bureau of Labor Statistics
In the unadjusted numbers that allow a more detailed look at industry shifts, hiring saw increases in all but 4 industries over the year.
Gains in payroll jobs were led by Professional, Scientific & Technical Services ($121.7k average annual wages), Health Care ($67.7k), and Administrative & Support & Waste Services ($45k).
Declines were led by Finance & Insurance ($128.3k), Retail Trade ($36.3k), and Wholesale Trade ($78.9k).
All wage data is from the most current 4-quarter average from the Quarterly Census of Employment & Wages.
Structural Shifts in State’s Economy
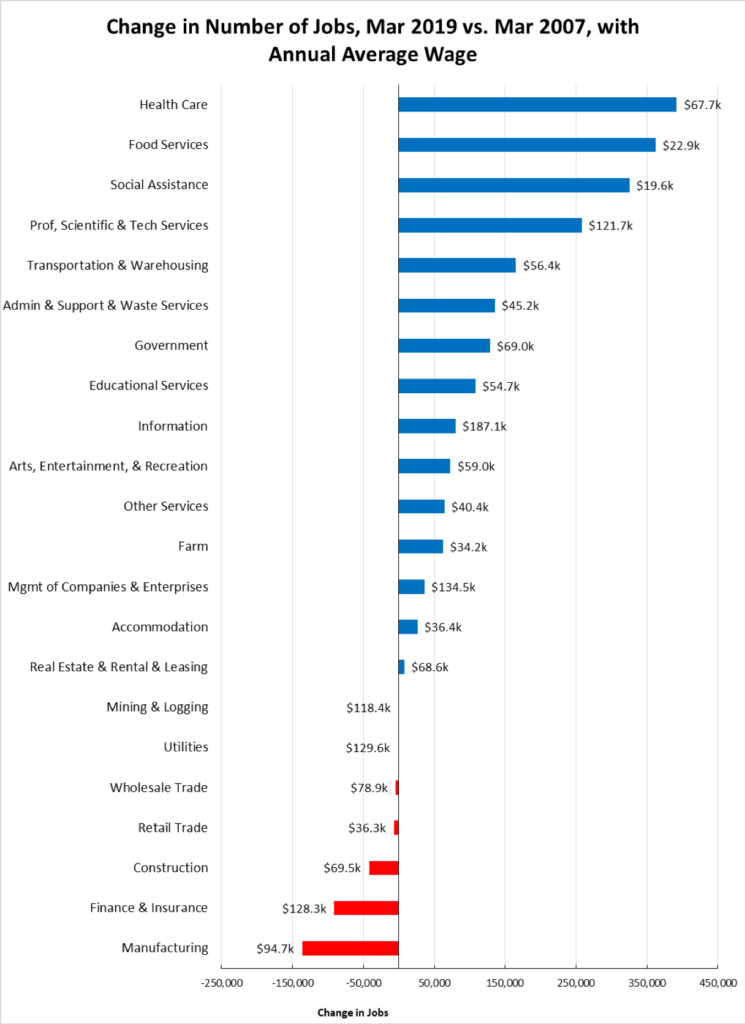
Figure Source: California Employment Development Department
Comparing current job numbers to the pre-recession levels in 2007 illustrates the structural shift in the state’s economy, with the primary jobs growth occurring in the higher and lower wage industries.
Jobs growth within the traditional middle class wage—especially blue collar industries such as Manufacturing, Construction, and Mining & Logging—continues to lag with the heavily blue collar Utilities beginning to show shrinkage as well. After stronger gains during the recovery, both Wholesale and Retail Trade have dipped into negative territory, reflecting competitive pressures from nontraditional channels as well as greater use of technology in response to growing costs for labor, energy, rent, and regulation. Finance & Insurance also continues to lose ground.
Construction has gained in the past year as activity has picked up. While improving, construction jobs remain 67,100 below the 2007 peak and 113,600 (12%) below the pre-recession high in 2006.
Unemployment Rates by Region
| California | 4.6 |
| Bay Area | 3.1 |
| Orange County | 3.2 |
| Sacramento | 4.3 |
| San Diego/Imperial | 4.3 |
| Los Angeles | 4.4 |
| Inland Empire | 4.5 |
| Central Sierra | 5.1 |
| Upstate California | 7.1 |
| Central Coast | 7.3 |
| Central Valley | 9.3 |
Unemployment Rates by Legislative District
| Lowest 10 Unemployment Rates | |||||
|---|---|---|---|---|---|
| CD12 (Pelosi-D) | 2.4 | SD13 (Hill-D) | 2.3 | AD22 (Mullin-D) | 2.2 |
| CD18 (Eshoo-D) | 2.6 | SD11 (Wiener-D) | 2.6 | AD16 (Bauer-Kahan-D) | 2.2 |
| CD17 (Khanna-D) | 2.7 | SD36 (Bates-R) | 2.9 | AD24 (Berman-D) | 2.4 |
| CD14 (Speier-D) | 2.7 | SD37 (Moorlach-R) | 2.9 | AD28 (Low-D) | 2.5 |
| CD15 (Swalwell-D) | 2.7 | SD39 (Atkins-D) | 2.9 | AD17 (Chiu-D) | 2.5 |
| CD52 (Peters-D) | 2.9 | SD10 (Wieckowski-D) | 2.9 | AD25 (Chu-D) | 2.7 |
| CD49 (Levin-D) | 2.9 | SD15 (Beall-D) | 3.1 | AD19 (Ting-D) | 2.7 |
| CD45 (Porter-D) | 3.0 | SD07 (Glazer-D) | 3.1 | AD78 (Gloria-D) | 2.8 |
| CD48 (Rouda-D) | 3.0 | SD34 (Umberg-D) | 3.5 | AD73 (Brough-R) | 2.8 |
| CD27 (Chu-D) | 3.2 | SD38 (Jones-R) | 3.5 | AD74 (Petrie-Norris-D) | 2.9 |
| Highest 10 Unemployment Rates | |||||
|---|---|---|---|---|---|
| CD03 (Garamendi-D) | 6.3 | SD30 (Mitchell-D) | 5.2 | AD30 (Rivas-D) | 7.5 |
| CD01 (LaMalfa-R) | 6.3 | SD35 (Bradford-D) | 5.4 | AD23 (Patterson-R) | 7.8 |
| CD09 (McNerney-D) | 6.6 | SD17 (Monning-D) | 5.6 | AD03 (Gallagher-R) | 7.9 |
| CD10 (Harder-D) | 7.0 | SD04 (Nielsen-R) | 6.2 | AD13 (Eggman-D) | 8.0 |
| CD51 (Vargas-D) | 8.6 | SD05 (Galgiani-D) | 7.1 | AD34 (Fong-R) | 8.3 |
| CD20 (Panetta-D) | 8.7 | SD08 (Borgeas-R) | 7.3 | AD56 (Garcia-D) | 9.5 |
| CD23 (McCarthy-R) | 8.8 | SD40 (Hueso-D) | 7.4 | AD21 (Gray-D) | 10.1 |
| CD22 (Nunes-R) | 9.0 | SD16 (Grove-R) | 8.4 | AD31 (Arambula-D) | 11.2 |
| CD16 (Costa-D) | 10.9 | SD12 (M.Caballero-D) | 9.9 | AD26 (Mathis-R) | 11.8 |
| CD21 (Cox-D) | 11.7 | SD14 (Hurtado-D) | 13.0 | AD32 (Salas-D) | 12.1 |
Employment Growth by Region
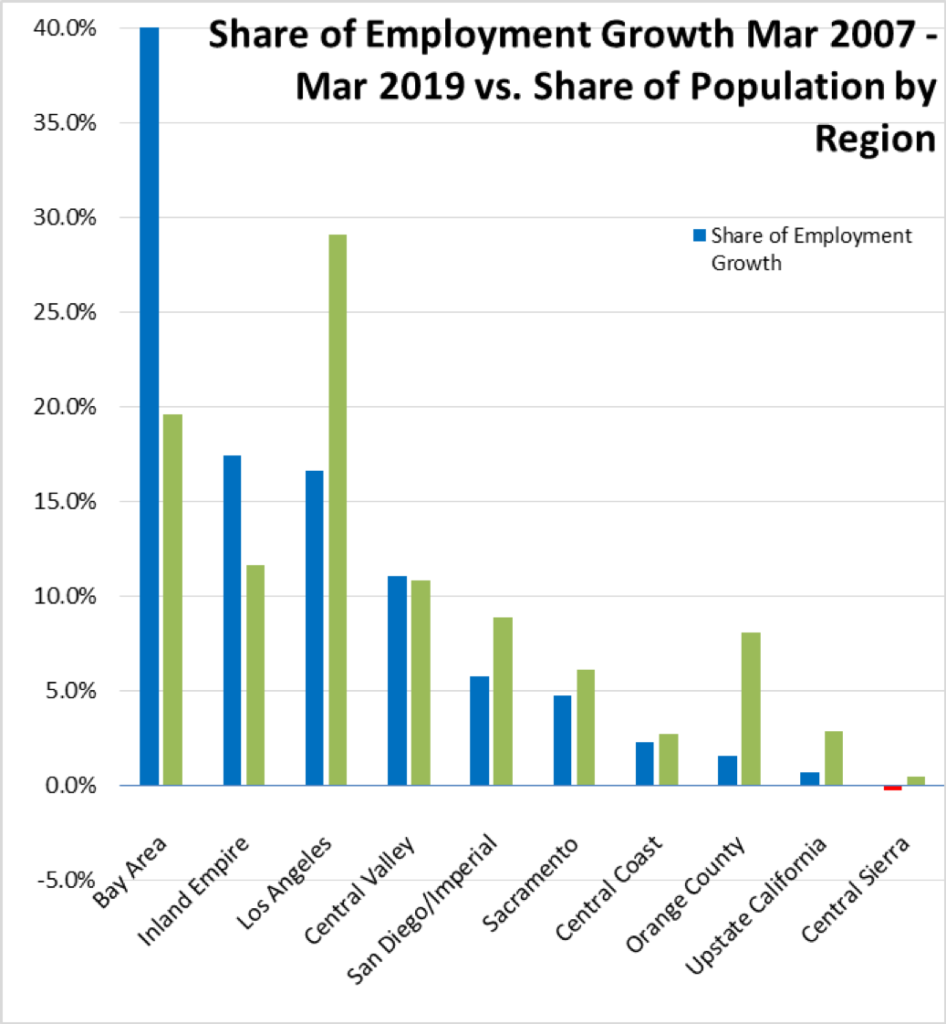
Figure Sources: California Employment Development Department; Department of Finance
Containing 19.6% of the state’s population, the Bay Area has accounted for 40.3% of net employment growth compared to pre-recession levels. Los Angeles Region, with 29.1% of the population, accounted for only 16.6% of net employment gains, while Inland Empire continues to occupy the number 2 slot.
MSAs with the Worst Unemployment Rates
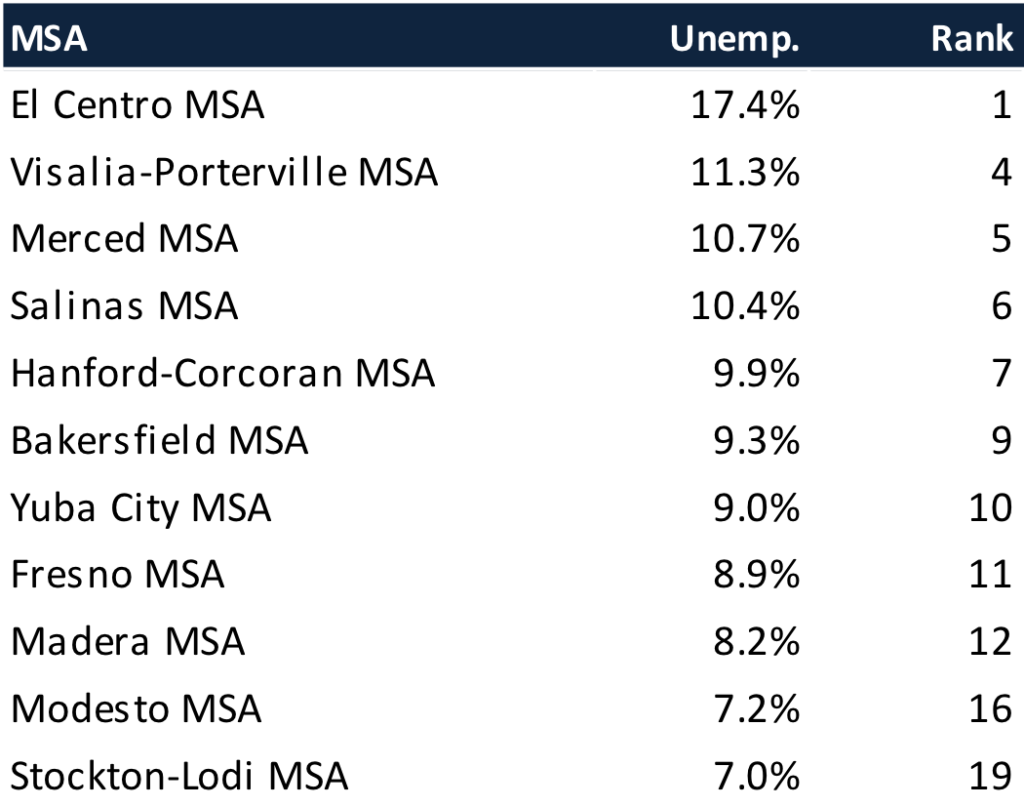
Figure Source: US Bureau of Labor Statistics, December 2018 data
Of the 20 Metropolitan Statistical Areas (MSAs) with the worst unemployment rates in February 2018, 11 are in California, including El Centro MSA (Imperial County) with the highest unemployment rate in the country.
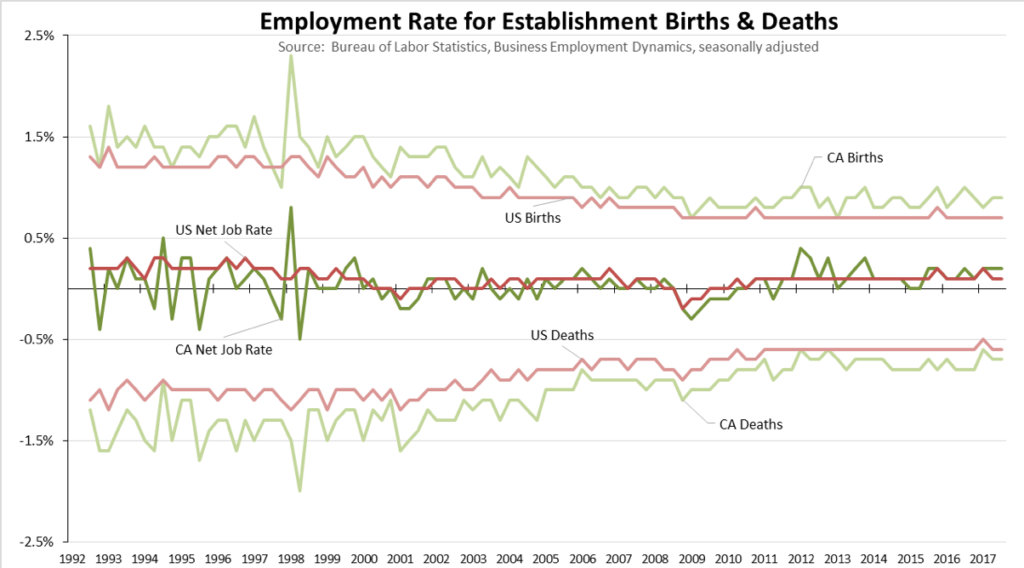
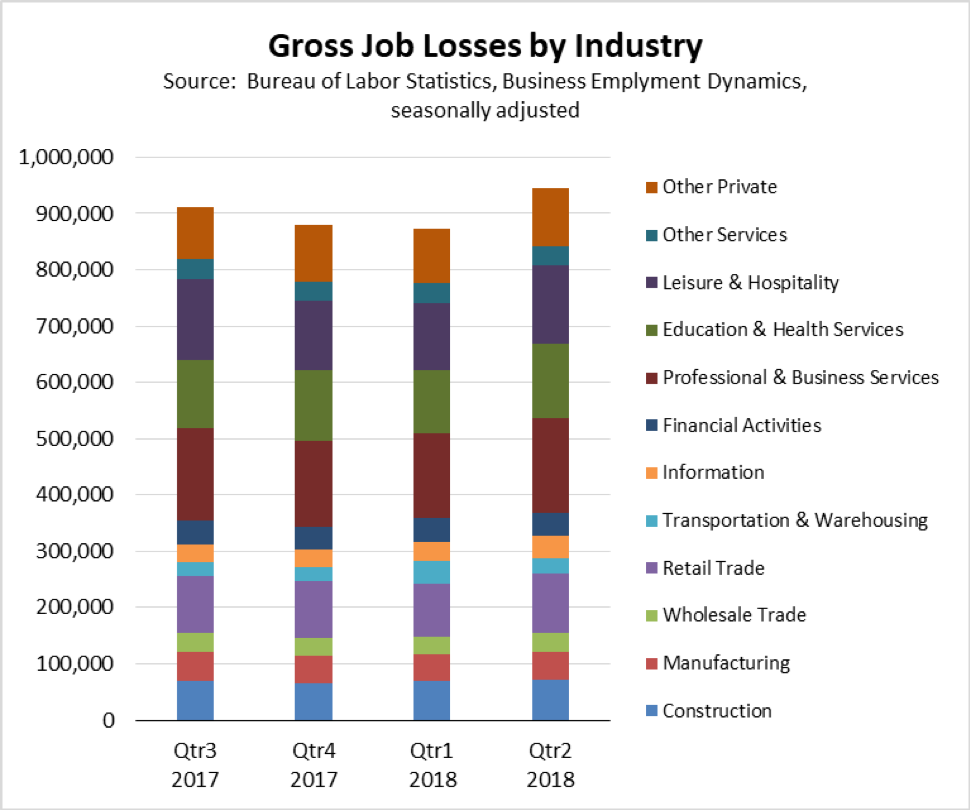
Chart of the Month: Business Employment Dynamics
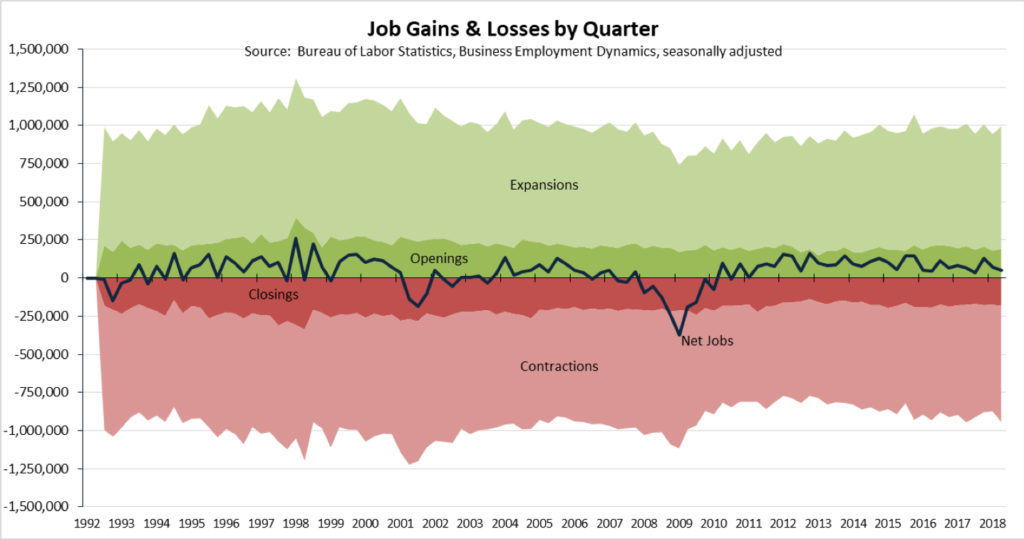
The job numbers reported each month in essence represent a net number measuring the increase or decrease in the stock of jobs. Underlying this number is considerable dynamism within the economy as establishments are opened and closed, and as some add jobs while others reduce as a result of seasonal, cyclical, and individual financial factors.
Data on these ebbs and flows is provided through the Business Employment Dynamics series. Drawing on the same employment tax filing reports as the Quarterly Census of Employment & Wages, this series reports on jobs from existing establishments that are expanding or contracting, and establishments that are opening or closing.
Note that establishment is not the same as a firm, as a firm may include one or multiple establishments that are co-located or that are located at different points around the state. The data also covers wage and salary private employment, and does not include self-employed workers, religious organizations, most agricultural workers on small farms, Armed Forces members, and other workers not covered by the Unemployment Insurance program.
Data for four components by quarter are summarized in the chart above for California, with the resulting Net Jobs shown by the blue line. The data indicates relatively greater churn in the economy during the 1990s as the economy responded to shifts in both housing and, following the loss of aerospace jobs, in manufacturing. Rising employment losses from establishment contractions combined with dips in expansions produced the jobs results seen in the two recessions occurring during the 2000s.
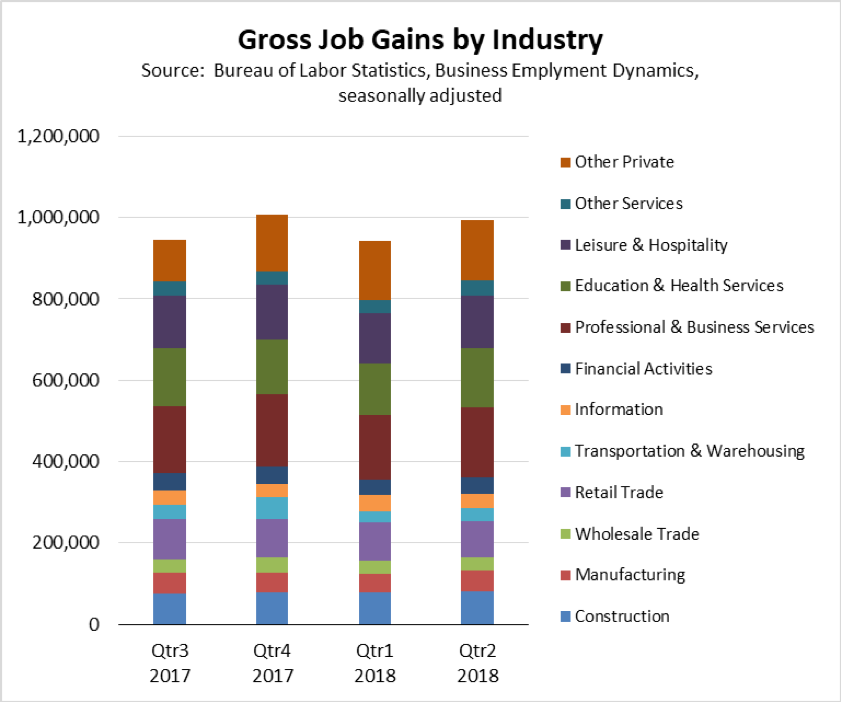
Gross job gains (openings and expansions) and losses (closings and contractions) by industry are shown in the charts below. Over the most recent four quarters available, gains were led by Professional & Business Services, Education & Health Services, and Leisure & Hospitality. With a change in order, losses were led by Professional & Business Services, Leisure & Hospitality, and Education & Health Services.
Openings and closings, however, do not cover the permanent movement of establishments into and out of the California economy. Both categories include a substantial element composed of temporary establishments, for example pop-up Christmas stores, summer food stands or farmers markets, and temporary insurance claims centers following disasters. Establishment formations and permanent closures are instead captured in the births and deaths data, which identify such establishments based on no filings within a prior multi-quarter period. This data identifies formation of new, ongoing firms and firm establishments as well as those that have been closed either as a result of movement to other states or permanent closure for business reasons.
This data is shown in the following tables for the related employment, expressed as the rate of births and deaths over the total employment base. While California is often touted as an innovator based on its growth of new businesses and industries, that dynamism as measured across the full economy is just slightly above the US average. Moreover, births are counterbalanced by a slightly higher rate of employment losses associated with establishment deaths as establishments are closed or moved out of the state.
Moreover, the California birth rate as with the national rate has declined since the 1990s. Excluding the volatility around the Dot.Com Bust, establishment openings contributed a quarterly average of 1.4% to the jobs base through the beginning of the century. Since 2008, the rate has averaged only 0.9%. And while the California results have been more volatile, the net rate (births minus deaths) has begun to approach the US level overall, with both the California and US averages at 0.1% per quarter since 2011.