Highlights for policy makers:
- COVID-19 and the State Economy: Most Recent Data
- COVID-19 and the State Economy: Early Indicators
- Recovery and Employment
- Unemployment Rises to 5.3%; Employment Drops by 512,600
- Labor Force Participation Rate Down at 61.8%
- Employment Growth Ranking
- Nonfarm Jobs Down 89,200
- Jobs Change by Industry
- Structural Shifts in State’s Economy
- Unemployment Rates by Region (not seasonally adjusted)
- Unemployment Rates by Legislative District (not seasonally adjusted)
- Employment Growth by Region
- MSAs with the Worst Unemployment Rates
COVID-19 and the State Economy: Most Recent Data
The potential effects on the state economy continue to expand as the emergency social distancing measures under Executive Order N-33-20 have now been extended “until further notice” but based on indications from the Governor’s Office, likely through at least May.
The March employment and jobs data just released by EDD are based on surveys done the week containing March 12 and consequently only begin to reflect the current economic situation stemming from the social distancing measures. A more complete accounting will first be seen in the April numbers scheduled for release on May 22.
The March numbers indicate jobs effects particularly in Arts, Entertainment & Recreation, Food Services, Accommodation, Other Services, and Retail Trade as many employers began shutting down a portion or all of their operations. These are largely mid- to lower wage jobs, and recovery of incomes within these households will rely heavily on removing barriers that could otherwise hinder a quick return to prior employment and income levels. Losses in Manufacturing and Wholesale Trade reflect continued disruptions in global supply chains that could prove a longer term drag for these industries.
Employment & Jobs Tracking
Source: US Bureau of Labor Statistics
COVID-19 and the State Economy: Early Indicators
The California and Federal WARN Acts require employers to give a 60-day notice prior to a facility closure or mass layoff. While the Governor has paused the associated penalties for not meeting the requirements, the requirements themselves remain in place. In March and through April 20, the total number of employees covered by these notices jumped to 251,395 with the highest concentrations continuing in Southern California.
While not covering all affected employees, the WARN Act notices serve two purposes as an early indicator. First, this data illustrates the geographic distribution of the current unemployment situation, as indicated in the table below.
Second, at least to date most of the notices continue to cite temporary layoffs or closures, indicating that as of now, most employers still anticipate returning to prior employment levels if they are financially able. This situation, however, will change as the closure period lengthens and as available cash flow in individual businesses is exhausted. Returning to prior employment numbers will become more difficult, especially if the economy’s restart is attempted under “business as usual” conditions of the state’s much higher operating costs.
The most recent April numbers indicate the beginning of a shift in this direction. While most notices continue to cover temporary layoffs, through April 20, 282 employers covering 16,294 employees indicated the closures and layoffs were permanent. As the closure period has lengthened and employer resources required to retain employees have shrunk, indications are beginning to appear of a second round of layoffs affecting some employees so far retained through remote work arrangements and as other businesses face reduced sales due to secondary effects from the first wave of closures.
Another more broadly based early indicator is through weekly initial claims for Unemployment Insurance (UI). Through the week ending April 11, California’s initial claims jumped to a cumulative 2,105,866 since the week of March 14. Continuing claims through the week of April 4 was equivalent to 7.4% of the labor force, although these numbers do not include unemployed among the state’s 2 million self-employed workers or longer term unemployed no longer receiving UI benefits. Many states’ programs remained unprepared to cope financially with the upsurge in claims, with some beginning to turn to the federal government for loans to maintain continuity.
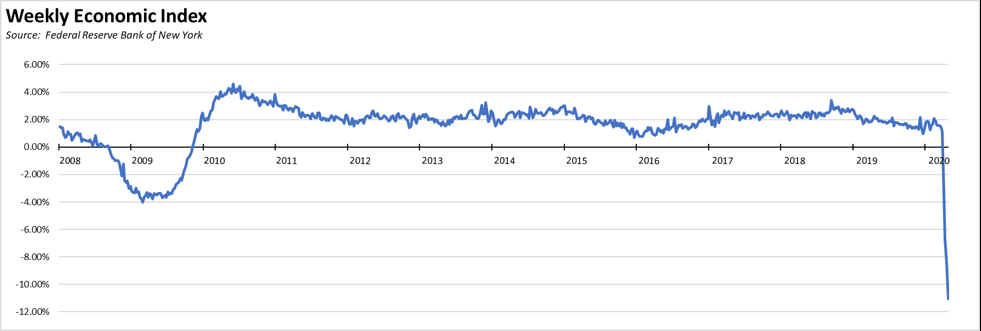
On the national level, the New York Federal Reserve Bank Weekly Economic Index attempts to track changes in the national economy as they are occurring, to provide economic estimates in advance of the official data series. The most current results indicate GDP would contract 11% on an annualized basis if current trends continue.
Recovery and Employment
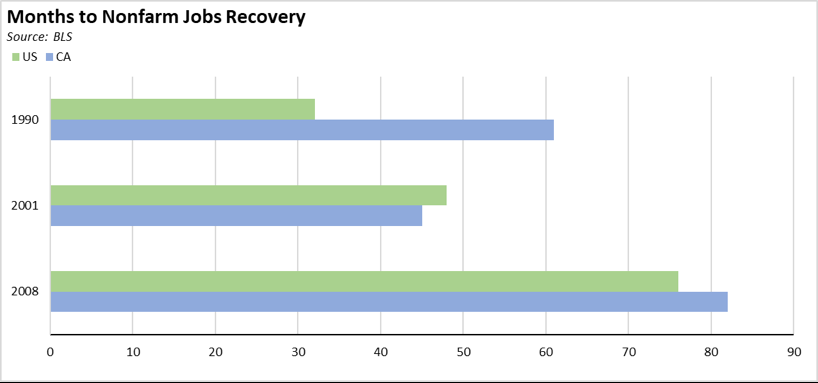
The recent recession that began in early 2008 is notable for having the longest recovery on record, but also one of the slowest. Looking at nonfarm wage and salary jobs growth, California took 82 months to return to the pre-recession high, compared to 45 months for the recession that began in 2001 and 61 months for the recession beginning in 1990. The length of the most recent recovery in part was affected by actions taken on both the federal and state levels to increase substantially costs to both households and employers during the economic downturn through expansion of regulations and higher taxes and fees, rather than the counter-recessionary actions typically taken to spur jobs and income growth. The long length of the recovery in California in the 1990s and at both levels after 2008 further reflect that these were more basic restructurings rather than a typical business cycle event.
The shape of the pending recovery in the current circumstances remains unknown. As the closure period extends, however, the risk of a lengthy recovery increases due to a contraction of financial resources in both households and businesses and the consequent effect on both business confidence and consumer expectations. Delay increases uncertainty, and uncertainty risks creating further delays in returning to normal levels of employment, income, investment, and consumption.
On an individual level, the length of unemployment also has substantial implications to future job, wage, and income potential. As unemployment lengthens, skills risk becoming outdated, and employability becomes affected. An analysis of long-term unemployment during the recent recession concluded that even maintaining part-time work enabled workers to return to full time positions at closer to the average or median wage within their industries, but those previously out of the labor force or only marginally attached faced lower wages upon their eventual return to work. The length of the recovery period can by itself become a factor in jobs potential and overall income inequality.
Recent reports from China indicate that while 91% of private businesses have resumed work, less than half of them are operating at above 50% capacity. When the recovery does finally take hold in California, it will be in a period when every other country will be seeking to recover lost economic ground as well.
Unemployment Rises to 5.3%; Employment Drops by 512,600
EDD reported total employment (seasonally adjusted; March preliminary) dropped 512,600 from the revised February numbers, while the number of unemployed rose by 260,800. The unemployment rate increased to 5.3%. The unadjusted rate was up 1.1 points from the year earlier to 5.6%.
California retained the 11th highest unemployment rate among the states.
Total US employment saw a seasonally adjusted loss of 2,987,000, with the number of unemployed rising by 1,353,000. The unemployment rate rose to 4.4%.
Figure Sources: California Employment Development Department; US Bureau of Labor Statistics
While the numbers show a substantial weakening of the employment situation from the current COVID-19 response measures, they do not necessarily reflect the full situation in March.
- As indicated earlier, the numbers are based on surveys conducted in the week containing March 12. Widespread layoffs both temporary and otherwise did not occur until the second half of the month. These are considered to some extent in the agency modeling, but not as fully as will be reflected in the April numbers.
- As indicated in our preliminary analysis last Friday, there were several technical factors affecting the March surveys. BLS estimates that combined, these factors underestimated the national unemployment figure by a full 1%. The California numbers are similarly affected but by an unknown amount.
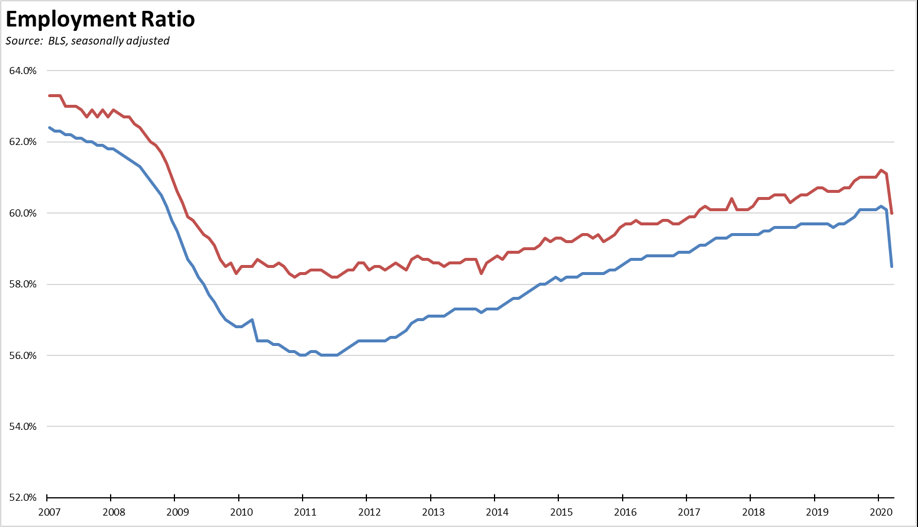
- California’s labor force participation rate dropped by nearly a full percent. The unemployment rate counts only persons actively looking for work, and does not account for movement in and out of the labor force. The employment ratio—determined by the number of employed divided by civilian population age 16 and over—is a more accurate measure of the current unemployment situation. To put these numbers in context, the chart below shows the seasonally adjusted California and US employment ratios since 2007. In the last recession, California reached a low point of 56.0% in 2010 and 2011, substantially below the US low of 58.2%.
Labor Force Participation Rate Down at 61.8%
California’s seasonally adjusted labor force participation rate was down at 61.8%. Nationally, the participation rate dropped to 62.7%.
For the 12 months ending March 2019, the seasonally adjusted data shows the California labor force was down 92,600 workers (-0.5% loss) compared to the rest of the US gain of 70,600 (+0.0%).
Employment Growth Ranking
The total number of persons employed (seasonally adjusted) over the 12 months ending in March shrank by 293,700. California had the lowest level in terms of absolute employment growth over the year, with 23 other states showing a loss for this period.
Adjusted to account for differences in the size of each state economy, California over the year showed a 1.6% contraction, below the average for the rest of the US with a loss of 0.5%. Ranked among the states, California’s growth rate dropped to 45th highest.
Figure Source: US Bureau of Labor Statistics
Nonfarm Jobs Down 89,200
Nonfarm jobs (seasonally adjusted) dropped 89,200 as February’s seasonally adjusted gains were revised to 21,000 from the previously reported 29,000.
Even with the March decline, for the 12 months ending March, total jobs growth for California was 210,700, with the state’s rank returning to 2nd place behind Texas which gained 250,900 jobs. These numbers, however, likely reflect a continuing shift in employment status from self-employment and independent contractor to wage & salary under the terms of last year’s AB 5, as suggested in the continuing gap between household and establishment surveys. The jobs numbers from other states indicate creation of new jobs. The California data is far more mixed with a high degree of job reclassification due to state rules rather than underlying economic dynamics. This legislation will continue to affect the jobs numbers as well as contribute to the uncertainty faced by both employers and workers during the current emergency and the upcoming recovery period.
Adjusting for population size, California was 16th among the states, with a 12-month jobs growth rate of 0.9% compared to the rest of the US at 1.4%.
Figure Sources: California Employment Development Department; US Bureau of Labor Statistics
Jobs Change by Industry
In the unadjusted numbers that allow a more detailed look at industry shifts, hiring saw declines in 8 industries over the year.
Gains in payroll jobs were led by Government, Health Care, and Transportation & Warehousing. Declines were led by Food Services, Arts, Entertainment & Recreation, and Manufacturing.
| Not Seasonally Adjusted Payroll Jobs (1,000) | Mar 2020 | 12-month change | Nonfarm Growth Rank |
|---|---|---|---|
| Total Farm | 360.5 | 9.9 | |
| Mining & Logging | 22.2 | 0.5 | 13 |
| Construction | 864.7 | 3.9 | 10 |
| Manufacturing | 1,304.5 | -14.9 | 19 |
| Wholesale Trade | 687.2 | -6.6 | 16 |
| Retail Trade | 1,626.8 | -11.3 | 18 |
| Utilities | 57.0 | 0.8 | 12 |
| Transportation & Warehousing | 650.7 | 31.0 | 3 |
| Information | 592.0 | 28.7 | 5 |
| Finance & Insurance | 547.1 | 11.4 | 7 |
| Real Estate & Rental & Leasing | 306.4 | 9.9 | 9 |
| Professional, Scientific & Technical Services | 1,349.0 | 29.9 | 4 |
| Management of Companies & Enterprises | 252.7 | -3.0 | 15 |
| Administrative & Support & Waste Services | 1,117.2 | 2.9 | 11 |
| Educational Services | 406.2 | 11.2 | 8 |
| Health Care | 1,605.6 | 34.0 | 2 |
| Social Assistance | 856.8 | 26.7 | 6 |
| Arts, Entertainment & Recreation | 305.0 | -16.7 | 20 |
| Accommodation | 232.0 | -1.4 | 14 |
| Food Services | 1,430.5 | -25.4 | 21 |
| Other Services | 563.8 | -6.9 | 17 |
| Government | 2,674.8 | 38.3 | 1 |
| Total Nonfarm | 17,452.2 | 143.0 | |
| Total Wage & Salary | 17,812.7 | 152.9 | |
Figure Source: California Employment Development Department
Structural Shifts in State’s Economy
Comparing current job numbers to the pre-recession levels in 2007 illustrates the structural shift in the state’s economy, with the primary jobs shift to the higher and lower wage industries, with weakness in the higher wage blue collar industries except for Transportation & Warehousing. The likelihood of additional structural shifts from the current crisis will largely depend on the shape and speed of the upcoming recovery period and the extent to which existing cost barriers are continued or made worse.
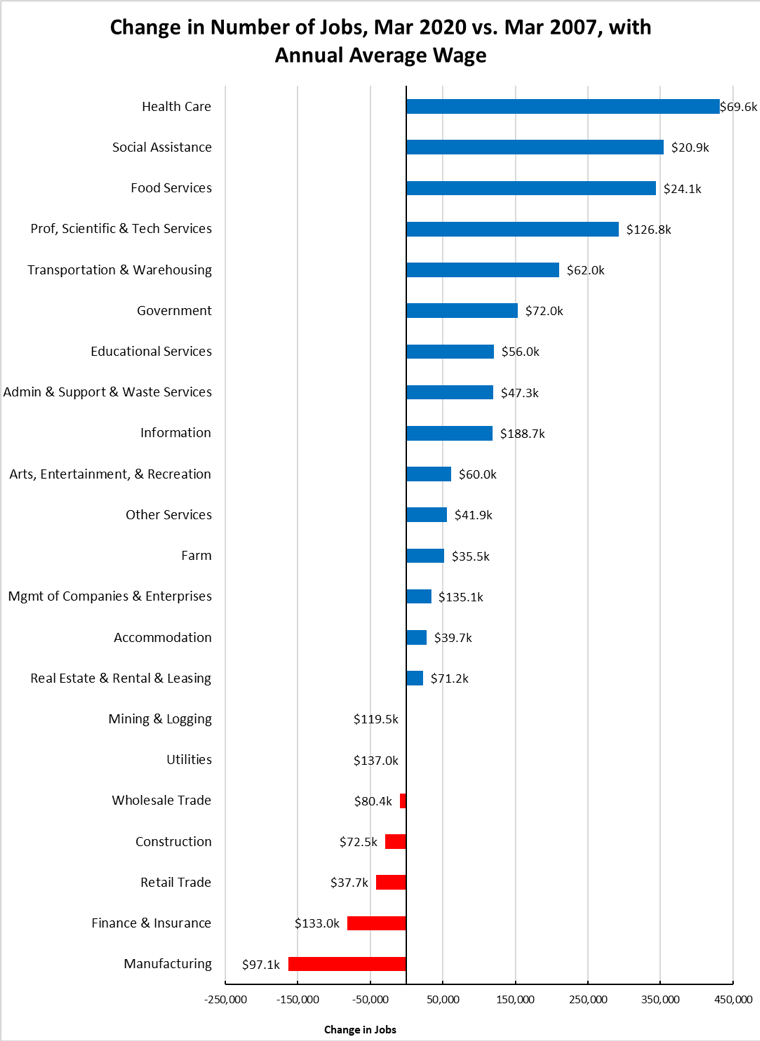
Figure Source: California Employment Development Department
Unemployment Rates by Region (not seasonally adjusted)
| wdt_ID | Region | Unemployment Rates |
|---|---|---|
| 1 | California | 5.6 |
| 2 | Bay Area | 3.5 |
| 6 | Orange County | 3.6 |
| 10 | Sacramento | 4.7 |
| 14 | San Diego/Imperial | 4.8 |
| 18 | Inland Empire | 5.1 |
| 22 | Central Sierra | 5.7 |
| 26 | Los Angeles | 6.2 |
| 30 | Upstate California | 7.8 |
| 34 | Central Coast | 8.5 |
| 38 | Central Valley | 10.8 |
Figure Source: California Employment Development Department
Unemployment Rates by Legislative District (not seasonally adjusted)
The legislative district data has been revised to incorporate the county labor force updates and the 2018 American Community Survey factors. The full estimates are now available on the Center’s web site.
Lowest
| wdt_ID | Congressional District | Unemployment Rate |
|---|---|---|
| 1 | CD12 (Pelosi-D) | 2.8 |
| 2 | CD18 (Eshoo-D) | 2.9 |
| 3 | CD14 (Speier-D) | 3.1 |
| 4 | CD17 (Khanna-D) | 3.1 |
| 5 | CD15 (Swalwell-D) | 3.2 |
| 6 | CD52 (Peters-D) | 3.2 |
| 7 | CD49 (Levin-D) | 3.1 |
| 9 | CD48 (Rouda-D) | 3.3 |
| 10 | CD45 (Porter-D) | 3.4 |
| 12 | CD19 (Lofgren-D) | 3.8 |
| wdt_ID | Senate District | Unemployment Rate |
|---|---|---|
| 1 | SD13 (Hill-D) | 2.6 |
| 2 | SD11 (Wiener-D) | 3.1 |
| 3 | SD36 (Bates-R) | 3.2 |
| 4 | SD37 (Moorlach-R) | 3.3 |
| 5 | SD39 (Atkins-D) | 3.4 |
| 6 | SD10 (Wieckowski-D) | 3.3 |
| 7 | SD07 (Glazer-D) | 3.7 |
| 8 | SD15 (Beall-D) | 3.5 |
| 9 | SD34 (Umberg-D) | 3.9 |
| 10 | SD38 (Jones-R) | 3.9 |
| wdt_ID | Assembly District | Unemployment Rate |
|---|---|---|
| 1 | AD22 (Mullin-D) | 2.5 |
| 2 | AD16 (Bauer-Kahan-D) | 2.6 |
| 3 | AD24 (Berman-D) | 2.8 |
| 4 | AD17 (Chiu-D) | 3.0 |
| 5 | AD28 (Low-D) | 2.8 |
| 6 | AD19 (Ting-D) | 3.2 |
| 7 | AD25 (Chu-D) | 3.1 |
| 8 | AD78 (Gloria-D) | 3.1 |
| 9 | AD73 (Brough-R) | 3.1 |
| 10 | AD77 (Maienschein-R) | 3.3 |
Highest
| wdt_ID | Congressional District | Unemployment Rate |
|---|---|---|
| 5 | CD44 (Barragan-D) | 8.7 |
| 7 | CD51 (Vargas-D) | 9.9 |
| 8 | CD09 (McNerney-D) | 7.5 |
| 9 | CD16 (Costa-D) | 12.9 |
| 12 | CD21 (Cox-D) | 13.9 |
| 13 | CD10 (Harder-D) | 7.8 |
| 15 | CD40 (Roybal-Allard-D) | 7.6 |
| 17 | CD20 (Panetta-D) | 10.2 |
| 18 | CD23 (McCarthy-R) | 10.8 |
| 19 | CD22 (Nunes-R) | 10.2 |
| wdt_ID | Senate District | Unemployment Rate |
|---|---|---|
| 1 | SD14 (Hurtado-D) | 15.4 |
| 2 | SD12 (Caballero-D) | 11.3 |
| 3 | SD33 (Gonzalez-D) | 7.3 |
| 4 | SD24 (Durazo-D) | 7.1 |
| 5 | SD05 (Galgiani-D) | 8.0 |
| 6 | SD08 (Borgeas-R) | 8.3 |
| 7 | SD30 (Mitchell-D) | 7.3 |
| 8 | SD16 (Grove-R) | 9.7 |
| 11 | SD35 (Bradford-D) | 7.5 |
| 12 | SD40 (Hueso-D) | 8.5 |
| wdt_ID | Assembly District | Unemployment Rate |
|---|---|---|
| 1 | AD13 (Eggman-D) | 8.9 |
| 2 | AD29 (Stone-D) | 8.5 |
| 6 | AD30 (Rivas-D) | 8.7 |
| 7 | AD23 (Patterson-R) | 9.2 |
| 9 | AD34 (Fong-R) | 9.7 |
| 10 | AD56 (Garcia-D) | 11.4 |
| 13 | AD26 (Mathis-R) | 14.1 |
| 14 | AD32 (Salas-D) | 14.3 |
| 15 | AD31 (Arambula-D) | 12.9 |
| 16 | AD21 (Gray-D) | 11.6 |
Employment Growth by Region
Containing 19.5% of the state’s population, the Bay Area now accounts for 47.3% of net employment growth compared to pre-recession levels. Los Angeles Region, with 28.9% of the population, dropped to 5.2%.
While these numbers continue to reflect the outsized contribution of the Bay Area to the state’s economic performance over the past several years, they also now begin to illustrate the regional disparity in the effects of the current social distancing measures. Bay Area jobs particularly within tech are more amenable to remote work alternatives, and overall employment has so far been affected to a lesser degree. Southern California particularly with its high Information and tourism components has fewer such opportunities due to the nature of these jobs. Inland Empire with its concentration of warehousing and logistics jobs remains an area with a higher percentage of essential workers.
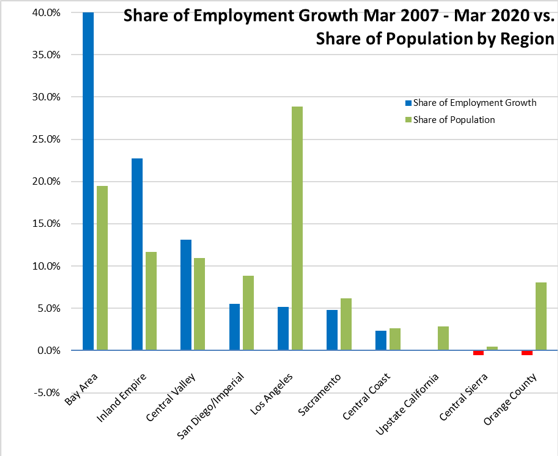
Figure Source: California Employment Development Department; Department of Finance
MSAs with the Worst Unemployment Rates
Of the 21 Metropolitan Statistical Areas (MSAs) with the worst unemployment rates in February 2019, 12 are in California, including El Centro MSA (Imperial County) which continues with Great Depression-era levels of unemployment that are 7 times worse than in San Mateo, the county with the lowest unemployment rate.
| wdt_ID | MSA | Unemp. | Rank |
|---|---|---|---|
| 1 | El Centro MSA | 17.1 | 389 |
| 2 | Visalia-Porterville MSA | 11.5 | 386 |
| 3 | Merced MSA | 10.4 | 385 |
| 4 | Salinas MSA | 10.0 | 384 |
| 5 | Hanford-Corcoran MSA | 9.8 | 383 |
| 6 | Bakersfield MSA | 9.1 | 382 |
| 7 | Fresno MSA | 8.5 | 381 |
| 8 | Madera MSA | 8.1 | 378 |
| 9 | Yuba City MSA | 8.1 | 378 |
| 10 | Stockton-Lodi MSA | 6.6 | 372 |
| 11 | Modesto MSA | 6.6 | 372 |
| 12 | Santa Cruz-Watsonville MSA (4-way-tie) | 6.4 | 368 |
Figure Source: US Bureau of Labor Statistics, February 2020 data