Highlights for policy makers:
- COVID-19 and the State Economy
- Nonfarm Jobs: 296k Below Pre-Covid Peak
- Jobs Change by Industry
- Employment 536k Below Pre-Covid Level
- Unemployment Insurance Initial Claims Edge Above Pre-Pandemic Average in California
- Labor Force Participation Rate
- Unemployment Rates by Legislative Districts
- Unemployment Rates by Region
- Employment Recovery by Region
- MSAs with the Worst Unemployment Rates
COVID-19 and the State Economy
As discussed in our preliminary analysis, the numbers for March again show mixed results. Nonfarm jobs slowed substantially from February, essentially returning to the relatively stable average seen in the period October through January. Even if continued at this level, however, jobs would be on course to surpass the pre-pandemic peak towards the end of the year.
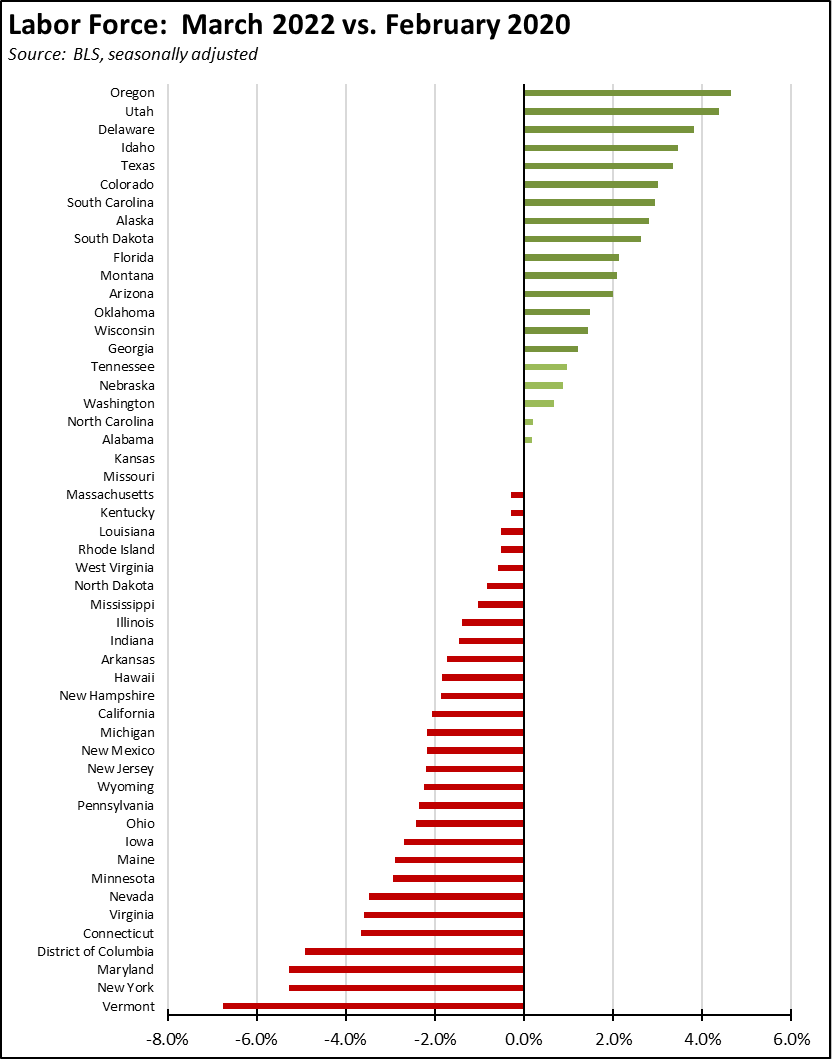
Employment showed stronger numbers but continued to mostly offset the employment declines shown in the last two months of 2021. In all, monthly employment gains averaged about 5,000 less than job gains over the past 6 months, yet another indication that the recovery has yet to bring workers back into the labor force at levels required to sustain the expansion and offset the downward pressures on long-term income prospects seen in the pervasive long-term unemployment during the previous recovery from the Great Recession. While California ranks better on this metric than other recovery measures, 22 other states have already surpassed the pre-pandemic February 2020 labor force numbers.
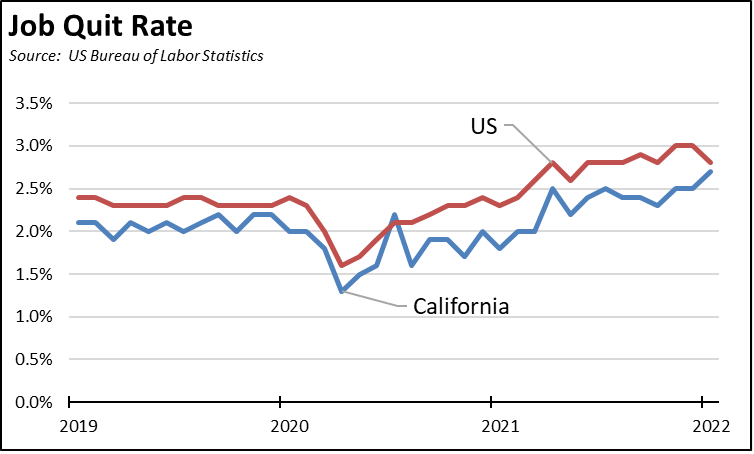
The lag in the employment numbers also reflects increasing churn within the job numbers as more workers quit their jobs in order to move to others paying higher wages and/or benefits. While this activity reflects a long-term wage strategy typically pursued by workers, the current and ongoing labor shortages have elevated the opportunities to do so. Measured by the job quit rate from the Job Openings and Labor Turnover Survey data, California has been behind the rest of the country in this trend.
This outcome is consistent with the findings in our detailed studies of economic mobility and lower-wage workers in California. That analysis indicated that lower-wage workers are strongly aware of opportunities to increase their incomes, both by changing jobs and by increasing their skills level to do so with stronger wage gains. However, they also have a strong risk aversion to acting on these opportunities due to the high and constantly growing costs of living in this state. They have difficulty in meeting the growth in their monthly expenses with their current jobs and indicated concerns over the negative results coming from making the wrong job choice. With constantly increasing cost pressures, the wrong decision risked not just a temporary setback but putting them into an economic hole from which it would be difficult to recover.
The current inflationary pressures likely exacerbate these risks for lower-wage workers along with California-specific drivers increasing energy and housing costs well beyond the national levels. Wider and now likely sustained telecommuting opportunities lessen these risks for higher-wage workers and in fact counter the risks by enabling them to lower the costs of living particularly by moving to lower housing costs both within California and to other states. The flip side, however, is that this trend coming from the upper reaches of the wage scale is also spreading coastal-scale housing prices and rents to the rest of the state and other parts of the country, exacerbating the costs pressures faced on the lower ends.
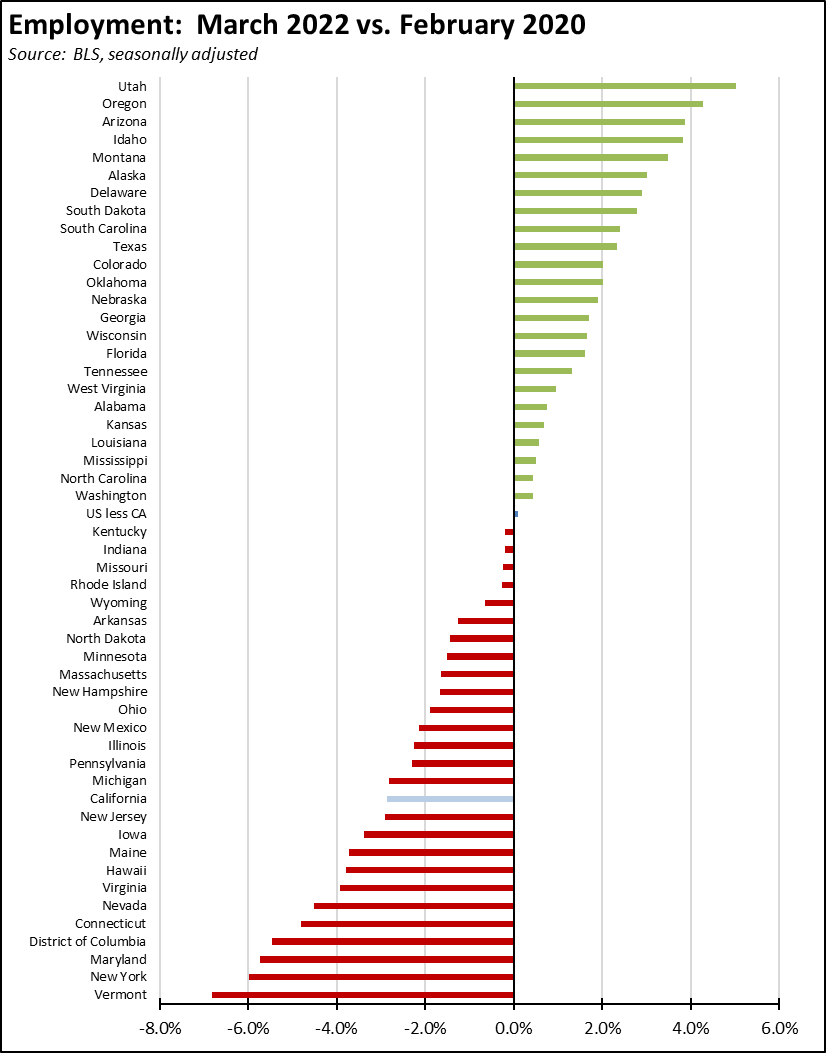
In all, 24 states now show employment levels above the February 2020, pre-pandemic level. Even with the stronger March numbers, California’s rank changed only marginally, going from 42nd to 41st on this measure.
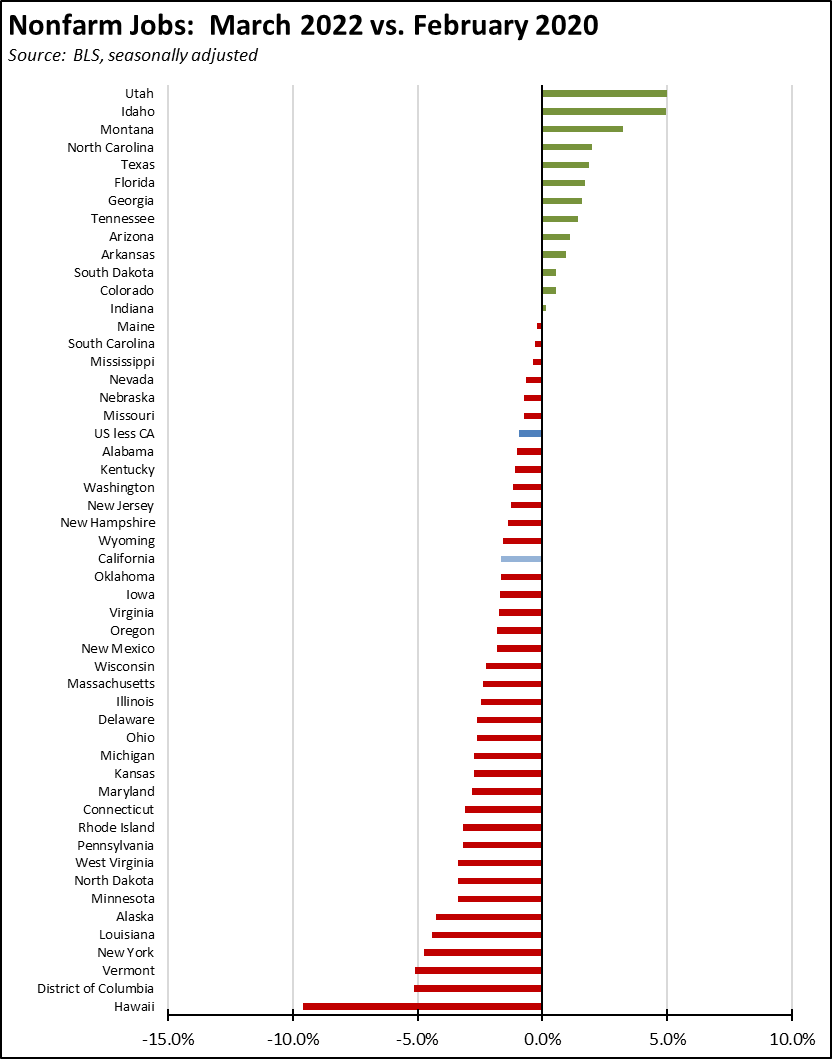
For nonfarm jobs, the number of states exceeding the pre-pandemic level edged up to 13 from 12 in February. California’s rank by this measure rose from 30th to 27th.
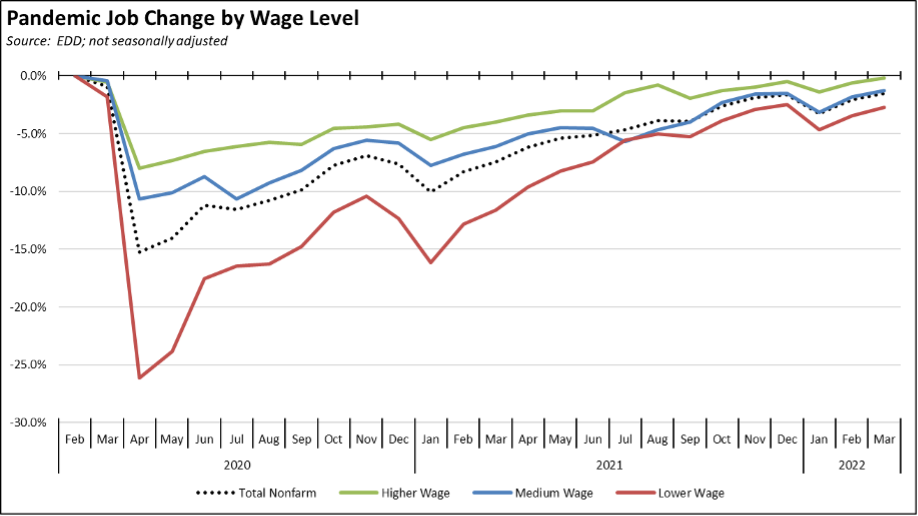
Using the unadjusted numbers, jobs by wage level continued to show the same pattern of recovery as previously reported, but with the higher wage industries now just 0.2% short of the pre-pandemic level. Medium wage industries continue to track the overall jobs change led by growth in Transportation & Warehousing. Lower wage industries continued their recent trend but were still 2.7% below.
In the chart, higher-wage jobs are those industries with average annual wages above $100,000; medium wage is $50,000 to $100,000; and lower-wage is below $50,000. Job data is drawn from the industry classifications, unadjusted job numbers, and wage levels generally used in the regular report section below on Nonfarm Jobs.
CaliFormer Businesses: Update
Additional CaliFormer companies identified since our last monthly report are shown below. Companies listed below include those that have announced: (1) moving their headquarters or full operations out of state, (2) moving business units out of state (generally back office operations where the employees do not have to be in a more costly California location to do their jobs), (3) California companies that expanded out of state, and (4) companies turning to permanent telework options, leaving it to their employees to decide where to work and live. The list is not exhaustive but is drawn from a monthly search of sources in key cities.
| wdt_ID | Companies | From | To | Reason | Source | Year |
|---|---|---|---|---|---|---|
| 167 | Anduril Industries | Costa Mesa | Atlanta | Expansion | Read More | 2022 |
| 168 | Applied Materials | Santa Clara | Texas | $2 billion R&D center | Read More | 2022 |
| 169 | Ares Prism | Burlingame | Chicago | HQ move | Read More | 2022 |
| 170 | Astronics Test Systems | Irvine | Florida | HQ move | Read More | 2022 |
| 171 | Bella+Canvas | Beverly Hills | Alabama | Manufacturing expansion | Read More | 2021 |
| 172 | Better Bath Better Body | San Diego | Kentucky | HQ and manufacturing move | Read More | 2022 |
| 173 | Black Dog Venture Partners | San Francisco | Florida | HQ move | Read More | 2022 |
| 174 | Cookies LLC | San Diego | Florida | Florida HQ/expansion | Read More | 2022 |
| 175 | Electriq Power | San Leandro | Florida | HQ move | Read More | 2022 |
| 176 | Hack EDU | Santa Monica | Pennsylvania | HQ move | Read More | 2022 |
| Companies | From | To | Reason | Source | Year |
Nonfarm Jobs: 296k Below Pre-Covid Peak
Nonfarm wage and salary jobs were up 60,200 (seasonally adjusted) in March, while gains in February were revised down 2,700 to 135,400.
California showed the largest monthly increase, followed by Texas at 30,100 and New York at 28,100. The number of states above the February 2020 pre-pandemic peak increased from 12 to 13. California remains 295,500 behind or 18.7% of the remaining national shortfall.
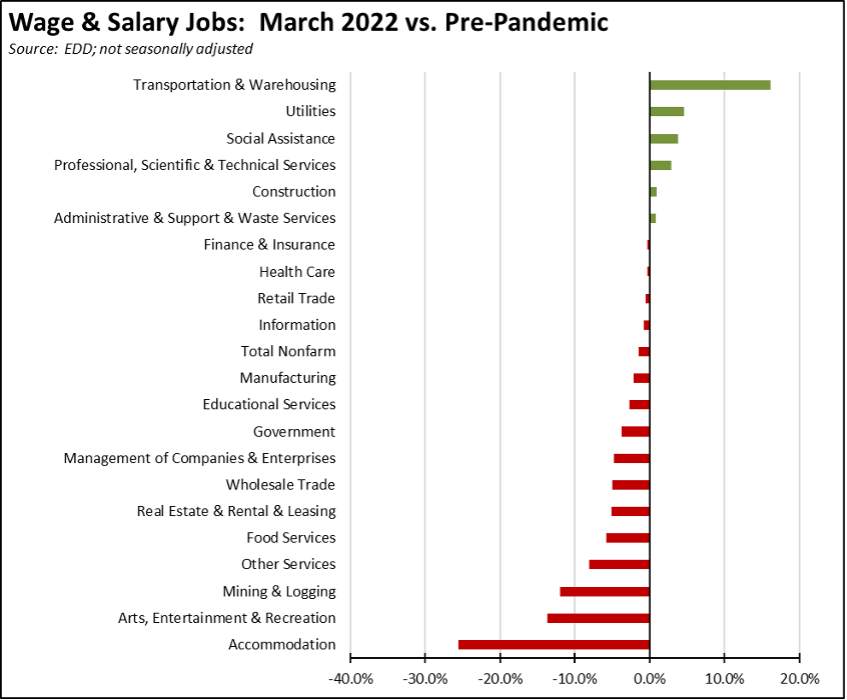
Jobs Change by Industry
Using the unadjusted numbers that allow a more detailed look at industry shifts, the number of industries showing job levels at or exceeding the pre-pandemic February 2020 levels based on the revised data remained at 5. Transportation & Warehousing by a substantial margin shows the strongest growth as companies continue to battle the ongoing supply chain disruptions. The biggest lags in recovery continue to be the lower-wage industries that were hardest hit by the state-ordered closures along with Mining & Logging that is being targeted for job losses under current state policies.
Employment 536k Below Pre-Covid Level
EDD reported that employment (seasonally adjusted; March preliminary) was up 141,400 from the revised February numbers. The number of unemployed was down 78,300.
The reported unemployment rate improved 0.4 point to 4.9%, compared to the revised 4.1% in February 2020 prior to the pandemic. California was tied with Pennsylvania for the fifth highest unemployment rate among the states. California contained 15.7% of the total number of unemployed workers in the US.
In the national numbers, total US employment rose 736,000, and the number of unemployed was down by 318,000. The reported unemployment rate improved 0.2 point to 3.6%, further closing in on the 3.5% rate recorded in February 2020.
Figure sources: California Employment Development Department; US Bureau of Labor Statistics
In the seasonally adjusted numbers, California employment remains 536,300 (2.9%) below the pre-pandemic level in February 2020; the rest of the states combined were essentially at this recovery level.
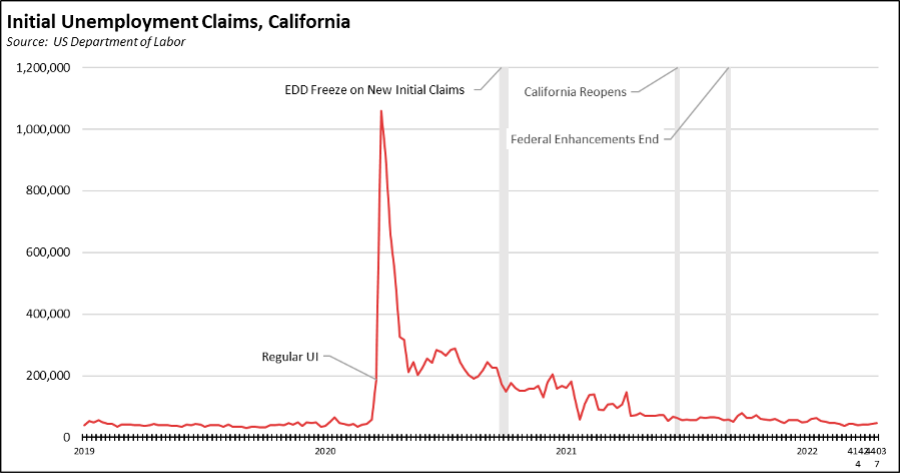
Unemployment Insurance Initial Claims Edge Above Pre-Pandemic Average in California
For the 4 weeks ending with the week of April 9, average initial claims in California were 9% above the pre-pandemic average in 2019, after being essentially at the 2019 level in the prior 4 weeks. For the US, average claims remained below pre-pandemic. For the 4 weeks ending with the week of April 9, California claims were 22% of the national total, while insured unemployment (a proxy for continuing claims) through the week of April 2 was 24% of the total.
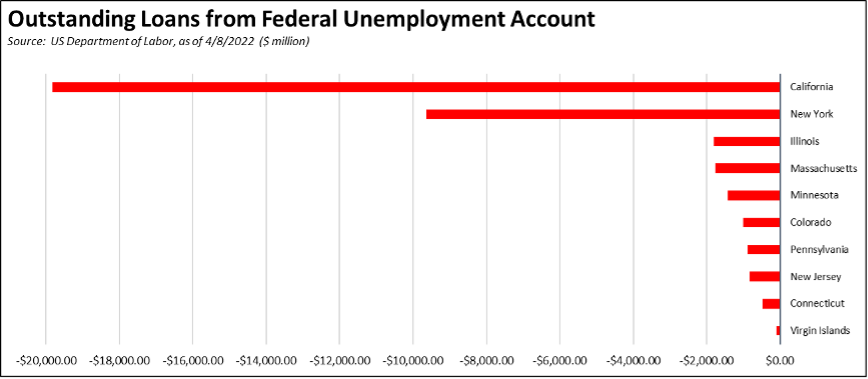
As of April 8, California’s unemployment insurance fund debt was $19.8 billion, or 54% of the total owed by all the states and territories.
As shown in the following chart, the state fund in the prior, Great Recession plunged to a debt level only about half of the debt currently expected for the end of 2022. Due to the shallow recovery in that period, the fund took over 9 years to return to a positive balance, a position it held only shortly before sinking even lower as the result of the state’s reliance on this benefit along with the federal enhancements as the primary offset to the state’s job closures. Note that in the chart, monthly amounts are available through May 2020, with the subsequent points the annual end-year levels from EDD’s October 2021 projections.
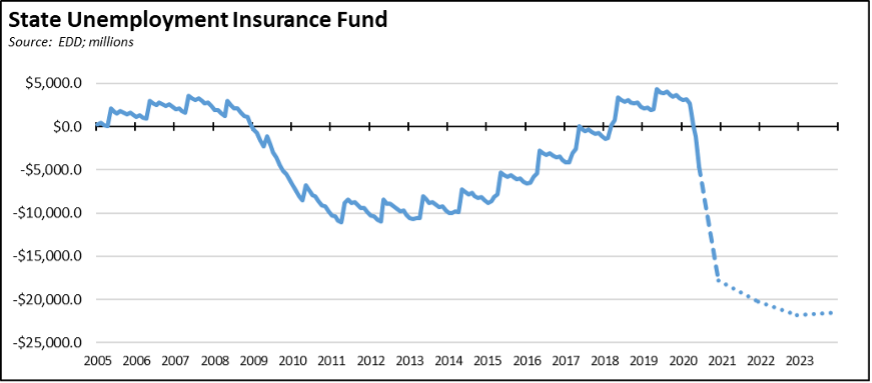
California is facing a similar set of circumstances today. The March numbers indicate a slowing in the job gains that are essential to rebuilding the state fund, at less than half the number reported in February and returning to the levels seen in the last 4 months of 2021. At the national level, as the rest of the nation by some measures has returned to full employment, the national focus has now shifted quickly to the rapidly rising inflation levels. This shift along with concerns related to rising energy costs, the war in Ukraine, and continuing supply disruptions now made worse by renewed lockdowns in China have also raised new questions about whether the US is about to experience another round of recession.
Other states are far better prepared for such an eventuality. The federal pandemic assistance bills provided funds that could be used to pay off accumulated unemployment insurance debts, including the most recent, ARPA, which specifically cited such payments as an allowable use, both to retire federal debt and to bring state fund balances back to their pre-pandemic level. Other states used this option to restore the fiscal health of their funds while minimizing new tax levels that otherwise would dampen their recovery progress. California’s fund remains the least prepared for the next recession.
Labor Force Participation Rate
The labor force participation rate edged up 0.3 point to 61.8%, while the US number was up 0.1 point to 62.4%. The California rate remains well below the pre-pandemic level of 62.8%, which in turn was down substantially from prior years. Accounting for workers leaving the workforce since February 2020 under the revised data, there were an estimated 1.3 million out of work in March.
Unemployment Rates by Legislative Districts
The highest and lowest estimated unemployment rates in March are shown below. The estimates are for the current, 2012 vintage districts. Estimates for the new districts under the 2022 redistricting will be released after the required factors from the American Community Survey become available at the end of the year.
Lowest
Highest
Unemployment Rates by Region
Unemployment rates (not seasonally adjusted) compared to pre-pandemic February 2020 are shown below.
Figure Source: California Unemployment Development Department
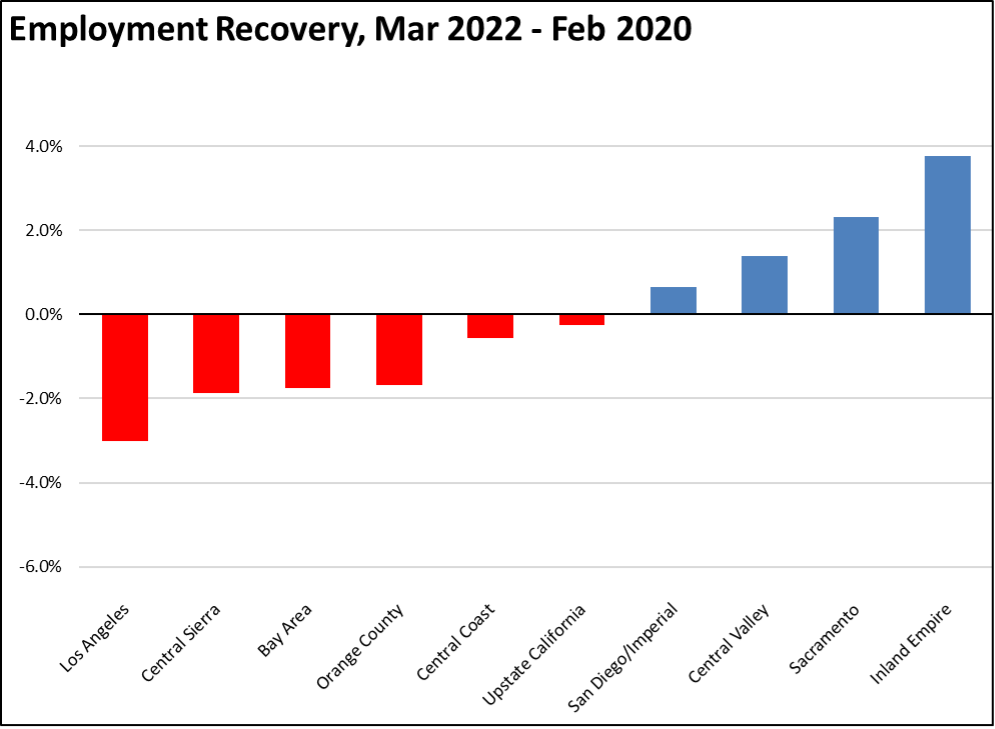
Employment Recovery by Region
In part reflecting migration patterns during the pandemic, the interior regions of the state plus San Diego show employment above pre-pandemic levels. Los Angeles, which saw some of the deepest job losses due to its increasing incidence of lower-wage service jobs, remains the furthest behind.
MSAs with the Worst Unemployment Rates
California again had 11 of the MSAs among the 25 regions with the worst unemployment rates in February, including El Centro MSA (Imperial County) with the worst unemployment rate in the nation. Los Angeles-Long Beach-Anaheim MSA remained out of this group by rising to #293 in a tie with 3 MSAs in other states. The best performing California urban region was again San Jose-Sunnyvale-Santa Clara MSA tied with 15 other MSAs at #76, with an unemployment rate of 3.0% compared to the best performing MSA, Elkhart-Goshen, IN MSA at 1.7%.