Key Highlights for Policy Makers:
- Unemployment Down to 7.6% but Two-Tiered Recovery Persists
- Labor Force Participation Rate Remains Weak
- Middle Class Jobs Still Below Pre-Recession Levels
- Updated Trade Data Shows Exports up 7.5% Over 2013
- California Maintains Lead for Total Trade through US Ports
Unemployment Down to 7.6% but Two-Tiered Recovery Persists
Change shown below is from May 2014 (seasonally adjusted; California preliminary), with the change from the prior month:
The related not seasonally adjusted numbers (California preliminary), with the change from May 2013:
California Employment Development Department’s (EDD) latest release shows generally continued improvement in the state’s labor force statistics. Total employment continues to improve in line with the national numbers. California’s unemployment rate of 7.6% (seasonally adjusted) is the lowest it has been since Q3 2008.
The total number of unemployed actually increased 42,300 from Q3 2008; the decline in the unemployment rate stems in large part from the drop in the labor force participation rate by 3.7 percentage points from Q3 2008 to 62.3% in May 2014 (seasonally adjusted). California’s unemployment rate is 21% higher than the national rate, and is the 5th highest among the states, ahead of Kentucky (7.7%), Mississippi (7.7%), Nevada (7.9%), and Rhode Island (8.2%).
Two-Tiered Economic Recovery Persists
Unemployment rates and employment (all data is not seasonally adjusted) continue to vary widely across the state. Unemployment rates dropped in all regions except Los Angeles.
By County:
By Legislative District:
Labor Force Participation Rate Remains Weak
While employment has increased and number of unemployed decreased in the latest employment data, the labor force has remained virtually unchanged, resulting in a continuing weakening of the labor force participation rate over the past 6 years. The not seasonally adjusted rate improved marginally from last month’s 38-year low, and the seasonally adjusted rate remained unchanged.
Declining labor force participation is not just a factor affecting California. Both this state and the US as a whole saw declining rates shortly after the beginning of the 2008 recession. California’s decline, however, has been steeper and has been inversely responsive to the generally improved employment numbers over the past year.
People leave the labor force for many reasons, but key among these is the lack of adequate job opportunities commensurate with their training, skills, and pay expectations. Others have suggested that causes such as the aging of the workforce may also be playing a role, but the demographic data suggests that this factor should instead be contributing to California’s favor. As shown in the table below, California has a higher percentage of working-age population, either measured by 16 to 64 years old or 18 to 64 years old. The share of population 65 and older is also smaller, reflecting both the younger immigrant population and the fact that many retirees similarly are affected by the high direct and transactions costs of living in California and chose to move elsewhere.
California’s participation rate has plunged in the last three recessions, and took between 5 to 8 years to return to national levels in the first two occurrences. In the current situation, however, the continuing weakness in middle class job creation providing wages above the opportunity costs associated with non-employment is likely a contributing factor as well.
These differences are not insignificant. On a seasonally adjusted basis, the gap between the current and pre-recession (May 2007) California rate is 3.3%–this translates into almost one million people or an amount that is larger than the entire labor force of 14 states. This gap has also contributed to the slow pace of economic recovery as a result of lower consumption, investments, and tax base along with higher public costs for social services.
Middle Class Jobs Still Below Pre-Recession Levels
Job growth (not seasonally adjusted) continued its positive trend over the past 12 months for most industries except Farm, Manufacturing, and Finance and Insurance. Compared to the pre-recession 2007 annual average, Total Nonfarm jobs increased 75,600. In this same period, however, total population in California increased an estimated 1.7 million people.
2014 – May 2013 Change May
2014 – 2007 ave
Jobs growth continues to be concentrated in the higher wage (Professional, Scientific and Technical Services) and lower wage (Accommodation and Food Service) industries. About 12 percent of Total Nonfarm growth comes from Individual & Family Services, the industry containing the IHSS (In Home Supportive Services) employment numbers added by EDD in their March 2014 revision. Even with improvement in Construction, that middle class job sector remains 229,800 below the 2007 average of 892,600. Other industries still below their 2007 pre-recession level are Manufacturing, Finance and Insurance, Retail Trade, Real Estate and Rental and Leasing, Information, Wholesale Trade, and Government.
Updated Trade Data Shows Exports up 7.5% Over 2013
Trade data in the Center’s Economic Indicators has been revised to provide more timely (monthly) reports on trade activities within the California economy. Obtained from the US Census Bureau, data is organized under two broad indicators:
- Exports and Imports.This trade data shows the level of export shipments originating in California (Origin of Movement Exports) and the level of imports (State of Destination Imports) delivered within the state. Note that this data is not the same as exports produced and imports used or consumed within the state as some level of shipment consolidation occurs within both flows, as is the case with any other trade gateway state. This consideration aside, this trade data reflects the relative growth of California industries directly engaged in production related to export and import markets, along with other industries engaged in the trade and shipments of these products.
As an illustration of the consolidation factor, the US Census Bureau also maintains a separate data series showing the amount of manufacturing shipments within each state produced for export. This data is more limited, but as shown in the table below, on average, about 81.6% of California’s manufacturing exports were produced in the state during the period 2009-2011, with the remainder shipped into the state from other locations and consolidated for export. By comparison, the figure for Texas during this period is comparable but slightly higher at 86.4%.California Manufacturing Export Production Compared to Manufacturing Exports
2009 2010 2011Production: Export Related Shipments $89,476,700,000 $96,762,200,000 $112,869,600,000Origin of Movements Mfg Exports $104,763,044,064 $124,571,688,431 $137,955,826,567In-state Production as % of Exports 85.4% 77.7% $112,869,600,000Sources: US Census Bureau, USA Trade Online; US Census Bureau, Exports From Manufacturing -
Trade through California Ports. Trade through California Ports. In addition to jobs within various industries directly tied to export and import markets, another important jobs center within the California economy stems from the state’s comparative advantages as the nation’s gateway for growing trade with Pacific Rim countries. This jobs center is particularly important as a continuing source of middle class jobs, including blue collar jobs directly engaged in goods movement and white collar jobs in related services. This Indicator tracks the value of exports plus imports shipped through the states ports, both for goods within the state and goods for other states shipping through California.
Exports Up 7.5% Over 2013
In April 2014, California exports were up 7.5% compared to April 2013. Using a comparison based on the same month in the prior year, exports have shown positive growth in 11 of the last 12 months.
California imports were up 5.3% in April. Imports have shown positive growth in 10 of the last 12 months.
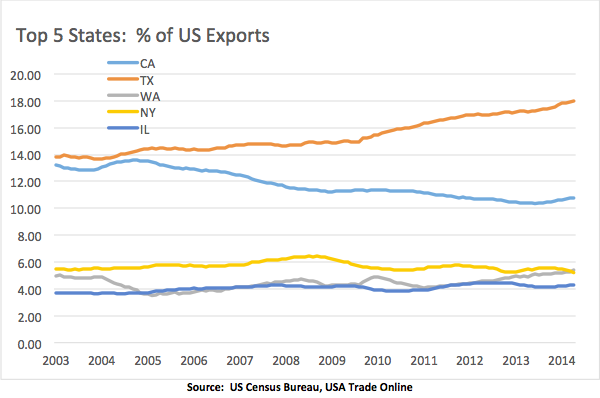
Measured by value, California remains the second leading exporting state, with Texas growing in importance over the past decade. Over the past 10 months of positive growth, California’s share of total US exports has increased by 0.42 percentage points to 10.77%. Texas in the same period increased its share by 0.50 percentage points to 17.97%. The chart below shows the share of total US exports represented by each of the Top 5 States. To reduce the influence of seasonal factors, the percentage share for each state was calculated from a 12-month moving total.

California Maintains Lead for Total Trade through US Ports
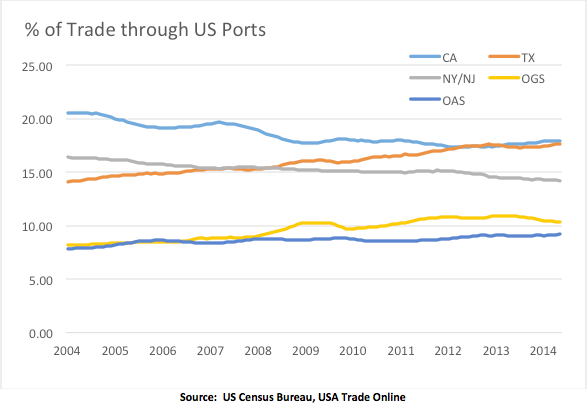
Measured by value, California’s share of total trade (exports plus imports) through US ports declined through much of the recession to a low of 17.30% in early 2012, at which point Texas moved ahead into the top position. Since February 2013, California regained the lead, with 17.92% of total US trade in April 2013 vs. Texas at 17.62%.
California’s trade position and the associated middle class jobs remain under challenge as a result of port expansions in Canada and Mexico, as well as existing and planned expansions in other states in anticipation of the now-delayed Panama Canal widening. In particular, Texas, Other Gulf States (OGS, including Florida), and Other Atlantic States (OAS, not including Florida) in the Southeast have prioritized trade as a focus for future economic growth, expecting that their port expansions will attract shipping to continue through a widened Panama Canal rather than docking along the West Coast. The chart below shows the share of total US exports represented by California and its chief US trade competitors. To reduce the influence of seasonal factors, the percentage share for each state was calculated from a 12-month moving total. As indicated, trade gains have been particularly significant for Texas and while they have achieved some gains, the other two state groups remain behind the three leading states.

