Highlights for policy makers:
- Unemployment Rate Eases to 5.2%; Total Employment Edges Up 9,600
- Broader Unemployment Measures Remain Above Pre-Recession Lows
- State Employment Growth Rankings
- Nonfarm Jobs Increase 15,200
- Six Industries Below 2007 Pre-Recession Job Levels
- Two-Tier Economy Persists
- 8 California MSAs in the 10 Worst Unemployment Rates Nationally
- Manufacturing Remains Leading Source of Employment for Immigrants to California
Unemployment Rate Eases to 5.2%; Total Employment Edges up 9,600
The Labor Force data for May 2016 (seasonally adjusted; California preliminary) is shown below, along with the change from the prior month:
| Seasonally Adjusted | California | US | ||
|---|---|---|---|---|
| May 2016 | Change from Apr 2016 | May 2016 | Change from Apr 2016 | |
| Unemployment Rate | 5.2 | -0.1 | 4.7 | -0.3 |
| Labor Force | 19,075,800 | -0.1% | 158,466,000 | -0.3% |
| Participation Rate | 61.9 | -0.1 | 62.6 | -0.2 |
| Employment | 18,081,300 | 0.1% | 151,030,000 | 0.0% |
| Unemployment | 994,500 | -1.9% | 7,436,000 | -6.1% |
The related not seasonally adjusted numbers (California preliminary), with the change from May 2015:
| Not Seasonally Adjusted | California | US | ||
|---|---|---|---|---|
| May 2016 | Change from May 2015 | May 2016 | Change from May 2015 | |
| Unemployment Rate | 4.7 | -1.4 | 4.5 | -0.8 |
| Labor Force | 18,983,900 | -0.3% | 158,800,000 | 0.7% |
| Participation Rate | 61.6 | -0.9 | 62.7 | -0.3 |
| Employment | 18,085,000 | 1.2% | 151,594,000 | 1.5% |
| Unemployment | 898,900 | -22.8% | 7,207,000 | -13.9% |
California Employment Development Department’s (EDD) latest release shows on a seasonally adjusted basis, total employment essentially remained level, edging up only 9,600 from April. Unemployed dropped by 19,200, with roughly half reflected in the employment gains and the other half through decline in the labor force participation. California’s seasonally adjusted unemployment rate continued to decline from 5.3% in April to 5.2% in May. The unadjusted rate decreased from 6.1% in May 2015 to 4.7% in May 2016. California’s seasonally adjusted unemployment rate was the 18th highest among the states.
Total US employment saw a seasonally adjusted increase of only 26,000, while the number of unemployed decreased by 484,000. The US unemployment rate dropped from 5.0% in April to 4.7% in May, again primarily due to shrinkage in the total labor force.
Broader Unemployment Measures Remain Above Pre-Recession Lows
The May 2016 unemployment rate was the lowest since May 2007. The labor force participation rate, however, has now gone through a 15-month period at levels below the lows first reported in 1976. While employment growth has contributed to the declining unemployment rate, this drop-off in labor force participation—61.9% in May—has been a major factor as well.
The generally reported unemployment rate is only one of 6 unemployment measures tracked by the Bureau of Labor Statistics. These alternative rates vary from very narrowly defined measures, to broader accounting that considers persons who remain only marginally attached to the labor force:
- U-1, the most narrow, measures persons unemployed 15 weeks or longer
- U-2 covers those who have lost a job and those who completed temporary jobs
- U-3, the official unemployment rate and the one generally reported, covers total unemployed
- U-4 covers U-3 plus discouraged workers
- U-5 covers U-4 plus all other marginally attached workers
- U-6, the broadest measure, covers U-5 plus total employed part time for economic reasons
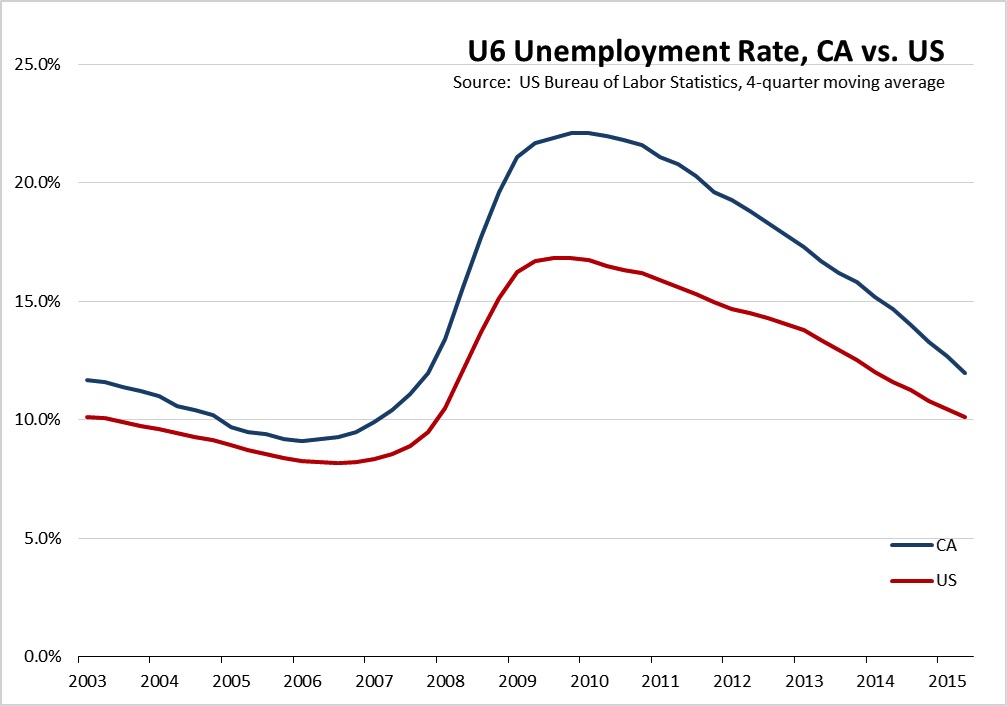
Looking at U-6, the most recently reported rate for California was 12.0% (4-quarter moving average) compared to a US average of 10.1%. The California rate was the 4th highest among the states, which ranged from 5.3% in North Dakota to 13.4% in Nevada.
The California U6 rate also remains well above the pre-recession levels, another indication that while California’s economy has rebuilt from the recession lows, it still in many areas has yet to achieve a full recovery. The California U6 rate compared to the US average is shown in the following figure. As indicated, both the U6 level and the spread between the California U6 rate and the US average have yet to return to the levels seen prior to the recession.
State Employment Growth Rankings
| Rank | Number of Employed | Percentage Change | Population Adjusted (employment growth per 1,000 civilian noninstitutional population) |
|---|---|---|---|
| 1 | CA 337,488 | OR 6.1% | OR 34.7 |
| 2 | TX 259,316 | TN 4.8% | DE 27.3 |
| 3 | FL 228,140 | DE 4.6% | TN 26.8 |
| 4 | MI 165,367 | AR 4.4% | AR 23.8 |
| 5 | NC 142,023 | AZ 4.1% | DC 23.7 |
| 6 | TN 137,997 | MI 3.7% | AZ 23.0 |
| 7 | NY 133,262 | DC 3.6% | CO 21.6 |
| 8 | GA 133,230 | SC 3.4% | MI 21.0 |
| 9 | AZ 121,199 | CO 3.4% | IN 19.6 |
| 10 | IL 113,580 | IN 3.2% | SC 18.7 |
| 11 | OR 111,613 | NC 3.2% | NC 18.3 |
| 12 | OH 106,685 | GA 3.0% | GA 17.1 |
| 13 | IN 100,236 | MO 2.6% | MO 16.1 |
| 14 | PA 93,637 | WA 2.5% | WA 15.1 |
| 15 | CO 91,490 | FL 2.5% | ID 14.2 |
| 16 | NJ 85,413 | MS 2.4% | FL 14.0 |
| 17 | WA 84,550 | ID 2.3% | UT 13.9 |
| 18 | MO 76,452 | HI 2.3% | HI 13.8 |
| 19 | SC 71,401 | WI 2.1% | WI 13.7 |
| 20 | WI 62,568 | UT 2.1% | TX 12.7 |
| 21 | AR 54,726 | TX 2.1% | MS 12.6 |
| 22 | MD 50,076 | NJ 2.0% | NJ 12.1 |
| 23 | MA 49,012 | OH 2.0% | NH 11.9 |
| 24 | MN 48,431 | AL 1.9% | OH 11.7 |
| 25 | AL 39,164 | KY 1.9% | MN 11.3 |
| 26 | KY 35,382 | CA 1.9% | IL 11.3 |
| 27 | UT 29,775 | IL 1.9% | CA 11.1 |
| US 2,282,000 | US 1.5% | US 9.0 |
Between May 2015 and May 2016, Bureau of Labor Statistics (BLS) data shows the total number of employed in California increased by 337,448 (seasonally adjusted), or 14.8% of the total net employment gains in this period for the US. Measured by percentage change in employment over the year, California was 26th highest. Adjusted for population, California ranked 27th. While California remains the leading state when measured by total change in employment, the recent data revisions continue to show a marked drop when ranked by performance relative to the size of the state’s economy and population.
Nonfarm Jobs Increase 15,200
EDD reported that between April and May 2016, seasonally adjusted nonfarm payroll jobs increased by 15,200. April’s gains were revised upwards to 70,000 from the previously reported gain of 59,600.
Looking at the not seasonally adjusted numbers, hiring saw increases in all but 4 industries. The change in total payroll jobs from April 2016 saw the largest increases in Farm (55,600) as seasonal hiring continued to increase, Health Care & Social Assistance (13,900), and Administrative & Support & Waste Services (12,700). Declines were in Management of Companies & Enterprises (-500), Professional, Scientific & Technical Services (-600), Information (-3,400), and Educational Services (-4,500) as schools began to enter the summer vacation period.
| Not Seasonally Adjusted Payroll Jobs | Apr 2016 | May 2016 | Change May 2016 – Apr 2016 | Change May 2016 – May 2015 |
|---|---|---|---|---|
| Total Farm | 424,700 | 480,300 | 55,600 | 7,600 |
| Mining & Logging | 25,200 | 25,500 | 300 | -3,900 |
| Construction | 754,200 | 760,700 | 6,500 | 41,700 |
| Manufacturing | 1,276,100 | 1,276,600 | 500 | -11,100 |
| Wholesale Trade | 735,900 | 739,300 | 3,400 | 20,000 |
| Retail Trade | 1,663,600 | 1,665,200 | 1,600 | 27,100 |
| Transportation, Warehousing & Utilities | 557,700 | 562,000 | 4,300 | 17,400 |
| Information | 497,500 | 494,100 | -3,400 | 13,800 |
| Finance & Insurance | 527,400 | 528,800 | 1,400 | 3,900 |
| Real Estate & Rental & Leasing | 278,900 | 280,900 | 2,000 | 9,400 |
| Professional, Scientific & Technical Services | 1,250,700 | 1,250,100 | -600 | 56,000 |
| Management of Companies & Enterprises | 234,100 | 233,600 | -500 | 4,300 |
| Administrative & Support & Waste Services | 1,063,300 | 1,076,000 | 12,700 | 34,300 |
| Educational Services | 378,100 | 373,600 | -4,500 | 19,400 |
| Health Care & Social Assistance | 2,164,900 | 2,178,800 | 13,900 | 79,900 |
| Individual & Family Services | 586,000 | 585,400 | -600 | 19,000 |
| Arts, Entertainment, & Recreation | 304,700 | 306,300 | 1,600 | 14,600 |
| Accommodation & Food Service | 1,583,800 | 1,593,000 | 9,200 | 46,200 |
| Other Services | 553,000 | 556,600 | 3,600 | 8,100 |
| Government | 2,552,100 | 2,560,600 | 8,500 | 62,800 |
| Total Nonfarm | 16,401,200 | 16,461,700 | 60,500 | 443,900 |
| Total Wage & Salary | 16,825,900 | 16,942,000 | 116,100 | 451,500 |
By total number of new jobs, California had the highest increase in seasonally adjusted nonfarm jobs among the states from May 2014 to May 2015, at 440,300 or 18.4% of the US net increase. By percentage growth in jobs, California was 8th highest, and by population adjusted jobs growth, 10th highest.
| Rank | Number of Jobs | Employment Growth (%) | Population Adjusted (job growth per 1,000 civilian noninstitutional population) |
|---|---|---|---|
| 1 | CA 440,300 | OR 3.4% | DC 31.5 |
| 2 | FL 253,900 | UT 3.3% | UT 20.6 |
| 3 | TX 171,800 | ID 3.2% | OR 18.2 |
| 4 | GA 124,600 | WA 3.2% | WA 17.7 |
| 5 | WA 100,800 | FL 3.2% | ID 17.0 |
| 6 | NY 89,800 | GA 2.9% | GA 15.8 |
| 7 | MI 79,900 | AZ 2.9% | FL 15.3 |
| 8 | NC 78,100 | CA 2.8% | DE 14.5 |
| 9 | AZ 75,700 | DE 2.5% | CO 14.4 |
| 10 | OH 70,900 | CO 2.4% | CA 14.3 |
| 11 | VA 67,900 | SC 2.4% | AZ 14.2 |
| 12 | CO 62,000 | DC 2.3% | HI 12.5 |
| 13 | TN 60,900 | HI 2.2% | SC 12.2 |
| 14 | OR 59,500 | TN 2.1% | TN 11.7 |
| 15 | MA 53,400 | NV 2.0% | NE 11.3 |
| 16 | MD 48,600 | MI 1.9% | NV 10.9 |
| 17 | NJ 48,000 | NC 1.8% | WI 10.4 |
| 18 | WI 47,700 | AR 1.8% | VA 10.4 |
| 19 | SC 47,300 | MD 1.8% | MD 10.2 |
| 20 | IL 46,400 | VA 1.8% | MI 10.1 |
| US 2,398,000 | US 1.7% | US 9.5 |
Six Industries Below 2007 Pre-Recession Job Levels
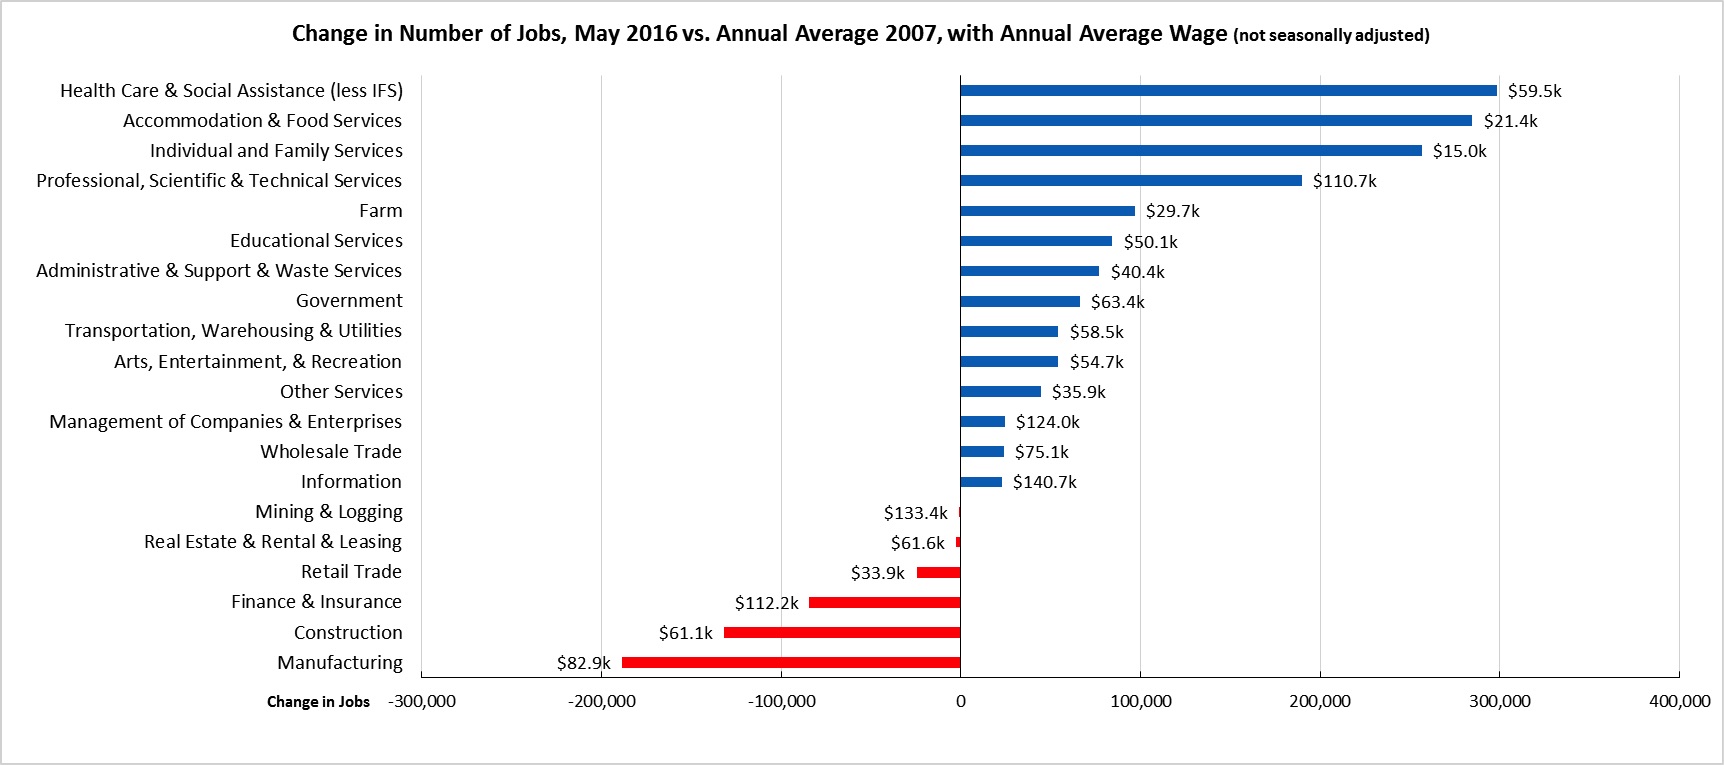
Comparing the number of jobs by industry in May 2016 (not seasonally adjusted), six industries showed employment below the 2007 pre-recession levels. In the highest gain industries, Health Care & Social Assistance (less Individual & Family Services) remained the leading industry, followed by the two lowest wage industries in 2nd and 3rd place. The highest wage blue collar industry—Mining & Logging—remained in negative territory as oil prices remained low.
Two-Tier Economy Persists
Unemployment rates (all data is not seasonally adjusted) continue to vary widely across the state, ranging from 3.4% in the Bay Area to more than double at 8.6% in the Central Valley.
| Not Seasonally Adjusted | Unemployment Rate (%) May 2016 |
|---|---|
| California | 4.7 |
| Bay Area | 3.4 |
| Orange County | 3.6 |
| Los Angeles | 4.3 |
| Sacramento Region | 4.7 |
| San Diego/Imperial | 4.9 |
| Inland Empire | 5.3 |
| Central Coast | 5.3 |
| Central Sierra | 5.5 |
| Upstate California | 6.3 |
| Central Valley | 8.6 |
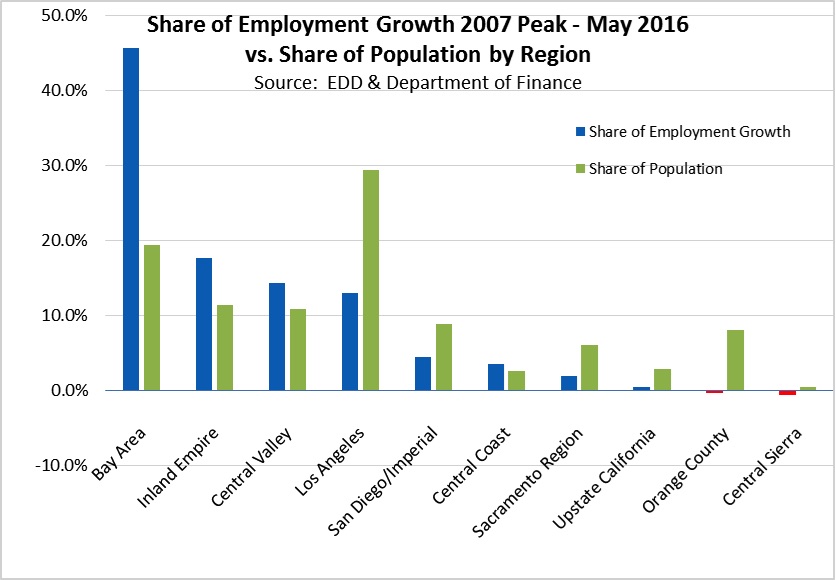
Looking at the regional shifts in the state’s economy, the Bay Area continues to dominate net employment growth. Compared to the precession employment peak, the Bay Area with just under 20% of the population accounts for 45.6% of the net employment growth. Continued population growth in Inland Empire and Central Valley has seen net employment gains as well, while Los Angeles Region with nearly 30% of the population contains only 13.0% of the net employment gains.
By Legislative District:
| Lowest 10 Unemployment Rates | |||||
|---|---|---|---|---|---|
| CD 12 (Pelosi – D) | 2.7 | SD 13 (Hill – D) | 2.5 | AD 22 (Mullin – D) | 2.5 |
| CD 18 (Eshoo – D) | 2.7 | SD 11 (Leno – D) | 2.9 | AD 16 (Baker – R) | 2.5 |
| CD 45 (Walters – R) | 2.9 | SD 37 (Moorlach – R) | 3.1 | AD 24 (Gordon – D) | 2.6 |
| CD 14 (Speier – D) | 3.0 | SD 26 (Allen – D) | 3.2 | AD 28 (Low – D) | 2.8 |
| CD 33 (Lieu – D) | 3.0 | SD 39 (Block – D) | 3.3 | AD 17 (Chiu – D) | 2.9 |
| CD 52 (Peters – D) | 3.0 | SD 36 (Bates – R) | 3.4 | AD 19 (Ting – D) | 2.9 |
| CD 17 (Honda – D) | 3.1 | SD 15 (Beall – D) | 3.5 | AD 66 (Hadley – R) | 3.0 |
| CD 27 (Chu – D) | 3.2 | SD 25 (Liu – D) | 3.5 | AD 74 (Harper – R) | 3.0 |
| CD 48 (Rohrabacher – R) | 3.4 | SD 07 (Glazer – D) | 3.6 | AD 77 (Maienschein – R) | 3.0 |
| CD 02 (Huffman – D) | 3.5 | SD 32 (Mendoza – D) | 3.6 | AD 73 (Brough – R) | 3.0 |
| Highest 10 Unemployment Rates | |||||
|---|---|---|---|---|---|
| CD 44 (Hahn – D) | 5.9 | SD 21 (Runner – R) | 5.2 | AD 12 (Olsen – R) | 6.6 |
| CD 20 (Farr – D) | 5.9 | SD 31 (Roth – D) | 5.4 | AD 03 (Gallagher – R) | 7.1 |
| CD 41 (Takano – D) | 6.0 | SD 20 (Leyva – D) | 5.4 | AD 23 (Patterson – R) | 7.5 |
| CD 09 (McNerney – D) | 6.7 | SD 04 (Nielsen – R) | 5.9 | AD 13 (Eggman – D) | 7.6 |
| CD 10 (Denham – R) | 7.4 | SD 05 (Galgiani – D) | 7.1 | AD 34 (Grove – R) | 7.8 |
| CD 22 (Nunes – R) | 8.0 | SD 08 (Berryhill – R) | 7.2 | AD 26 (Mathis – R) | 9.3 |
| CD 23 (McCarthy – R) | 8.2 | SD 16 (Fuller – R) | 8.0 | AD 31 (Arambula – D) | 9.7 |
| CD 16 (Costa – D) | 9.7 | SD 12 (Cannella – R) | 8.2 | AD 21 (Gray – D) | 9.7 |
| CD 51 (Vargas – D) | 9.8 | SD 40 (Hueso – D) | 8.3 | AD 32 (Salas – D) | 11.3 |
| CD 21 (Valadao – R) | 10.5 | SD 14 (Vidak – R) | 11.1 | AD 56 (Garcia – D) | 11.3 |
8 California MSAs in the 10 Worst Unemployment Rates Nationally
While employment continues to improve in parts of the state, other portions of California continue to experience some of the worst unemployment rates in the nation. Of the 10 Metropolitan Statistical Areas (MSAs) with the worst unemployment rates nationally, 8 are in California. Of the 20 worst, 12 are in California.
| US Rank | MSA | Apr 2016 Unemployment Rate |
|---|---|---|
| 364 | Salinas, CA Metropolitan Statistical Area | 7.5 |
| 364 | Santa Cruz-Watsonville, CA Metropolitan Statistical Area | 7.5 |
| 364 | Wheeling, WV-OH Metropolitan Statistical Area | 7.5 |
| 370 | Rocky Mount, NC Metropolitan Statistical Area | 7.6 |
| 370 | Vineland-Bridgeton, NJ Metropolitan Statistical Area | 7.6 |
| 372 | Beckley, WV Metropolitan Statistical Area | 7.8 |
| 372 | Farmington, NM Metropolitan Statistical Area | 7.8 |
| 374 | Stockton-Lodi, CA Metropolitan Statistical Area | 8.1 |
| 375 | Weirton-Steubenville, WV-OH Metropolitan Statistical Area | 8.2 |
| 376 | Yakima, WA Metropolitan Statistical Area | 8.4 |
| 377 | Modesto, CA Metropolitan Statistical Area | 9.0 |
| 378 | Fresno, CA Metropolitan Statistical Area | 9.7 |
| 378 | Madera, CA Metropolitan Statistical Area | 9.7 |
| 378 | Yuba City, CA Metropolitan Statistical Area | 9.7 |
| 381 | Hanford-Corcoran, CA Metropolitan Statistical Area | 10.0 |
| 382 | Bakersfield, CA Metropolitan Statistical Area | 10.6 |
| 383 | Visalia-Porterville, CA Metropolitan Statistical Area | 10.8 |
| 384 | Ocean City, NJ Metropolitan Statistical Area | 11.1 |
| 385 | Merced, CA Metropolitan Statistical Area | 11.2 |
| 386 | Yuma, AZ Metropolitan Statistical Area | 18.7 |
| 387 | El Centro, CA Metropolitan Statistical Area | 20.1 |
Manufacturing Remains Leading Source of Employment for Immigrants to California
Labor force availability is an emerging challenge to many developed economies—including many states in the Northeast and Upper Midwest—stemming from demographic shifts due to aging populations combined with lower birth rates. California, on the other hand, has long benefited from being a prime destination for immigration, in the past through immigration from other states and ongoing through immigration from other nations. This situation has provided a continuous flow of new labor force entrants, at times with the skills in short supply within the existing labor force and lacking under development within the state’s school systems.
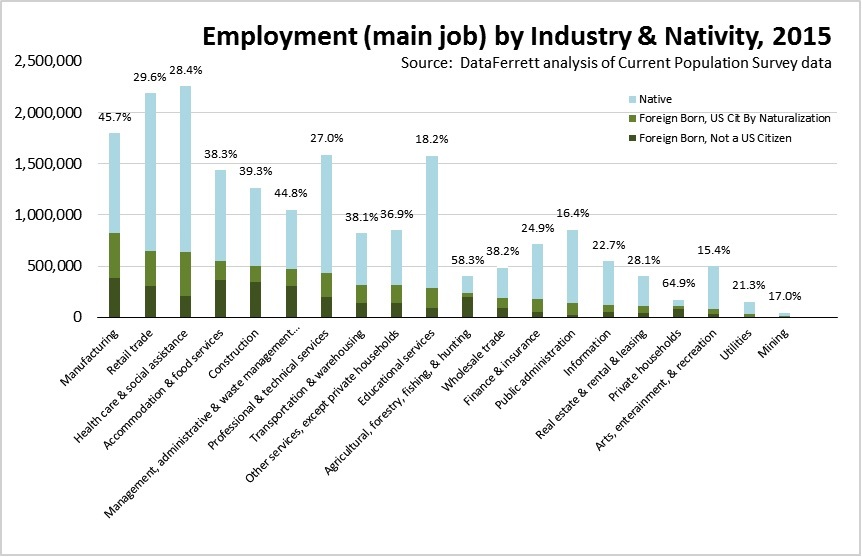
The significance of this labor force factor, however, varies widely across California’s industries. Through an analysis of the Current Population Survey data, the following figure shows the relative distribution by industry for workers by nativity, based on their reported main job. The data compares workers who are US citizens by birth to workers who are foreign born, including both foreign born who are citizens by naturalization and those who have not yet become citizens.
As indicated, Manufacturing is the dominant source of employment for California’s immigrant population. In absolute numbers, it is by far the largest, accounting for over 800,000 workers. In relative terms, immigrants constitute 45.7% of all workers within Manufacturing, the third highest concentration behind the considerably smaller total number of workers found in Private Household Workers (64.9%) and Agriculture (58.3%). The Manufacturing concentration ratio has also been relatively stable, ranging from 45.8% in 2004 to 49.0% in 2008. Government (Public Administration), in contrast, reports far fewer both in terms of total numbers and the second lowest concentration ratio at only 16.4%.
Historically, manufacturing has played a key role in upward economic mobility in particular for blue collar workers, and these results indicate it continues to perform this function in a significant way for California’s immigrant population. In the most recent 4-quarter average, Manufacturing paid $82,900 annually in wages, compared to only $33,900 for the second largest (Retail Trade) and $21,400 for the fourth largest (Accommodation & Food Services) sources of jobs for the immigrant population in 2015.
Manufacturing’s ability to continue providing these gateway opportunities for future immigrants, however, remains under challenge. The continuing regulatory barriers to employment flexibility, increasing industrial energy prices stemming from the state’s energy policies, high tax rates both for corporations and even higher for pass-through business forms, increasing regulatory burdens, and declining skills training in the state’s schools represent ongoing competitiveness challenges that are reflected in declining employment levels overall in this industry. Overall, Manufacturing remains nearly 200,000 employees below the pre-recession levels.
Note: All data sources, methodologies, and historical data series available at CenterforJobs.org.