Highlights for policy makers:
- Unemployment Dips to 4.2%; Employment Down 39,400
- Labor Force Participation Rate Dips to 62.4%
- Labor Force by Age
- Employment Growth Ranking—California Dips to 3rd
- Nonfarm Jobs Up 19,400 for Month; California Remains Ranked #2 for 12-month Gain
- Jobs Change by Industry
- Structural Shifts in State’s Economy
- Unemployment Rates by Region
- Unemployment Rates by Legislative District
- Employment Growth by Region
- MSAs with the Worst Unemployment Rates
- Chart of the Month: $15 Minimum Wage
Unemployment Dips to 4.2%; Employment Down 39,400
EDD reported total employment (seasonally adjusted; May preliminary) was down 39,400 from the revised April numbers, while the number of unemployed was down 10,300. Unemployment rate dipped to 4.2%. The unadjusted rate was down 0.2 point from the year earlier to 3.5%.
California had the 10th highest unemployment rate.
Total US employment saw a seasonally adjusted gain of 113,000, with the number of unemployed rising 64,000. The unemployment rate remained level at 3.6%, the lowest monthly rate since 1966.
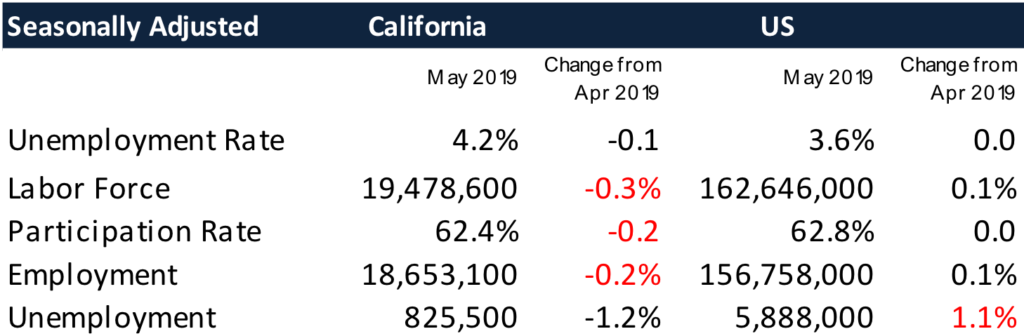
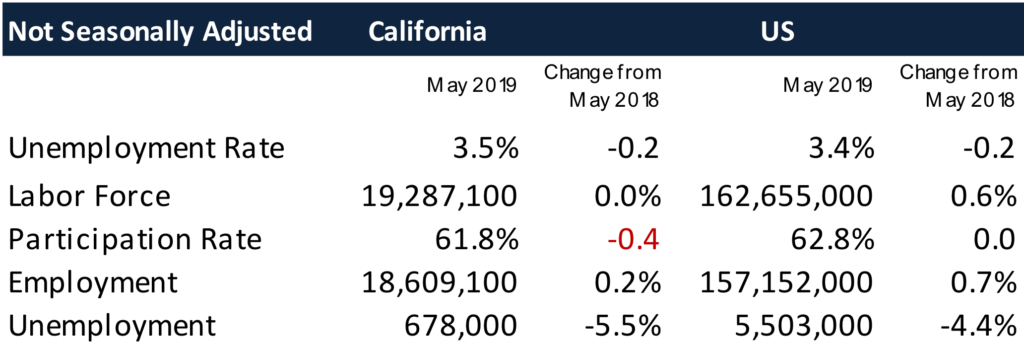
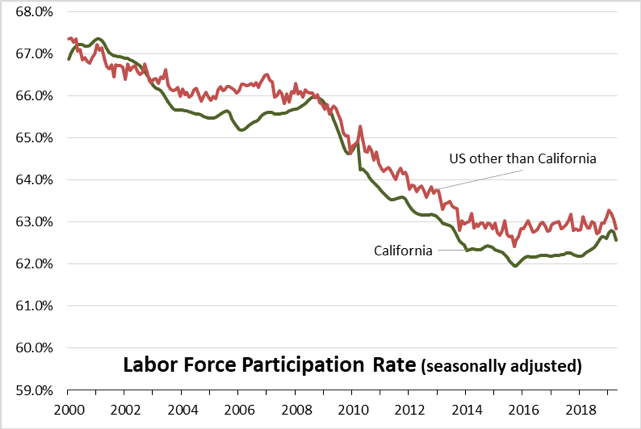
Labor Force Participation Rate Dips to 62.4%
California’s seasonally adjusted labor force participation rate eased to 62.6%. Nationally, the participation rate remained level at 62.8%. Although the gap has narrowed, the state continues to experience lower than average participation rates in spite of having a relatively younger population than the rest of the US.
For the 12 months ending May 2019, the seasonally adjusted data shows the California labor force grew 0.7% compared to the rest of the US at 0.6%.
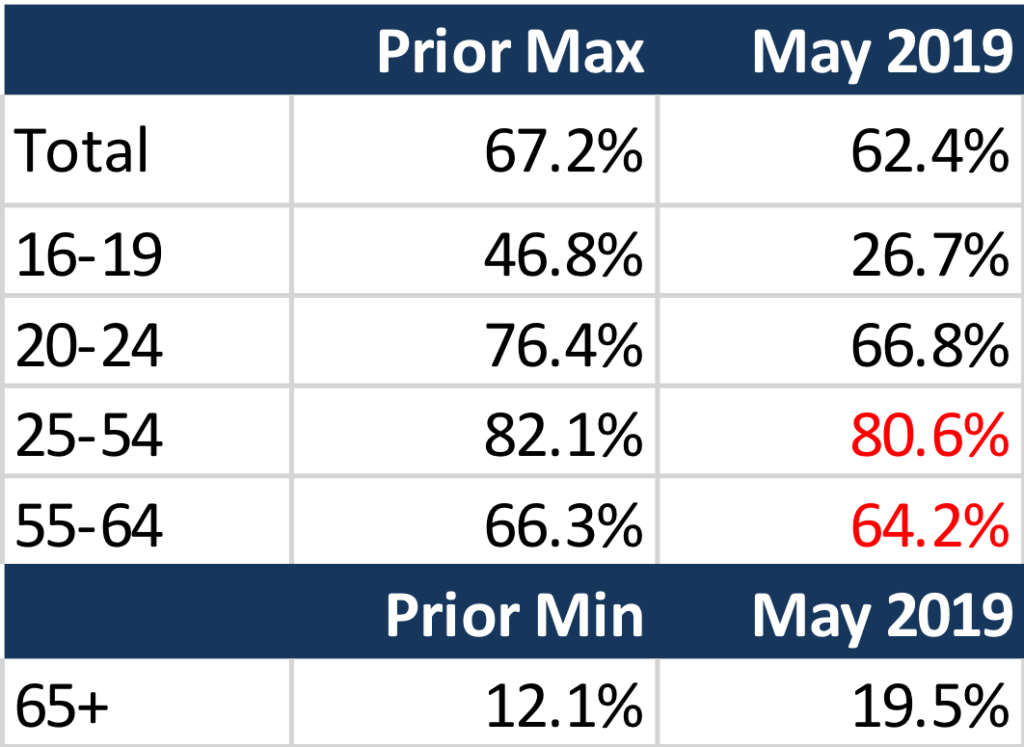
Labor Force by Age
Labor force participation by age (12-month running average) eased for adults while remaining level for youth and seniors but improving for young adults. The continued low rates for youth and young adults in particular have implications for life-time earnings potential due to the delay in acquiring essential workplace skills. While more people are working past age 65, these gains do not offset the sharp drops in the youngest groups and softness in the prime working age groups.
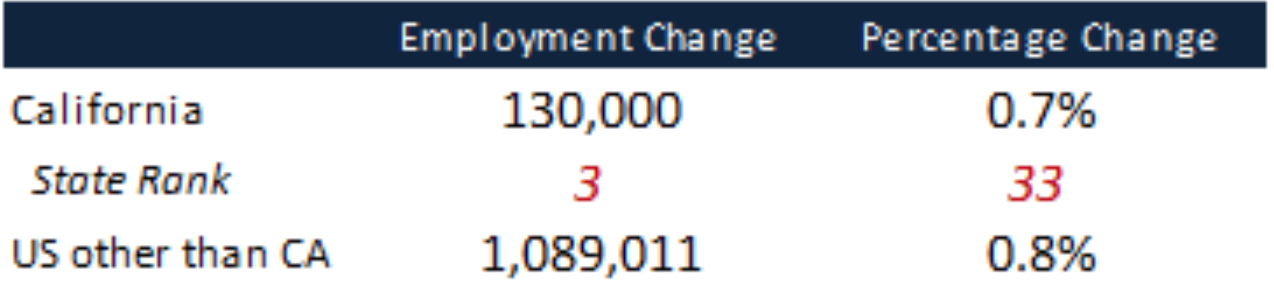
Employment Growth Ranking—California Dips to 3rd
In another sign of the economy’s slowing, the total number of persons employed (seasonally adjusted) over the 12 months ending in May grew by 130,000. California dipped to 3rd place behind Texas, which saw an additional 242,200 persons employed over this period, and Florida at a gain of 143,800.
Based on percentage growth, California had a 0.7% expansion in employment, below the average for the rest of the US at 0.8%. Ranked among the states, California’s growth rate dropped to 33rd place, while Tennessee and Nevada took the lead at 2.8% each.
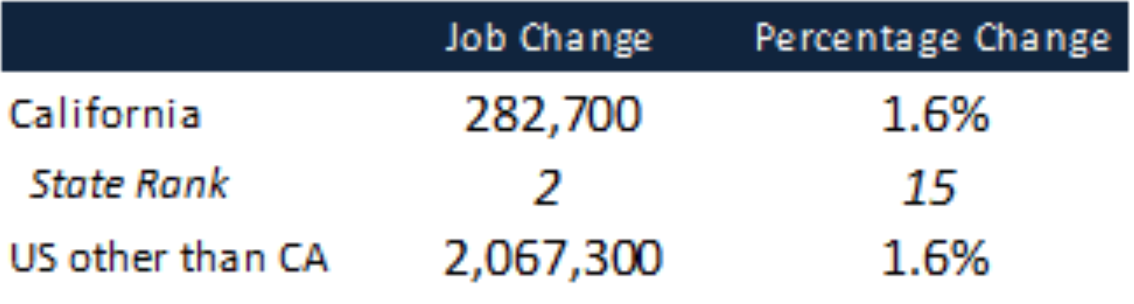
Nonfarm Jobs Up 19,400 for Month; California Remains Ranked #2 for 12-month Gain
Nonfarm jobs (seasonally adjusted) were up 19,400 from April. April’s gains remained at the previously reported 46,000.
For the 12 months ending May, total jobs growth was 282,700, keeping the state in 2nd place behind Texas which gained 286,300 jobs in this period, with Florida in third at 214,500.
On a percentage basis, California at 15th among the states, with a 12-month jobs growth rate of 1.6%, the same as the average for all the other states.
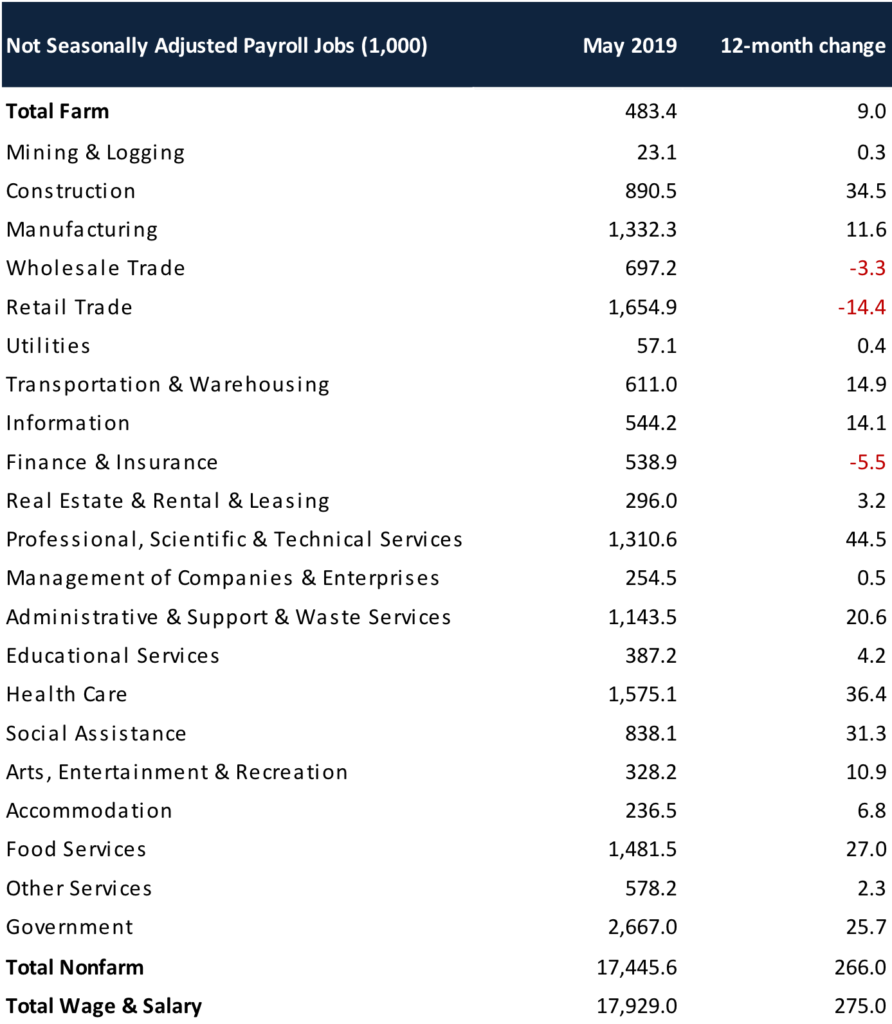
Jobs Change by Industry
In the unadjusted numbers that allow a more detailed look at industry shifts, hiring saw increases in all but 3 industries over the year.
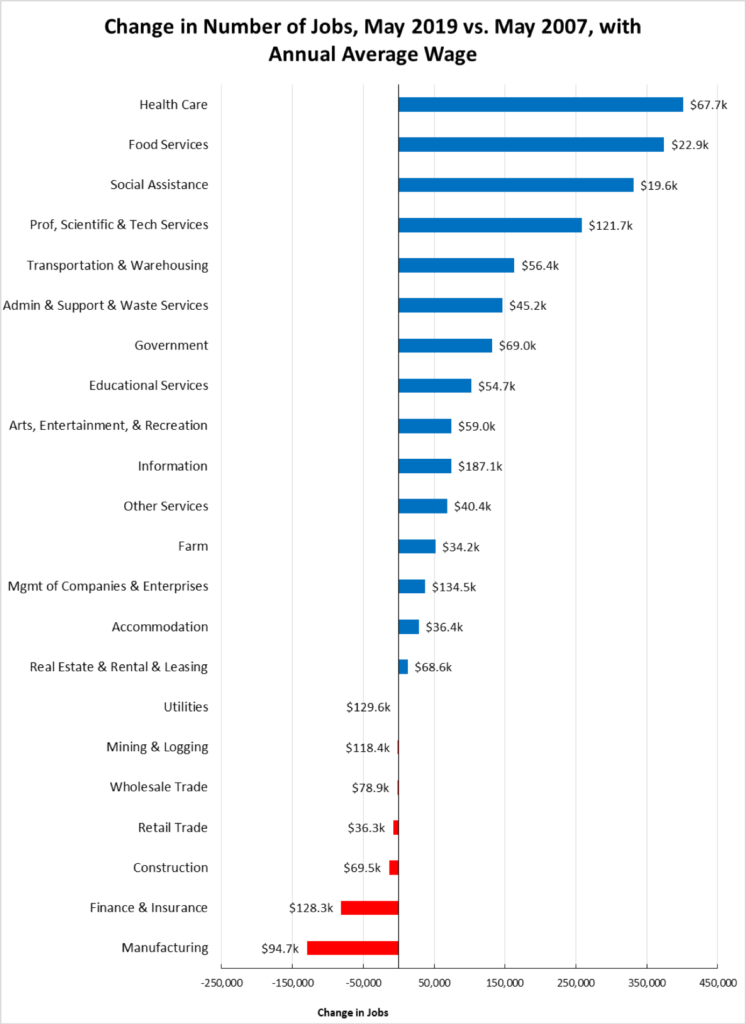
Gains in payroll jobs were led by Professional, Scientific & Technical Services ($121.7k average annual wages), Health Care ($67.7k), and Construction ($69.5k).
Declines were led by Retail Trade ($36.3k), Finance & Insurance ($128.3k), and Wholesale Trade ($78.9k).
All wage data is from the most current 4-quarter average from the Quarterly Census of Employment & Wages.
Structural Shifts in State’s Economy
Comparing current job numbers to the pre-recession levels in 2007 illustrates the structural shift in the state’s economy, with the primary jobs growth occurring in the higher and lower wage industries.
Jobs growth within the traditional middle class wage—especially blue collar industries such as Manufacturing, Construction, and Mining & Logging—continues to lag with the heavily blue collar Utilities beginning to show shrinkage as well. After stronger gains during the recovery, both Wholesale and Retail Trade have shown weakness in recent months, reflecting competitive pressures from nontraditional channels as well as greater use of technology in response to growing costs for labor, energy, rent, and regulation. Finance & Insurance also continues to lose ground.
Construction has gained in the past year as activity has picked up. Construction jobs remain 29,300 below the 2007 peak and 75,800 (8%) below the pre-recession high in 2006. Over half (vs. 2007) to one-third (2006) of these gaps are due to reduced activity in Residential Building Construction.
Unemployment Rates by Region
| California | 3.5 |
| Bay Area | 2.3 |
| Orange County | 2.4 |
| Sacramento | 3.1 |
| San Diego/Imperial | 3.3 |
| Inland Empire | 3.5 |
| Central Sierra | 3.5 |
| Los Angeles | 3.8 |
| Central Coast | 3.9 |
| Upstate California | 4.6 |
| Central Valley | 6.5 |
Unemployment Rates by Legislative District
| Lowest | |||||
|---|---|---|---|---|---|
| CD12 (Pelosi-D) | 1.8 | SD13 (Hill-D) | 1.6 | AD22 (Mullin-D) | 1.6 |
| CD18 (Eshoo-D) | 1.8 | SD11 (Wiener-D) | 1.9 | AD16 (Bauer-Kahan-D) | 1.6 |
| CD14 (Speier-D) | 1.9 | SD36 (Bates-R) | 2.2 | AD24 (Berman-D) | 1.7 |
| CD17 (Khanna-D) | 2.0 | SD37 (Moorlach-R) | 2.2 | AD17 (Chiu-D) | 1.8 |
| CD15 (Swalwell-D) | 2.1 | SD39 (Atkins-D) | 2.2 | AD28 (Low-D) | 1.9 |
| CD52 (Peters-D) | 2.2 | SD10 (Wieckowski-D) | 2.2 | AD25 (Chu-D) | 2.0 |
| CD49 (Levin-D) | 2.2 | SD15 (Beall-D) | 2.3 | AD19 (Ting-D) | 2.0 |
| CD45 (Porter-D) | 2.2 | SD07 (Glazer-D) | 2.4 | AD78 (Gloria-D) | 2.1 |
| CD48 (Rouda-D) | 2.2 | SD02 (McGuire-D) | 2.5 | AD73 (Brough-R) | 2.1 |
| CD02 (Huffman-D) | 2.4 | SD34 (Umberg-D) | 2.6 | AD74 (Petrie-Norris-D) | 2.1 |
| Highest | |||||
|---|---|---|---|---|---|
| CD43 (Waters-D) | 4.5 | SD24 (Durazo-D) | 4.4 | AD03 (Gallagher-R) | 5.2 |
| CD40 (Roybal-Allard-D) | 4.6 | SD33 (Lara-D) | 4.4 | AD23 (Patterson-R) | 5.3 |
| CD09 (McNerney-D) | 4.7 | SD30 (Mitchell-D) | 4.7 | AD64 (Gipson-D) | 5.4 |
| CD10 (Harder-D) | 5.1 | SD35 (Bradford-D) | 4.8 | AD13 (Eggman-D) | 5.6 |
| CD44 (Barragan-D) | 5.4 | SD05 (Galgiani-D) | 5.0 | AD34 (Fong-R) | 5.8 |
| CD22 (Nunes-R) | 6.1 | SD08 (Borgeas-R) | 5.0 | AD21 (Gray-D) | 7.0 |
| CD23 (McCarthy-R) | 6.3 | SD16 (Grove-R) | 5.9 | AD31 (Arambula-D) | 7.7 |
| CD51 (Vargas-D) | 7.1 | SD40 (Hueso-D) | 6.1 | AD26 (Mathis-R) | 7.9 |
| CD16 (Costa-D) | 7.4 | SD12 (M.Caballero-D) | 6.2 | AD56 (Garcia-D) | 8.2 |
| CD21 (Cox-D) | 8.1 | SD14 (Hurtado-D) | 9.0 | AD32 (Salas-D) | 8.4 |
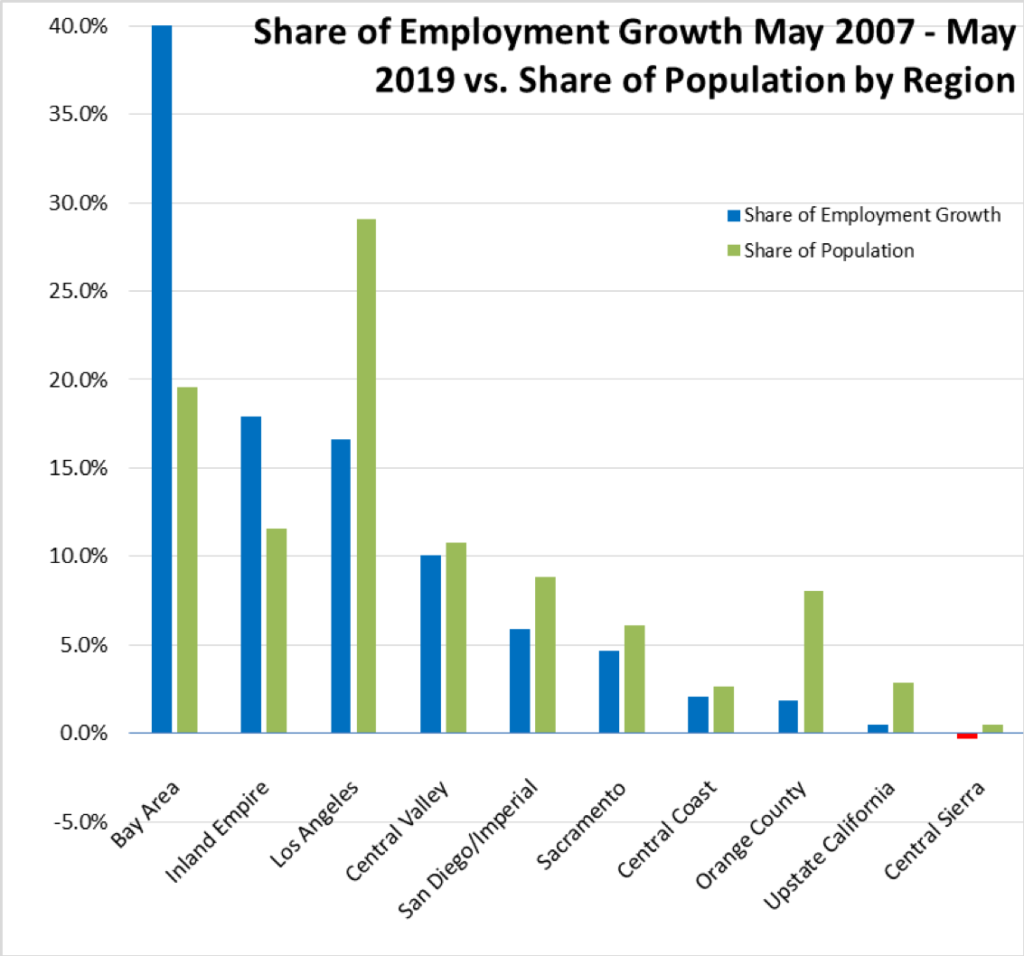
Employment Growth by Region
Containing 19.6% of the state’s population, the Bay Area has accounted for 40.8% of net employment growth compared to pre-recession levels. Los Angeles Region, with 29.1% of the population, accounted for only 16.6% of net employment gains, while Inland Empire continues to occupy the number 2 slot.
MSAs with the Worst Unemployment Rates
Of the 20 Metropolitan Statistical Areas (MSAs) with the worst unemployment rates in April 2018, 11 are in California, including El Centro MSA (Imperial County) with the highest unemployment rate in the country and Visalia-Porterville MSA with the third worst.
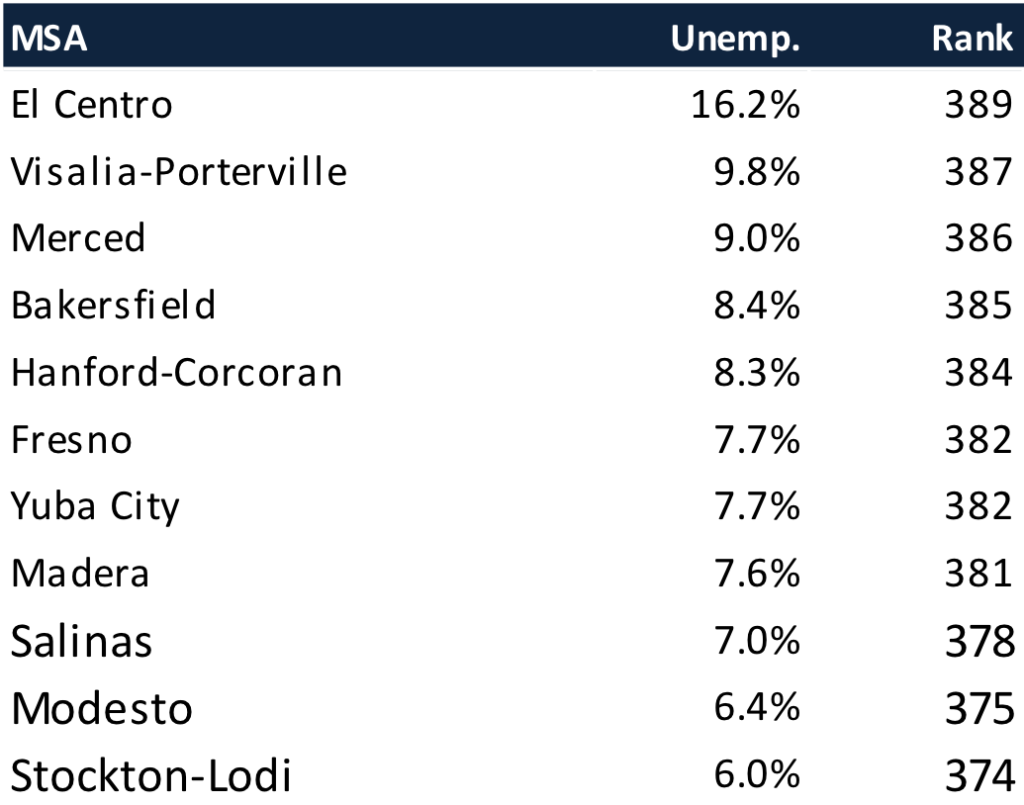
Chart of the Month: San Francisco Restaurant Jobs Drop as Minimum Wage Reaches $15
In 2014, San Francisco voters passed an ordinance raising the local minimum wage to $15 an hour by July 1, 2018, with annual adjustments each year after to match the annual increase in the Consumer Price Index. The local minimum wage reached $15 in July 2018, and is slated to go to $15.59 on July 1, 2019.
In 2016, the legislature passed SB 3 (Leno) enacting similar wage hikes, requiring $15 an hour for employers with more than 25 employees by January 2022, and for those with fewer than 25 by January 2023. Current minimum wage is $12 for the larger employers, and $11 for the small businesses, although other localities throughout the state also have enacted local requirements as well.
Being the first locality to reach $15 an hour, San Francisco can begin to illustrate the potential ramifications of this wage level on local jobs creation, particularly since as a city and county, the relevant jobs and wage data is readily available from the Quarterly Census of Employment & Wages. Partially countering this data availability, however, are two other aspects of the local economy.
• First, San Francisco is at the center of the state’s tech industry, with considerably higher growth in local incomes compared to the rest of the state. All other factors being equal, jobs growth particularly in the typical service industries employing relatively larger numbers of minimum wage workers should be higher than the rest of the state.
• Second, operating a business within San Francisco generally entails higher costs for more than just wages, especially for rent, support services and supplies, employee benefits, and regulatory costs. These costs have also been increasing at the same time as hourly wage.
The policy issues related to minimum wage are not necessarily clear cut, nor were they fully considered in the rushed passage of SB 3. Employees receiving the higher wage see a clear benefit. Their total incomes may or may not rise, however, depending on whether one of the adjustments their employers use to cope with the higher cost is to reduce total hours worked or, as is already occurring in many service industries, accelerate the use of technology (e.g., self-check, counter ordering, ordering kiosks/tablets) to reduce overall labor use. In a survey of employers conducted as part of the Center’s recent Jobs, Poverty and Upward Mobility project, only 39% of employers indicated they were somewhat or extremely likely to reduce the number of employees in response to the state minimum wage increase, 46% likely to reduce hours, 48% likely to increase automation, but 73% likely to raise prices.
This large response signaling price increases, however, illustrates the more important effect of mandated wage levels—the potential to increase the state’s already rapidly rising costs of living. In the lower income worker focus groups and surveys conducted for the Upward Mobility project, concern over costs of living were more elevated than those related to incomes. In general, the respondents indicated they were aware of the opportunities to pursue higher wage employment, but that the risks of making the wrong job decision were too costly given the state’s current and growing cost of living. In the survey, nearly two-thirds of respondents agreed that a higher minimum wage would help workers like themselves. But three-fourths believed higher minimum wage leads to higher prices, which only exacerbates the situation of their income not keeping pace with rising costs of living.
Most analyses looking at jobs effects from recent local actions on minimum wage tend to concentrate on the restaurant industry. Historically, this industry has a sizeable percentage of minimum wage workers including students and others seeking entry-level or part-time work and lower skilled workers with fewer alternatives in the shifting structure of the economy. A highly competitive industry with very low profit margins, labor is the second highest cost component behind food, with fewer adjustment opportunities beyond the labor component and price increases available to respond to growing costs of operation. The Food Services & Drinking Places industry also has played an outsize role in the state’s economic recovery, constituting the second highest industry growth and providing over one-sixth of net jobs creation since 2007.
In looking at the different parts of San Francisco’s restaurant industry, the most recent data through the end of 2018 showed mixed results. For Limited Service Eating Places (limited service restaurants, cafeterias, and snack and nonalcoholic beverage bars), jobs growth was just slightly higher than the rest of the state. Using the 4th Quarter (peak sales period) data, San Francisco grew 21.1% between 2014 and 2018, while the industry in the rest of the state grew 18.8%.
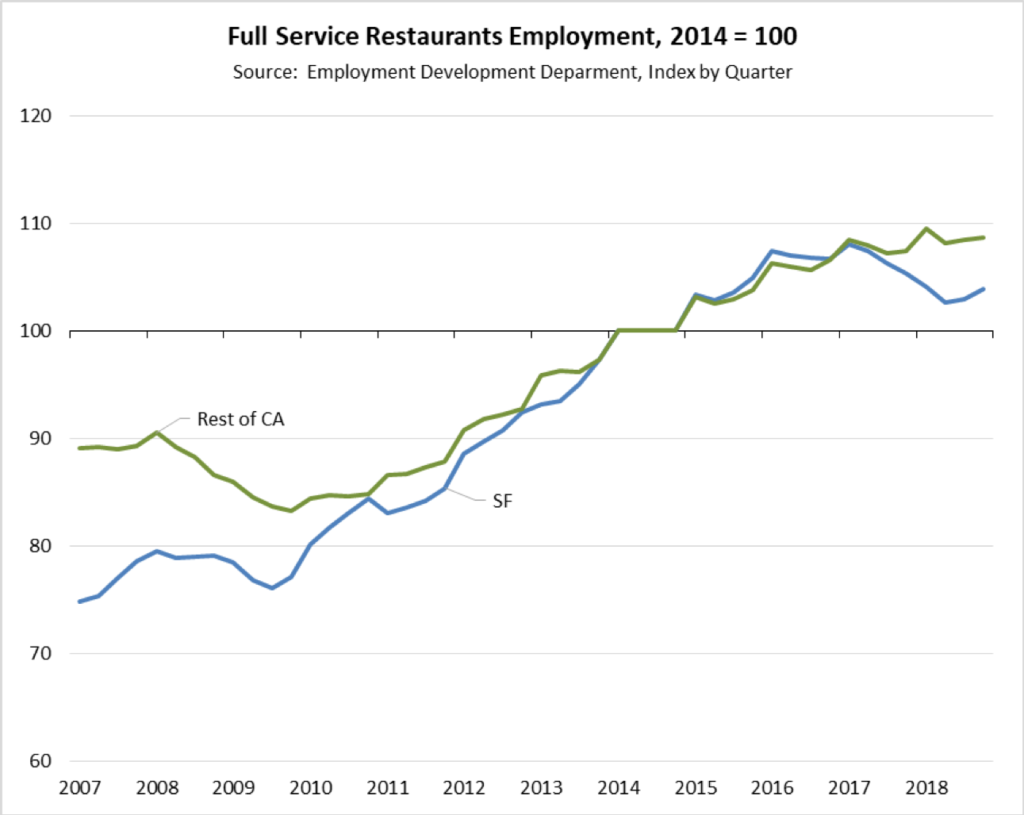
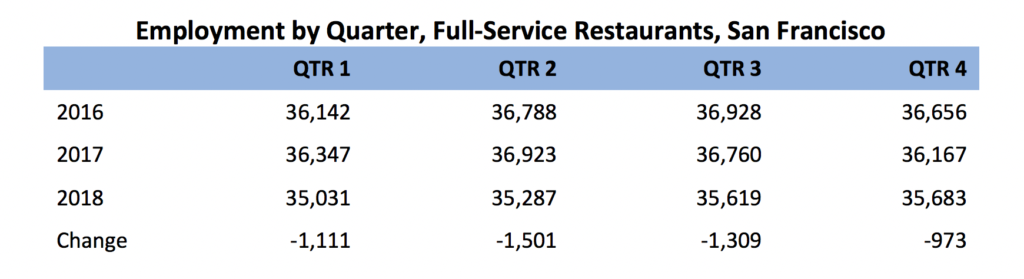
Full Service Restaurants, however, show a jobs decline. As shown in the chart above, jobs within San Francisco accelerated during the recession years, and grew proportionally with the rest of the state through 2016. The number of San Francisco restaurant jobs then began to decline, with the number of restaurants (establishments) in the City little changed between 2016 and 2018. In this period, essentially the same number of businesses were employing on average fewer workers.
The numbers above suggest there may be a jobs effect from the $15 minimum wage. Limited Service jobs growth should be higher given San Francisco’s substantially higher personal income growth in this period. Full Service jobs show a decline. The exact role of minimum wage in these outcomes, however, would require a more detailed analysis similar to that in the previously cited study.