Highlights for policy makers:
- Unemployment Rate Declines to 5.7%; Total Employment Rises 10,900
- State Employment Growth Rankings
- Labor Force Participation Rate Declines to 62.0%–Another New Low
- Nonfarm Jobs Increase 5,500
- Four Industries Remain Below 2007 Pre-Recession Job Levels
- Six Counties Remain in Double-Digit Unemployment; 12 are 5% or Less
- Two-Tier Economy Persists
- Bay Area Continues to Dominate Employment Growth
Unemployment Rate Declines to 5.7%; Total Employment Rises 10,900
The Labor Force data for November 2015 (seasonally adjusted; California preliminary) is shown below, along with the change from the prior month:
| Seasonally Adjusted | California | US | ||
|---|---|---|---|---|
| Nov 2015 | Change from Oct 2015 | Nov 2015 | Change from Oct 2015 | |
| Unemployment Rate | 5.7 | -0.1 | 5.0 | 0 |
| Labor Force | 18,991,900 | 0.0% | 157,301,000 | 0.2% |
| Participation Rate | 62.0 | -0.1 | 62.5 | 0.1 |
| Employment | 17,910,100 | 0.1% | 149,364,000 | 0.2% |
| Unemployment | 1,081,800 | -1.2% | 7,937,000 | 0.4% |
The related not seasonally adjusted numbers (California preliminary), with the change from November 2014:
| Not Seasonally Adjusted | California | US | ||
|---|---|---|---|---|
| Nov 2015 | Change from Nov 2014 | Nov 2015 | Change from Nov 2014 | |
| Unemployment Rate | 5.7 | -1.4 | 4.8 | -0.7 |
| Labor Force | 18,988,100 | 0.2% | 157,340,000 | 0.7% |
| Participation Rate | 62.0 | -0.5 | 62.5 | -0.3 |
| Employment | 17,913,300 | 1.8% | 149,766,000 | 1.4% |
| Unemployment | 1,074,800 | -19.9% | 17,573,000 | -12.2% |
California Employment Development Department’s (EDD) latest release shows on a seasonally adjusted basis, total employment grew by 10,900 from October, while the number of unemployed dropped by 13,100. California’s seasonally adjusted unemployment rate declined from 5.8% in October to 5.7% in November. The unadjusted rate decreased from 7.1% in November 2014 to 5.4% in November 2015.
Total US employment saw a seasonally adjusted increase of 244,000, while the number of unemployed increased marginally by 29,000.
On a seasonally adjusted basis, California’s employment growth was half the national rate, while California experienced a decline in the number of unemployed as compared to the national increase.
California’s seasonally adjusted unemployment rate was 14.0% higher than the national rate. California and remained the 11th highest unemployment rate among the states (including DC).
State Employment Growth Rankings
| Rank | Number of Employed | Percentage Change | Population Adjusted (employment growth per 1,000 civilian noninstitutional population) |
|---|---|---|---|
| 1 | CA 364,712 | MS 6.8% | MS 34.1 |
| 2 | NY 231,776 | ID 4.0% | ID 24.0 |
| 3 | NC 133,817 | TN 3.6% | TN 19.7 |
| 4 | TN 101,288 | SC 3.4% | OK 19.7 |
| 5 | MI 81,097 | OK 3.4% | SC 18.8 |
| 6 | PA 78,514 | DE 3.2% | DE 18.5 |
| 7 | MS 77,580 | NV 3.1% | NV 18.2 |
| 8 | IN 76,393 | NC 3.1% | RI 17.7 |
| 9 | MD 71,287 | RI 2.9% | NC 17.3 |
| 10 | SC 71,202 | AR 2.8% | DC 16.9 |
| 11 | IL 59,946 | DC 2.6% | MD 15.2 |
| 12 | AZ 59,178 | NY 2.6% | IN 14.9 |
| 13 | OK 58,223 | IN 2.5% | AR 14.9 |
| 14 | GA 57,224 | MD 2.4% | NY 14.7 |
| 15 | NJ 49,416 | HI 2.2% | HI 13.2 |
| 16 | FL 48,976 | MT 2.1% | MT 12.9 |
| 17 | WA 48,443 | CA 2.1% | UT 12.6 |
| 18 | MO 40,867 | AZ 2.0% | CA 12.0 |
| 19 | NV 40,563 | UT 1.9% | AZ 11.4 |
| 20 | AR 34,192 | MI 1.8% | SD 11.0 |
| US 2,033,000 | US 1.4% | US 8.1 |
Between November 2014 and November 2015, Bureau of Labor Statistics (BLS) data shows the total number of employed in California increased by 364,712 (seasonally adjusted), or 17.9% of the total net employment gains in this period for the US. Measured by percentage change in employment over the year, California dropped from 14th to 17th highest. Adjusted for population, California dropped from 16th to 18th.
Labor Force Participation Rate Remains at 62.0%–Another New Low
California’s participation rate (seasonally adjusted) declined another 0.1% to 62.0%. The comparable US rate increased 0.1% to 62.5%.
California’s seasonally adjusted labor force participation rate continues to drop below the previous lows recorded in 1976. This latest decline trend since February 2013 has been a key factor in the improvement in the state’s unemployment rate, as persons have left the labor force and are no longer counted among the unemployed. As indicated in previous months’ reports, the continuing decline in labor force participation is a structural change producing comparatively fewer income earners per household, and thereby lower total income for some households that in turn reduce housing affordability and increase the relative incidence of cost-of-living adjusted poverty. Continuing declines in the number of income earners relative to the economy further has long term implications to the stability of public revenues and demand on public services.
Nonfarm Jobs Increase 5,500
EDD reported that between October and November 2015, seasonally adjusted nonfarm payroll jobs increased by 5,500. The October job gains were revised downwards slightly to 40,600 from the preliminary estimate of 41,200.
Looking at the not seasonally adjusted numbers, the change in total payroll jobs from October 2015 saw the largest increases in Retail Trade (72,100) as the holiday season began, Government (23,800), and Educational Services (6,300). Biggest declines were in Farm (-51,100), Manufacturing (-8,400), Information (-4,400), Construction (-4,300), and Arts, Entertainment & Recreation (-3,800).
| Not Seasonally Adjusted Payroll Jobs | Oct 2015 | Nov 2015 | Change Nov 2015 – Oct 2015 | Change Nov 2015 – Nov 2014 |
|---|---|---|---|---|
| Total Farm | 457,500 | 406,400 | -51,100 | 6,600 |
| Mining & Logging | 29,400 | 28,600 | -800 | -3,000 |
| Construction | 750,700 | 746,400 | -4,300 | 42,200 |
| Manufacturing | 1,273,100 | 1,264,700 | -8,400 | -4,000 |
| Wholesale Trade | 744,800 | 746,900 | 2,100 | 18,200 |
| Retail Trade | 1,682,800 | 1,754,900 | 72,100 | 39,900 |
| Transportation, Warehousing & Utilities | 549,400 | 551,000 | 1,600 | 11,000 |
| Information | 478,000 | 473,600 | -4,400 | 6,700 |
| Finance & Insurance | 518,500 | 518,900 | 400 | -3,000 |
| Real Estate & Rental & Leasing | 273,600 | 272,900 | -700 | 4,700 |
| Professional, Scientific & Technical Services | 1,282,400 | 1,282,600 | 200 | 65,900 |
| Management of Companies & Enterprises | 232,300 | 233,600 | 1,300 | 6,100 |
| Administrative & Support & Waste Services | 1,103,500 | 1,100,400 | -3,100 | 44,300 |
| Educational Services | 376,600 | 382,900 | 6,300 | 9,400 |
| Health Care & Social Assistance | 2,152,100 | 2,152,400 | 300 | 62,100 |
| Individual & Family Services | 586,400 | 584,200 | -2,200 | 4,700 |
| Arts, Entertainment, & Recreation | 286,600 | 282,800 | -3,800 | 10,200 |
| Accommodation & Food Service | 1,567,300 | 1,565,300 | -2,000 | 68,900 |
| Other Services | 553,700 | 551,700 | -2,000 | 3,800 |
| Government | 2,484,400 | 2,508,200 | 23,800 | 39,200 |
| Total Nonfarm | 16,339,200 | 16,417,800 | 78,600 | 422,600 |
| Total Wage & Salary | 16,796,700 | 16,824,200 | 27,500 | 429,200 |
By total number of new jobs, California had the highest increase in seasonally adjusted nonfarm jobs among the states from November 2014 to November 2015, at 417,100 or 15.8% of the US net increase. By percentage growth in jobs, California dropped from 6th to 7th highest, and by population adjusted jobs growth, went from 5th to 10th highest.
| Rank | Number of Jobs | Percentage Change | Population Adjusted (job growth per 1,000 civilian noninstitutional population) |
|---|---|---|---|
| 1 | CA 417,100 | IA 4.2% | UT 22.2 |
| 2 | FL 239,600 | UT 3.6% | IA 22.0 |
| 3 | TX 179,300 | FL 3.0% | SD 16.8 |
| 4 | NM 172,000 | WA 2.9% | WA 15.9 |
| 5 | GA 92,900 | OR 2.8% | DE 15.0 |
| 6 | NV 91,200 | SC 2.6% | OR 14.9 |
| 7 | WA 89,300 | CA 2.6% | FL 14.7 |
| 8 | ME 76,800 | SD 2.6% | ME 13.9 |
| 9 | OH 75,800 | ND 2.5% | ND 13.7 |
| 10 | MI 71,900 | AR 2.5% | CA 13.6 |
| US 2,637,000 | US 1.9% | US 10.5 |
Four Industries Remain Below 2007 Pre-Recession Job Levels
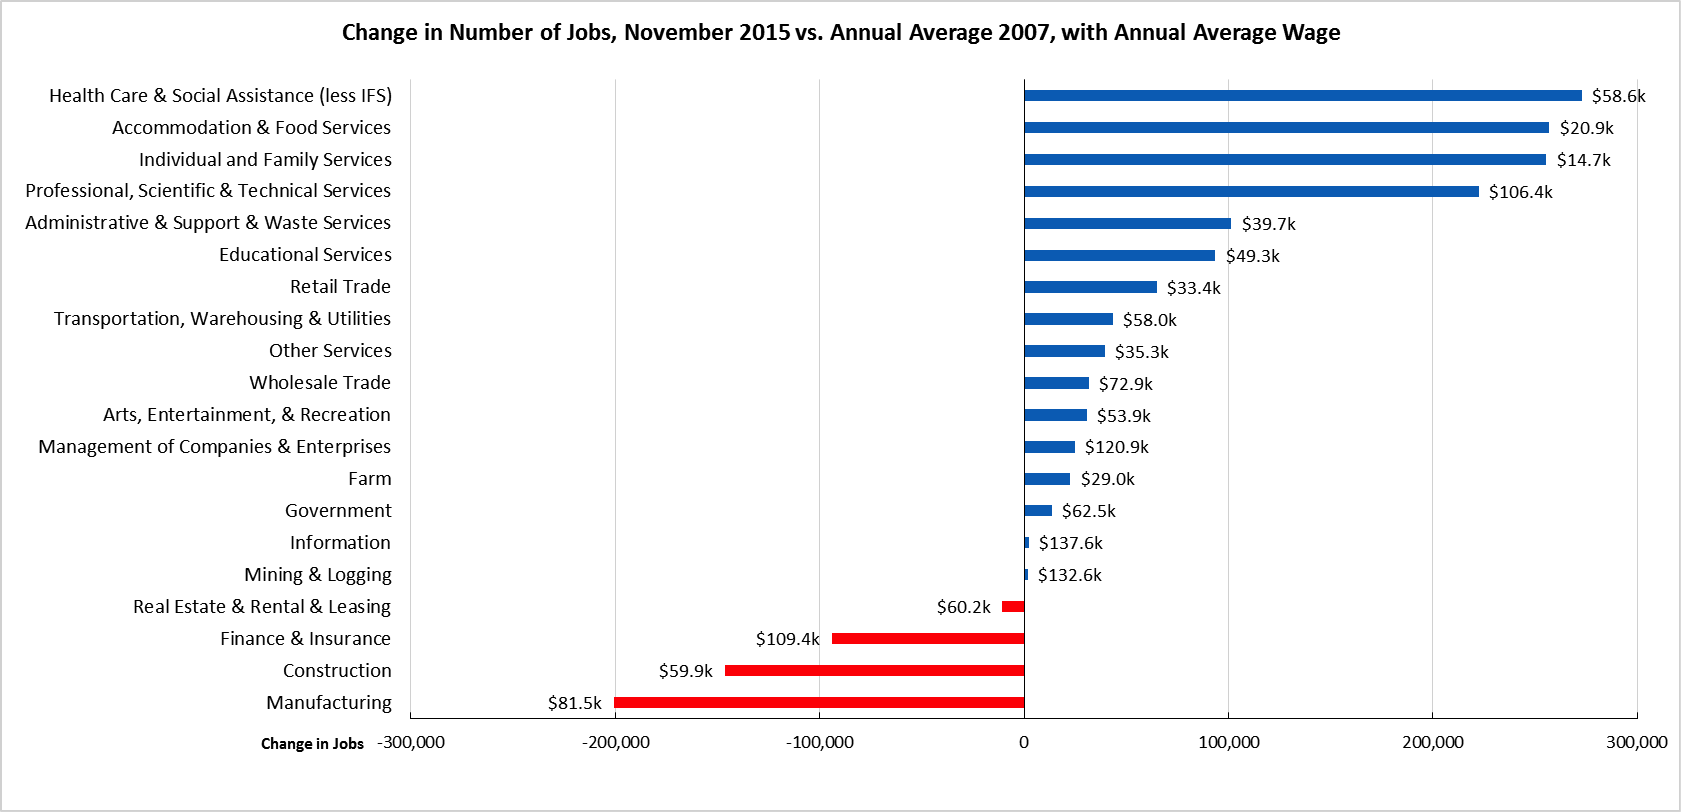
Comparing the number of jobs by industry in November 2015 (not seasonally adjusted), the number of industries remaining below the 2007 pre-recession levels finally dropped to only 4 as holiday season hiring lifted Retail Trade into positive numbers and growth in Government hiring remained strong. However, the negative balance for all 4 industries below the 2007 line grew in November, and Mining & Logging (+1,900) which includes oil and gas employment and Information (+2,500) only remained slightly in positive territory. In the highest gain industries, Accommodation & Food Services for the first month moved into 2nd place overall and surpassed Individual & Family Services as the highest growth lower wage industry.
Six Counties Remain in Double-Digit Unemployment, 12 are 5% or Less

Two-Tier Economy Persists
Unemployment rates (all data is not seasonally adjusted) continue to vary widely across the state, ranging from 4.0% in the Bay Area to more than double at 9.6% in the Central Valley.
| Not Seasonally Adjusted | Unemployment Rate (%) September 2015 |
|---|---|
| California | 5.7 |
| Bay Area | 4.0 |
| Orange County | 4.2 |
| Sacramento Region | 5.5 |
| San Diego/Imperial | 5.6 |
| Los Angeles | 5.7 |
| Inland Empire | 6.1 |
| Central Sierra | 6.4 |
| Central Coast | 6.5 |
| Upstate California | 7.4 |
| Central Valley | 9.6 |
Ratio of Highest to Lowest Rate: 2.38
By County:
| Lowest 3 Unemployment Rates | |
|---|---|
| San Mateo County | 3.1 |
| Marin County | 3.3 |
| San Francisco County | 3.4 |
| Highest 3 Unemployment Rates | |
|---|---|
| Tulare County | 11.1 |
| Colusa County | 15.5 |
| Imperial County | 20.4 |
Ratio of Highest to Lowest Rate: 6.58
By Legislative District:
| Lowest 10 Unemployment Rates | |||
|---|---|---|---|
| SD 13 (Hill – D) | 3.0 | AD 22 (Mullin – D) | 2.9 |
| SD 11 (Leno – D) | 3.4 | AD 16 (Baker – D) | 3.0 |
| SD 37 (Moorlach – R) | 3.5 | AD 24 (Gordon – R) | 3.1 |
| SD 39 (Block – D) | 3.9 | AD 28 (Low – D) | 3.2 |
| SD 15 (Beall – D) | 4.0 | AD 19 (Ting – D) | 3.4 |
| SD 36 (Bates – R) | 4.0 | AD 17 (Chiu – D) | 3.4 |
| SD 07 (Glazer – D) | 4.2 | AD 77 (Maienschein – R) | 3.4 |
| SD 10 (Wieckowski – D) | 4.3 | AD 74 (Harper – R) | 3.5 |
| SD 26 (Allen – D) | 4.3 | AD 73 (Brough – R) | 3.5 |
| SD 02 (McGuire – D) | 4.5 | AD 68 (Wagner – R) | 3.5 |
| Highest 10 Unemployment Rates | |||
|---|---|---|---|
| SD 33 (Lara – D) | 6.6 | AD 12 (Olsen – R) | 7.6 |
| SD 24 (de León – D) | 6.7 | AD 03 (Gallagher – R) | 7.9 |
| SD 35 (Hall – D) | 6.7 | AD 64 (Gipson – D) | 8.3 |
| SD 04 (Nielsen – R) | 6.8 | AD 23 (Patterson – R) | 8.5 |
| SD 16 (Fuller – R) | 8.2 | AD 13 (Eggman – D) | 9.1 |
| SD 08 (Berryhill – R) | 8.2 | AD 26 (Mathis – R) | 10.8 |
| SD 05 (Galgiani – D) | 8.4 | AD 21 (Gray – D) | 10.9 |
| SD 40 (Hueso – D) | 9.1 | AD 32 (Salas – D) | 11.2 |
| SD 12 (Cannella – R) | 9.7 | AD 31 (Perea – D) | 11.6 |
| SD 14 (Vidak – R) | 12.1 | AD 56 (Garcia – D) | 12.4 |
Ratio of Highest to Lowest Rate: Senate 4.07
Ratio of Highest to Lowest Rate: Assembly 4.28
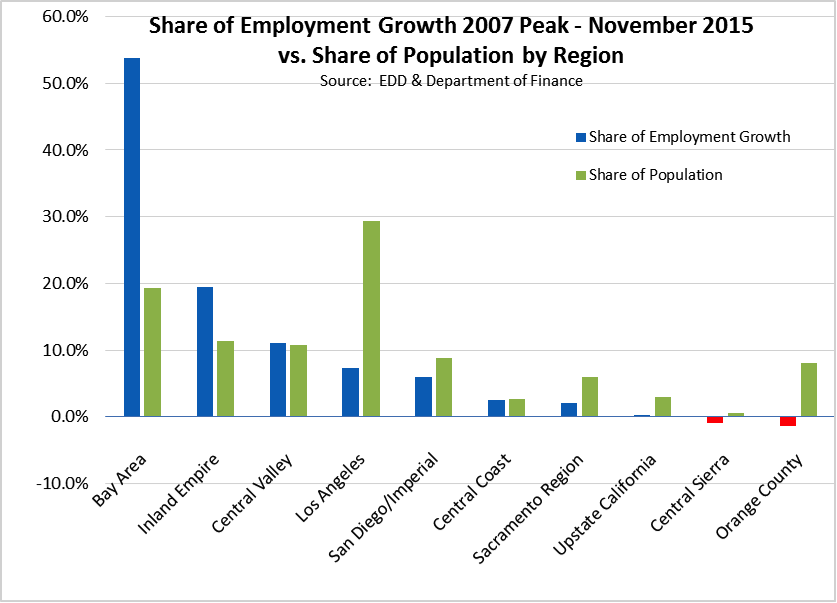
Bay Area Continues to Dominate Employment Growth
Bay Area continues to dominate employment growth in the state, capturing 53.8% of the state’s net employment growth since the 2007 pre-recession peak (November 2007), while containing only 19.4% of the state population. Inland Empire continues to show employment growth larger relative to their share of the population. Los Angeles Region with 29.4% of the population, contains only 7.4% of the state’s net employment growth since the pre-recession peak.
Note: All data sources, methodologies, and historical data series available at CenterforJobs.org.