Highlights for policy makers:
- Unemployment Rate Drops to 5.3%; Total Employment Up 47,000
- Labor Force Participation Rate Level at 62.8%
- State Employment Growth Rankings
- Nonfarm Jobs Increase 13,600
- Five Industries below 2007 Pre-Recession Job Levels
- Two-Tier Economy Persists
- Eight California MSAs in the 10 Worst Unemployment Rates Nationally
- K-12 Enrollment Projections
- Updated Poverty Rates
- Commuting Data Update: Californians Still Rely on Single-Occupant Vehicles to Get to Work
Unemployment Rate Drops to 5.3%; Total Employment Up 47,000
The Labor Force data for November 2016 (seasonally adjusted; California preliminary) is shown below, along with the change from the prior month:
| Seasonally Adjusted | California | US | ||
|---|---|---|---|---|
| Nov 2016 | Change from Oct 2016 | Nov 2016 | Change from Oct 2016 | |
| Unemployment Rate | 5.3 | -0.2 | 4.9 | -0.1 |
| Labor Force | 19,454,400 | 0.1% | 159,712,000 | -0.1% |
| Participation Rate | 62.8 | 0.0 | 62.8 | -0.1 |
| Employment | 18,416,600 | 0.3% | 151,925,000 | 0.0% |
| Unemployment | 1,037,700 | -3.0% | 7,787,000 | -1.9% |
The related not seasonally adjusted numbers (California preliminary), with the change from November 2015:
| Not Seasonally Adjusted | California | US | ||
|---|---|---|---|---|
| Nov 2016 | Change from Nov 2015 | Nov 2016 | Change from Nov 2015 | |
| Unemployment Rate | 5.0 | -0.8 | 4.4 | -0.4 |
| Labor Force | 19,358,000 | 1.9% | 159,451,000 | 1.3% |
| Participation Rate | 62.5 | 0.5 | 62.6 | 0.1 |
| Employment | 18,381,600 | 2.7% | 152,385,000 | 1.7% |
| Unemployment | 976,400 | -11.4% | 7,066,000 | -6.7% |
California Employment Development Department’s (EDD) latest release shows on a seasonally adjusted basis, total employment grew by 47,000 from October, while the number of unemployed declined by 31,800. Most of the movement in the unemployment rate came from the shift from unemployed to employed, as the labor force only grew by 15,300.
After holding steady at 5.5% for four months, California’s seasonally adjusted unemployment rate dropped to 5.3%. California tied with Georgia, Rhode Island, and Washington for the 10th highest unemployment rate among the states. The unadjusted rate dropped from 5.8% in November 2015 to 5.0%.
Total US employment saw a seasonally adjusted increase of 160,000 from October, while the number of unemployed dropped by 387,000. The national unemployment rate dropped 0.3 points to 4.6%.
Labor Force Participation Rate Level at 62.8%
California’s participation rate (seasonally adjusted) remained constant at 62.8% in November, while the US rate continued to ease marginally by 0.1 point to 62.7%. The California participation rate has improved over the past five months, but has yet to rebound to levels that would constitute recovery. The overall rate still remains near the previous lows from 1976, and well below the average pre-recession level of 65.6% in 2007.
State Employment Growth Rankings
| Rank | Number of Employed | Percentage Change | Population Adjusted (employment growth per 1,000 civilian noninstitutional population) |
|---|---|---|---|
| 1 | CA 550,600 | OR 5.0% | OR 28.9 |
| 2 | TX 266,100 | TN 5.0% | TN 27.8 |
| 3 | GA 191,000 | GA 4.2% | ND 26.0 |
| 4 | FL 185,500 | WA 4.1% | WA 24.4 |
| 5 | TN 144,400 | AZ 3.8% | GA 24.4 |
| 6 | WA 138,300 | ND 3.8% | CO 22.7 |
| 7 | NC 128,900 | KY 3.7% | AZ 21.5 |
| 8 | AZ 114,000 | CO 3.6% | UT 21.3 |
| 9 | MI 111,400 | UT 3.2% | KY 19.8 |
| 10 | MA 108,500 | MA 3.2% | MA 19.7 |
| 11 | CO 97,000 | CA 3.1% | CA 18.0 |
| 12 | OR 93,900 | SC 3.0% | ME 17.4 |
| 13 | IN 76,600 | ME 2.9% | HI 16.6 |
| 14 | KY 68,300 | NC 2.9% | SC 16.5 |
| 15 | SC 63,500 | HI 2.8% | NC 16.5 |
| 16 | IL 57,100 | AL 2.7% | NH 15.7 |
| 17 | AL 54,700 | MI 2.5% | IN 14.9 |
| 18 | MD 54,300 | IN 2.4% | AL 14.4 |
| 19 | WI 46,800 | NH 2.4% | MI 14.1 |
| 20 | UT 46,100 | TX 2.1% | DC 13.3 |
| 21 | CT 27,600 | DC 2.0% | TX 12.9 |
| 22 | AR 24,300 | FL 2.0% | MD 11.5 |
| 23 | PA 23,100 | AR 1.9% | FL 11.3 |
| 24 | VA 21,900 | MD 1.8% | AR 10.5 |
| 25 | ME 19,000 | WV 1.7% | WI 10.3 |
| US 2,641,000 | US 1.8% | US 10.4 |
Between November 2015 and November 2016, Bureau of Labor Statistics (BLS) data shows the total number of employed in California increased by 550,600 (seasonally adjusted), or 20.8% of the total net employment gains in this period for the US. Measured by percentage change in employment over the year, California dropped to 11th highest. Adjusted for population, California also dropped to 11th.
Nonfarm Jobs Increase 13,600
EDD reported that between October and November 2016, seasonally adjusted nonfarm wage and salary jobs grew 13,600 in November. October’s gains were revised upwards slightly to 34,400 from the previously reported gain of 31,200.
Looking at the not seasonally adjusted numbers, hiring saw increases in all but two industries. The change in total payroll jobs from November 2015 saw the largest increases in Government (73,100), Health Care & Social Assistance (58,400), and Professional, Scientific & Technical Services (47,800). Declines were in Manufacturing (-7,900) and Mining & Logging (-1,700).
| Not Seasonally Adjusted Payroll Jobs | Oct 2016 | Nov 2016 | Change Nov 2016 – Oct 2016 | Change Nov 2016 – Nov 2015 |
|---|---|---|---|---|
| Total Farm | 457,600 | 401,100 | -56,500 | 2,200 |
| Mining & Logging | 25,200 | 25,000 | -200 | -3,200 |
| Construction | 781,800 | 783,900 | 2,100 | 35,500 |
| Manufacturing | 1,281,300 | 1,278,200 | -3,100 | -7,900 |
| Wholesale Trade | 738,500 | 744,500 | 6,000 | 13,800 |
| Retail Trade | 1,697,600 | 1,763,700 | 66,100 | 21,600 |
| Transportation, Warehousing & Utilities | 576,400 | 586,000 | 9,600 | 15,200 |
| Information | 500,600 | 501,500 | 900 | 12,000 |
| Finance & Insurance | 531,300 | 533,100 | 1,800 | 5,300 |
| Real Estate & Rental & Leasing | 285,700 | 282,900 | -2,800 | 8,300 |
| Professional, Scientific & Technical Services | 1,274,300 | 1,272,500 | -1,800 | 47,800 |
| Management of Companies & Enterprises | 233,700 | 234,000 | 300 | 1,600 |
| Administrative & Support & Waste Services | 1,106,300 | 1,111,500 | 5,200 | 18,000 |
| Educational Services | 384,100 | 387,600 | 3,500 | 23,400 |
| Health Care & Social Assistance | 2,210,400 | 2,209,700 | -700 | 58,400 |
| Individual & Family Services | 603,300 | 602,200 | -1,100 | 18,400 |
| Arts, Entertainment, & Recreation | 306,200 | 298,200 | -8,000 | 10,700 |
| Accommodation & Food Service | 1,608,800 | 1,600,300 | -8,500 | 38,800 |
| Other Services | 557,600 | 556,800 | -800 | 6,500 |
| Government | 2,561,600 | 2,585,700 | 24,100 | 73,100 |
| Total Nonfarm | 16,661,400 | 16,755,100 | 93,700 | 378,900 |
| Total Wage & Salary | 17,119,000 | 17,156,200 | 37,200 | 381,100 |
By total number of new jobs, California had the highest increase in seasonally adjusted nonfarm jobs among the states from November 2015 to November 2016, at 377,200 or 16.7% of the US net increase. By percentage growth in jobs, California dropped to 9th highest, and by population adjusted jobs growth, 14th highest.
| Rank | Number of Jobs | Employment Growth (%) | Population Adjusted (job growth per 1,000 civilian noninstitutional population) |
|---|---|---|---|
| 1 | CA 377,200 | FL 3.2% | DC 24.8 |
| 2 | FL 263,900 | WA 3.1% | UT 19.0 |
| 3 | TX 210,800 | UT 3.0% | WA 17.0 |
| 4 | NY 104,500 | OR 2.9% | OR 16.1 |
| 5 | GA 98,700 | NV 2.7% | FL 15.8 |
| 6 | WA 97,500 | HI 2.5% | SD 15.5 |
| 7 | MI 84,000 | ID 2.4% | NV 15.0 |
| 8 | NC 81,800 | SD 2.4% | HI 14.2 |
| 9 | MA 70,100 | CA 2.3% | NH 13.4 |
| 10 | MO 57,100 | GA 2.3% | ID 12.8 |
| 11 | TN 55,600 | SC 2.2% | CO 12.7 |
| 12 | CO 55,300 | NH 2.2% | MA 12.6 |
| 13 | OR 53,000 | CO 2.2% | GA 12.4 |
| 14 | OH 49,800 | MO 2.1% | CA 12.2 |
| 15 | SC 45,300 | MA 2.0% | MO 11.9 |
| 16 | IL 43,000 | MI 2.0% | SC 11.6 |
| 17 | UT 42,100 | NC 1.9% | MI 10.6 |
| 18 | IN 39,500 | TN 1.9% | TN 10.6 |
| 19 | PA 38,900 | DC 1.8% | NC 10.3 |
| 20 | VA 37,500 | TX 1.8% | TX 10.0 |
| US 2,253,000 | US 1.6% | US 8.9 |
Five Industries Below 2007 Pre-Recession Job Levels
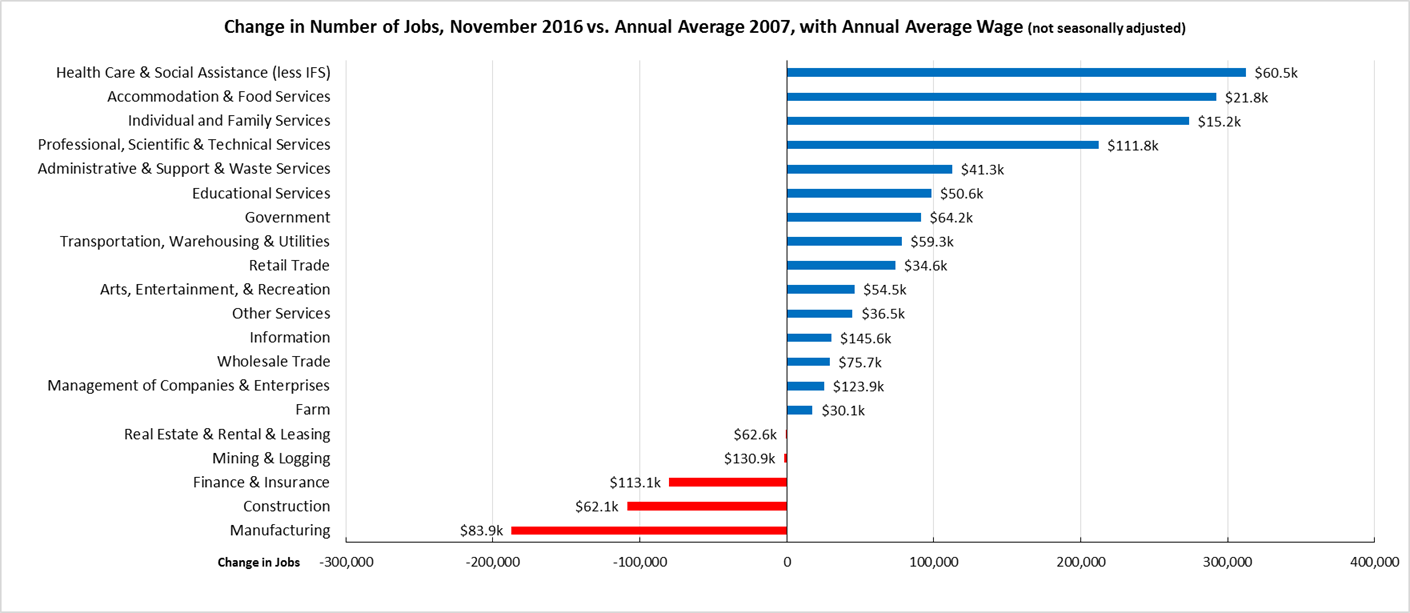
Comparing the number of jobs by industry in November 2016 (not seasonally adjusted), 5 industries had employment below the 2007 pre-recession levels. In the highest gain industries, Health Care & Social Assistance (less IFS) remained the leading industry, followed by the two lowest wage industries (Accommodation & Food Services and Individual & Family Services) and higher wage Professional, Scientific & Technical Services. Of the lagging industries, three—Manufacturing, Mining & Logging, and Construction—are blue collar middle class wage industries, while the higher wage Finance & Insurance also continued to lose ground.
Two-Tier Economy Persists
Unemployment rates (all data is not seasonally adjusted) continue to vary widely across the state, ranging from 3.6% in the Bay Area to 2-1/2 times as large at 9.0% in the Central Valley.
| Not Seasonally Adjusted | Unemployment Rate (%) November 2016 |
|---|---|
| California | 5.0 |
| Bay Area | 3.6 |
| Orange County | 3.7 |
| Los Angeles | 4.8 |
| Sacramento Region | 4.9 |
| San Diego/Imperial | 5.1 |
| Inland Empire | 5.5 |
| Central Sierra | 5.6 |
| Central Coast | 5.7 |
| Upstate California | 6.6 |
| Central Valley | 9.0 |
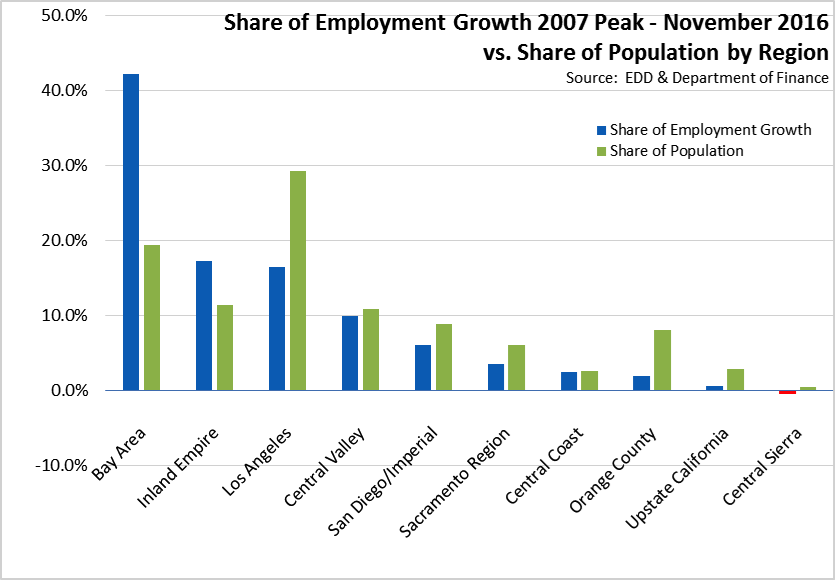
Containing just under 20% of the state’s population, the Bay Area was responsible for 42.2% of the net growth in employment since the pre-recession peak in 2007. Los Angeles Region, falling to third place behind Inland Empire, has only 16.4% of net employment gains and just under 30% of the total population.
By Legislative District:
| Lowest 10 Unemployment Rates | |||||
|---|---|---|---|---|---|
| CD18 (Eshoo-D) | 2.9 | SD13 (Hill-D) | 2.7 | AD16 (Baker-R) | 2.6 |
| CD12 (Pelosi-D) | 2.9 | SD11 (Wiener-D) | 3.1 | AD22 (Mullin-D) | 2.6 |
| CD45 (Walters-R) | 3.0 | SD37 (Moorlach-R) | 3.2 | AD24 (Berman-D) | 2.8 |
| CD52 (Peters-D) | 3.1 | SD39 (Atkins-D) | 3.4 | AD28 (Low-D) | 2.9 |
| CD14 (Speier-D) | 3.2 | SD36 (Bates-R) | 3.5 | AD74 (Harper-R) | 3.1 |
| CD17 (Khanna-D) | 3.2 | SD26 (Allen-D) | 3.6 | AD17 (Chiu-D) | 3.1 |
| CD33 (Lieu-D) | 3.4 | SD15 (Beall-D) | 3.7 | AD77 (Maienschein-R) | 3.1 |
| CD48 (Rohrabacher-R) | 3.6 | SD07 (Glazer-D) | 3.7 | AD19 (Ting-D) | 3.1 |
| CD27 (Chu-D) | 3.6 | SD10 (Wieckowski-D) | 3.8 | AD73 (Brough-R) | 3.2 |
| CD39 (Royce-R) | 3.7 | SD25 (Portantino-D) | 3.9 | AD68 (Choi-R) | 3.3 |
| Highest 10 Unemployment Rates | |||||
|---|---|---|---|---|---|
| CD41 (Takano-D) | 6.4 | SD21 (Wilk-R) | 5.7 | AD64 (Gipson-D) | 7.0 |
| CD20 (Panetta-D) | 6.4 | SD31 (Roth-D) | 5.7 | AD03 (Gallagher-R) | 7.2 |
| CD44 (Barragán-D) | 6.6 | SD35 (Bradford-D) | 5.8 | AD34 (Fong-R) | 7.5 |
| CD09 (McNerney-D) | 7.2 | SD04 (Nielsen-R) | 6.1 | AD23 (Patterson-R) | 8.3 |
| CD10 (Denham-R) | 7.5 | SD05 (Galgiani-D) | 7.5 | AD13 (Eggman-D) | 8.3 |
| CD23 (McCarthy-R) | 8.1 | SD08 (Berryhill-R) | 7.7 | AD21 (Gray-D) | 9.5 |
| CD22 (Nunes-R) | 8.9 | SD16 (Fuller-R) | 8.0 | AD26 (Mathis-R) | 10.5 |
| CD16 (Costa-D) | 10.1 | SD12 (Cannella-R) | 8.4 | AD31 (Arambula-D) | 10.6 |
| CD51 (Vargas-D) | 10.2 | SD40 (Hueso-D) | 8.6 | AD32 (Salas-D) | 11.1 |
| CD21 (Valadao-R) | 10.7 | SD14 (Vidak-R) | 11.7 | AD56 (Garcia-D) | 11.8 |
Eight California MSAs in the 10 Worst Unemployment Rates Nationally
Of the 10 Metropolitan Statistical Areas (MSAs) with the worst unemployment rates nationally, 8 are in California. Of the 20 worst, 10 are in California.
| US Rank | MSA | October 2016 Unemployment Rate |
|---|---|---|
| 378 | Yuba City, CA Metropolitan Statistical Area | 8.2 |
| 379 | Farmington, NM Metropolitan Statistical Area | 8.3 |
| 380 | Madera, CA Metropolitan Statistical Area | 8.4 |
| 381 | Merced, CA Metropolitan Statistical Area | 8.6 |
| 382 | Hanford-Corcoran, CA Metropolitan Statistical Area | 9.0 |
| 383 | Bakersfield, CA Metropolitan Statistical Area | 9.1 |
| 384 | Fresno, CA Metropolitan Statistical Area | 9.2 |
| 385 | Visalia-Porterville, CA Metropolitan Statistical Area | 10.8 |
| 386 | Yuma, AZ Metropolitan Statistical Area | 19.4 |
| 387 | El Centro, CA Metropolitan Statistical Area | 22.0 |
K-12 Enrollment Projections
Department of Finance has released a new demographic series, providing historical and projected K-12 enrollment and graduation numbers.
For California as a whole, K-12 enrollment in 2015-16 was at 4.2% higher than the 2000-01 level, at 6.2 million students. By 2025-26, enrollment is projected to decline by 2.7% to 6.1 million. These changes, however, vary by region.
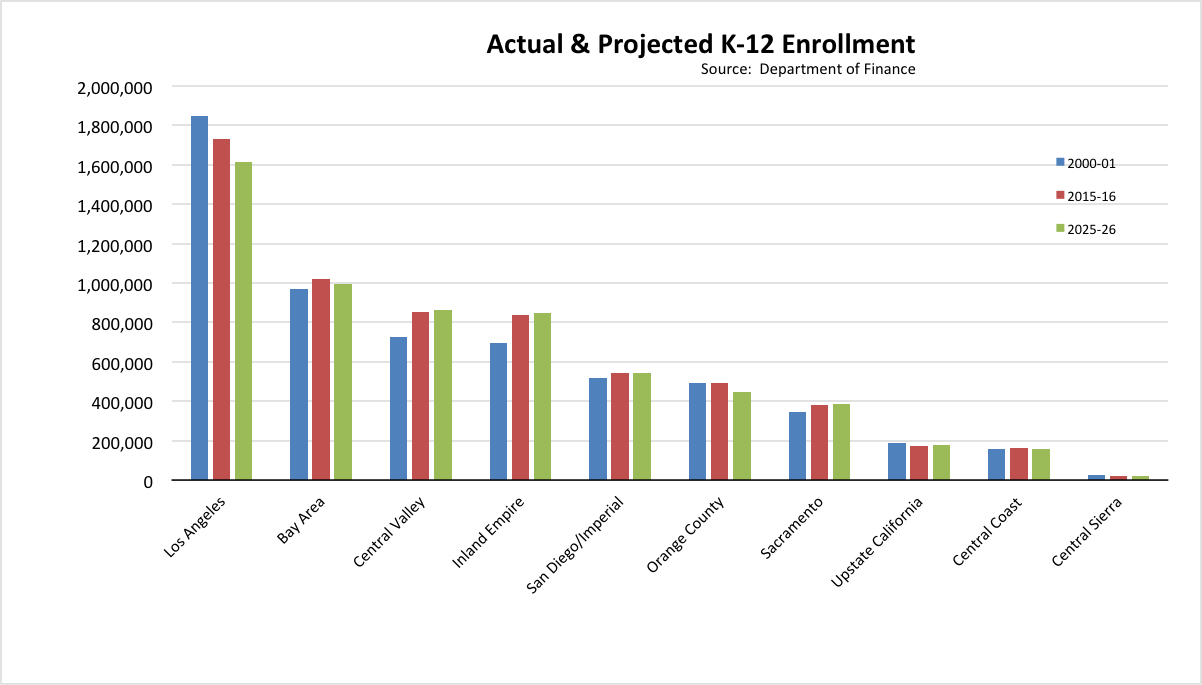
For most regions, enrollment is projected to essentially level off or decline slightly through 2025-26. Growth is expected in Central Sierra (3.1%), Upstate California (2.3%), Inland Empire (1.5%), Central Valley (1.3%), and Sacramento (1.2%). The largest declines are projected for Orange County (9.5%), Los Angeles (7.8%), and Central Coast (4.2%).
Updated Poverty Rates
The Economic Indicator poverty rate data has been updated from the latest Census data release. As with the state, the poverty rates using the official federal poverty income levels have improved for most subregions. These rates, however, do not reflect the differing cost of living levels especially for housing and energy, nor do they include additions to household incomes from most government income assistance programs from both federal and state sources.
By region, the 2015 poverty rates vary widely from 10.1% in Bay Area to more than twice as high at 22.5% in Central Valley. And while the poverty rates in general continue to improve, all regions of the state remain above the pre-recession levels in 2007.
| Region | 2007 | 2014 | 2015 |
|---|---|---|---|
| California | 12.4% | 16.4% | 15.4% |
| Bay Area | 9.0% | 10.4% | 10.1% |
| Orange County | 8.9% | 12.9% | 12.7% |
| Central Sierra | 11.2% | 13.8% | 13.5% |
| San Diego/Imperial | 11.6% | 15.2% | 14.4% |
| Central Coast | 11.5% | 15.9% | 14.7% |
| Sacramento | 11.0% | 15.9% | 14.8% |
| Los Angeles | 14.1% | 18.1% | 16.2% |
| Inland Empire | 11.9% | 18.7% | 17.5% |
| Upstate California | 16.1% | 19.2% | 20.1% |
| Central Valley | 17.8% | 24.1% | 22.5% |
By Congressional and Legislative District, the estimated 2015 poverty rates show even wider variations.
| Lowest 10 Poverty Rates | |||||
|---|---|---|---|---|---|
| CD17 (Khanna-D) | 6.6% | SD13 (Hill-D) | 7.4% | AD16 (Baker-R) | 4.3% |
| CD18 (Eshoo-D) | 6.6% | SD07 (Glazer-D) | 8.2% | AD28 (Low-D) | 6.1% |
| CD15 (Swalwell-D) | 7.6% | SD10 (Wieckowski-D) | 8.3% | AD77 (Maienschein-R) | 6.2% |
| CD33 (Lieu-D) | 8.3% | SD15 (Beall-D) | 9.1% | AD73 (Brough-R) | 6.6% |
| CD45 (Walters-R) | 8.8% | SD27 (Stern-D) | 9.3% | AD25 (Chu-D) | 6.9% |
| CD14 (Speier-D) | 8.8% | SD36 (Bates-R) | 9.5% | AD38 (Acosta-R) | 7.0% |
| CD52 (Peters-D) | 9.2% | SD26 (Allen-D) | 9.9% | AD22 (Mullin-D) | 7.1% |
| CD04 (McClintock-R) | 9.9% | SD37 (Moorlach-R) | 10.3% | AD06 (Kiley-R) | 7.4% |
| CD39 (Royce-R) | 10.1% | SD25 (Portantino-D) | 11.1% | AD24 (Berman-D) | 7.5% |
| CD42 (Calvert-R) | 10.5% | SD32 (Mendoza-D) | 11.4% | AD66 (Muratsuchi-D) | 7.9% |
| Highest 10 Poverty Rates | |||||
|---|---|---|---|---|---|
| CD36 (Ruiz-D) | 20.1% | SD21 (Wilk-R) | 18.6% | AD51 (Gomez-D) | 22.4% |
| CD29 (Cárdenas-D) | 20.3% | SD20 (Leyva-D) | 18.7% | AD33 (Obernolte-R) | 23.2% |
| CD06 (Matsui-D) | 21.3% | SD06 (Pan-D) | 18.8% | AD64 (Gipson-D) | 24.2% |
| CD08 (Cook-R) | 21.3% | SD35 (Bradford-D) | 19.2% | AD56 (Garcia-D) | 24.3% |
| CD44 (Barragán-D) | 21.6% | SD40 (Hueso-D) | 19.8% | AD21 (Gray-D) | 25.0% |
| CD51 (Vargas-D) | 23.5% | SD33 (Lara-D) | 22.5% | AD26 (Mathis-R) | 26.6% |
| CD40 (Roybal-Allard-D) | 25.5% | SD12 (Cannella-R) | 22.9% | AD32 (Salas-D) | 29.1% |
| CD34 (Becerra-D) | 26.3% | SD24 (de León-D) | 24.7% | AD53 (Santiago-D) | 29.1% |
| CD21 (Valadao-R) | 29.4% | SD30 (Mitchell-D) | 25.8% | AD31 (Arambula-D) | 33.4% |
| CD16 (Costa-D) | 30.1% | SD14 (Vidak-R) | 32.6% | AD59 (Jones-Sawyer-D) | 34.2% |
Additional data for all geographic areas are in the Economic Indicators.
Commuting Data Update: Californians Still Rely on Single-Occupant Vehicles to Get to Work
In March, the Center released an analysis of Census Bureau commuting data, assessing the different transportation modes Californians use for commuting to their work. The data from 1980 to 2014 showed that even with the well-documented and rapidly rising costs of the state’s traffic congestion and costs associated with the deteriorating condition of the state’s roads, California workers continue to rely on single occupant vehicles for the primary mode of commuting. The data show that the number of workers combined using public transit, carpools, and other modes such as bicycles and walking had increased only 0.42 million between 1980 and 2014 to a total of 3.6 million. In this same period, the number of California workers relying on single-occupant vehicles on the state’s increasingly crowded and deteriorating roads grew by 5.5 million to a total of 12.7 million. The only other mode showing significant increases was working at home, growing at the second highest rate of 0.7 million to a total of 0.9 million. The analysis also indicated that further substantial increases in working at home at this level were unlikely given the increasing complexity and restrictions under state employment law.
Recent updates released by the Census Bureau show that the trends identified in this analysis continued into 2015. For the state as a whole, nearly all of the increase in number of workers chose to commute in single occupant vehicles, while as expected, the growth in working at home began to slow.
| Year | Workers | Drove Alone | Carpool | Public Transit | Other | Work at Home |
|---|---|---|---|---|---|---|
| 1980 | 10.59 | 7.18 | 1.79 | 0.61 | 0.81 | 0.20 |
| 2014 | 17.25 | 12.68 | 1.81 | 0.91 | 0.91 | 0.93 |
| 2015 | 17.63 | 13.03 | 1.76 | 0.92 | 0.93 | 0.97 |
Rates vary considerably by Congressional and Legislative District. Selected data for the highest and lowest districts (by percentage of workers using single occupant vehicles) are shown below:
| District | Drove Alone | Public Transit | District | Drove Alone | Public Transit | District | Drove Alone | Public Transit |
|---|---|---|---|---|---|---|---|---|
| CD12 (Pelosi-D) | 34.1% | 33.5% | SD11 (Wiener-D) | 39.3% | 31.3% | AD17 (Chiu-D) | 31.1% | 34.3% |
| CD13 (Lee-D) | 52.7% | 19.2% | SD09 (Skinner-D) | 54.9% | 17.8% | AD19 (Ting-D) | 47.9% | 28.0% |
| CD34 (Becerra-D) | 56.7% | 21.4% | SD24 (de León-D) | 58.9% | 19.6% | AD15 (Thurmond-D) | 51.5% | 17.9% |
| CD11 (DeSaulnier-D) | 66.5% | 12.3% | SD30 (Mitchell-D) | 66.5% | 12.9% | AD53 (Santiago-D) | 51.7% | 26.2% |
| CD14 (Speier-D) | 66.5% | 13.4% | SD13 (Hill-D) | 71.3% | 6.7% | AD18 (Bonta-D) | 58.2% | 17.9% |
| CD40 (Roybal-Allard-D) | 68.4% | 10.1% | SD33 (Lara-D) | 71.4% | 8.3% | AD59 (Jones-Sawyer-D) | 59.8% | 17.2% |
| CD37 (Bass-D) | 69.2% | 10.5% | SD14 (Vidak-R) | 71.8% | 1.2% | AD51 (Gomez-D) | 65.9% | 12.2% |
| CD02 (Huffman-D) | 70.0% | 4.8% | SD19 (Jackson-D) | 71.8% | 2.3% | AD10 (Levine-D) | 69.4% | 6.3% |
| CD24 (Carbajal-D) | 70.1% | 2.6% | SD02 (McGuire-D) | 71.9% | 4.0% | AD50 (Bloom-D) | 69.9% | 4.4% |
| CD20 (Panetta-D) | 70.3% | 2.4% | SD07 (Glazer-D) | 72.0% | 8.5% | AD54 (Ridley-Thomas-D) | 70.3% | 8.7% |
| District | Drove Alone | Public Transit | District | Drove Alone | Public Transit | District | Drove Alone | Public Transit |
|---|---|---|---|---|---|---|---|---|
| CD07 (Bera-D) | 78.2% | 2.5% | SD21 (Wilk-R) | 77.8% | 1.7% | AD77 (Maienschein-R) | 79.8% | 1.5% |
| CD53 (Davis-D) | 78.6% | 3.2% | SD05 (Galgiani-D) | 78.0% | 1.4% | AD66 (Muratsuchi-D) | 80.0% | 2.3% |
| CD39 (Royce-R) | 79.3% | 2.4% | SD01 (Gaines-R) | 78.1% | 1.4% | AD71 (Voepel-R) | 80.0% | 1.7% |
| CD10 (Denham-R) | 79.5% | 1.3% | SD23 (Morrell-R) | 78.2% | 1.3% | AD36 (Lackey-R) | 80.2% | 1.6% |
| CD48 (Rohrabacher-R) | 79.5% | 1.6% | SD29 (Newman-D) | 78.4% | 2.9% | AD72 (Allen-R) | 80.2% | 2.1% |
| CD50 (Hunter-R) | 79.6% | 1.3% | SD08 (Berryhill-R) | 78.8% | 1.3% | AD23 (Patterson-R) | 80.4% | 1.2% |
| CD22 (Nunes-R) | 79.7% | 0.8% | SD16 (Fuller-R) | 79.5% | 0.9% | AD12 (Flora-R) | 80.6% | 1.1% |
| CD45 (Walters-R) | 80.4% | 1.3% | SD37 (Moorlach-R) | 79.6% | 1.5% | AD57 (Calderon-D) | 81.0% | 2.6% |
| CD23 (McCarthy-R) | 80.9% | 1.0% | SD38 (Anderson-R) | 80.2% | 1.7% | AD34 (Fong-R) | 81.2% | 1.0% |
| CD38 (Sánchez-D) | 80.9% | 3.1% | SD32 (Mendoza-D) | 80.6% | 3.0% | AD68 (Choi-R) | 81.6% | 1.5% |
Additional data for all geographic areas are in the Economic Indicators.
Note: All data sources, methodologies, and historical data series available at CenterforJobs.org.