Highlights for policy makers:
- COVID-19 and the State Economy
- Employment: 1.410 Million Below Recovery
- Labor Force Participation Rate Drops to 60.4%
- Employment Growth Ranking
- Nonfarm Jobs: 1.411 Million Below Recovery
- Jobs Change by Industry
- Unemployment Rates by Region (not seasonally adjusted)
- Unemployment Rates by Legislative District (not seasonally adjusted)
- How Far Back Has the Economy in Each County Been Pushed?
- Employment Share by Region
- MSAs with the Worst Unemployment Rates: Los Angeles 10th Worst in Nation
COVID-19 and the State Economy
The November results show a substantial slowing in the state’s economic recovery during what in most other years is the peak period of jobs, sales, and cash flow essential to the continue viability of many retail and service businesses, especially those that have sustained the predominate share of the negative effects coming from the strategies the state has used to cope with the current crisis. Employment while down just as likely reflects a statistical correction from last month’s high estimates. The jobs data, however, shows the lowest growth since May, and clocks in at only half the average experienced in the prior three months.
Of more significance, the November numbers are based on surveys done just before what amounts to the state’s third shutdown of businesses, which in turn was followed by even stricter provisions contained in the latest stay-at-home orders. The economic effects of these actions will begin to be known following the release of the December data later in January and in the subsequent months. The November data while indicating another slowing is likely to be eclipsed by more dire results in the upcoming period.
November Numbers in Context: The State’s COVID Strategies are Intensifying the Economic Divide
Even after 7 months of positive jobs news, the November numbers still show over half of the ongoing wage and salary jobs losses are centered in just three industries—Leisure & Hospitality, Retail Trade, and Other Services—that in typical years provide only a quarter of total Nonfarm jobs in the state. Much of the remaining losses represent the lower and middle wage components doing jobs requiring a physical presence in industries that otherwise have been able to shift their higher wage workers to remote work options. Remote work still is a possibility for many of these lower and middle wage workers, but state law restricts this opportunity in practice for lower wage private sector workers while providing it widely to government workers.
The state budget revenues reviewed in our preliminary analysis of the November numbers show the other side of the wage equation. Higher wage workers and the higher wage industries have been far less affected by the state’s emergency provisions, and in fact these components are operating at or above their pre-pandemic levels. Rather than the severe deficits projected in the current year budget, general fund revenues are running 24.6% ($14.9 billion) ahead of projections through the end of November. Just looking at the results for the last four months, total general fund revenues are running 32.7% above the enacted budget projections, 12.6% ahead of revenues for the same period in 2019, and even 5.6% above the far rosier projections the state expected to receive last January, well before the current downturn.
As has been noted extensively, the state budget revenue structure is heavily dependent on higher income taxpayers. That those revenues continue to outperform expectations and even prior years demonstrates that this higher tier of the economy remains operating at and above normal, while the lower tier continues to sustain the most damage from the state’s strategies in terms of lost jobs, lost income, lost years of progress in the education of their children, and lower long-term income growth potential as the state faces yet another extended shallow recovery. The state’s response to date to this growing economic divide from its actions has been to emphasize short term assistance to deal with the immediate harm. Expanded actions to accelerate jobs and recovery in an effort to contain the current downturn as a painful but a temporary and short-lived event have yet to be taken.
November Numbers in Context: Population and the State’s Budget
The recent Department of Finance estimates (revised version) indicate population essentially came to a standstill in 2020. The state’s population increased by only 0.05%, or just over 21,000 persons. In contrast, the state grew an estimated 0.9% annually between 2000 and 2010, or by 312,000 a year.
The Department’s estimates historically have differed from state population estimates made by the US Census Bureau, although the differences have narrowed since annual data has become available through the American Community Survey. Comparing the 2019 estimates, the Census Bureau places California’s population lower by 249,000, or roughly one-third of a House seat in the reapportioned Congress. The core difference in the estimates generally has been different assumptions on net migration.
These differences will be trued up following release of the 2020 Census results, but the Census estimates population as of April 1. Neither that result nor the current estimates likely take into account the acceleration of migration that appears to be taking place as companies leave the state and more critically as remote work becomes more a standard work option allowing workers to reduce their costs of living while still retaining their jobs and career prospects.
The state income tax provides about 70% of general fund revenues. In the most current 2018 results from the Franchise Tax Board, the 90,378 taxpayers with an AGI (adjusted gross income) of $1 million or over were only 0.5% of all filers, but paid 40% of the total tax. The 9,956 filers (0.06%) with a taxable AGI of $5 million or more—a group more representative of high-income investors who have recently moved from the state such as Elon Musk (Tesla), Larry Ellison (Oracle), Drew Houston (The Dropbox), David Blumberg (Blumberg Capital), and Keith Rabois (Founders Fund)—paid $19.7 billion (23%) in tax, or an average loss of about $2 million in general fund revenues plus additional taxes and fees they now pay each time one decides to move to another state.
While these and comparable moves in the past—including recent companies such as Hewlett Packard Enterprises, Oracle, 8VC, FileTrail, DZS, QuestionPro, CBRE Group, Commercial Metals, and Kitsbo—have generally raised few concerns at the state level. While individual moves may have a sizeable effect on one year’s worth of revenues, the overall effect generally has been small given the size of the state’s budget. More importantly, the continued high flow of public revenues from the Bay Area often has been sufficient to overcome the negative effects of the state business climate on the non-tech, traditional businesses in the state’s economy.
In the latest 2018 data, the Bay Area produced 42% of total personal income tax revenues while containing only 19% of the state’s population. In the Center’s latest data for corporation income tax, Bay Area companies paid one-third of the total, and even taxable sales in 2019 were somewhat higher at 23%. State budget revenues have continued to expand even with the negative effects of the state’s tax rates and regulatory costs on traditional businesses because of the Bay Area public cash cow.
This situation is now under challenge. Telecommuting and other remote work options have quickly become viable if not standard work arrangements during the current crisis. In a recent Stanford University survey, 27.3% of workers who could work from home indicate they would prefer working 5 days a week from home after the crisis has ended. Another 48.9% indicated a preference for working from home anywhere from 1 to 4 days.
These shifts in work arrangements carry the risk of undermining the budget stability by diminishing the revenue flows from the Bay Area. The Bay Area has operated as a budget cash cow for at least the last two decades because tech companies believed they needed to be there to access both venture capital and the skilled labor pool. As companies have moved to other states, these conditions have become dispersed and available more readily elsewhere. As telecommuting takes hold, tech workers are able to escape the state’s high housing and other costs of living while preserving their career paths.
While the effects of millionaires and billionaires moving has elicited at least some degree of concern regarding the state revenues, this broader trend also has significant implications to the state budget. Taking taxpayers in the $150,000 to $499,999 range—a level not atypical for a household with one or two tech workers—even 10% of this group moving to other states while continuing to telecommute in tech would cost the state $2.6 billion in personal income tax revenues plus other taxes and fees they would otherwise pay.
Employment: 1.410 Million Below Recovery
EDD reported that employment (seasonally adjusted; November preliminary) dropped 141,500 from the revised October numbers, while the number of unemployed also was down by 186,000. The reported unemployment rate improved 0.8 point to 8.2%. The unadjusted rate was 4.2 points worse than the year earlier at 7.9%.
This improvement in the adjusted number, however, came as 327,600 workers left the labor force. Counting these numbers back in, the unemployment rate would have been 10.7%.
California remained essentially level relative to the rest of the states, edging down to the 6th highest unemployment rate.
Total US employment was largely unchanged with a seasonally adjusted dip of 74,000, with the number of unemployed edging down 326,000. The reported unemployment rate dropped 0.2 point to 6.7%.
Figure Sources: California Employment Development Department; US Bureau of Labor Statistics
Compared to the February 2020 numbers (seasonally adjusted) just prior to the current crisis and not accounting for population changes, employment in California still was 1.410 million short of recovery.
Combining the actual employment numbers to date with the most recent economic projections from the LAO, employment recovery is currently on track to match the shallow recovery just experienced following the prior recession in 2008. At the LAO projected recovery rate, the prior employment peak in February 2020 will not be reached until sometime in 2025. (These numbers will be revised with updated Department of Finance projections to be released with the budget in January.)
However, using a comparison with the previous growth trendline determined by the Department of Finance growth projections for the January 2020 Proposed Budget prior to the pandemic, “recovery” in this sense means only returning to the February levels and not regaining the additional lost employment growth from this previous trend including that portion required to keep up with overall population growth in the upcoming 5-year period. At the currently projected growth rates, recovery as defined by return-to-trend will require several years more.
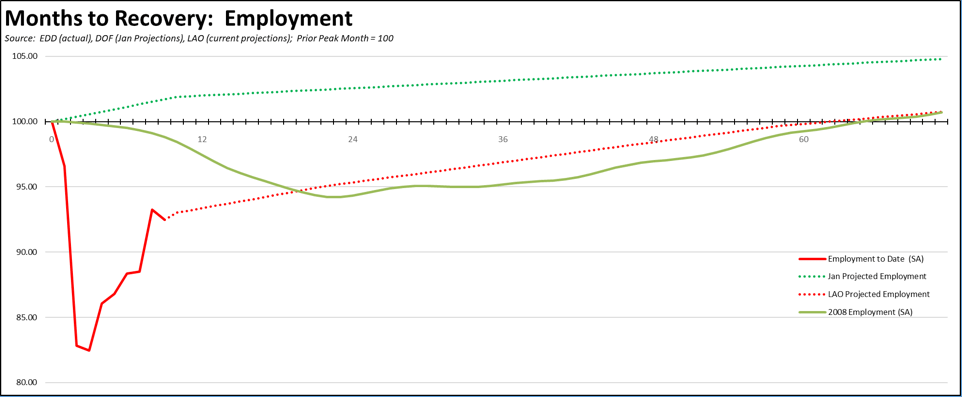
The chart above does not reflect the most recent closures ordered by the state shortly after the surveys used to estimate the November employment and jobs numbers were conducted. With essentially 100% of the November unemployed workers now living in counties now under the Tier 1 restrictions—and with each week nearing the same level for the more restrictive provisions under the stay-at-home orders—the December numbers are likely to show further weakening in employment along with the recovery prospects for the state.
The chart above is also based on “business as usual” recovery environment, which in the current circumstances means continued limitations under AB 5 on the self-employment options which did much to stabilize employment levels following the 2008 recession until wage and salary jobs began to recover, continued increases in labor and operating costs under a continuing flow of new regulations that will slow the pace at which businesses will be able to bring workers back, and—due to the fact that the most recent shutdown orders came at the most critical cash flow period in most businesses’ fiscal year—a substantially increased risk of closure for those population serving and tourism related businesses that have been unable to maintain operations in the extending crisis. The failure to adopt reform measures to accelerate jobs and employment contributed to the extended shallow recovery following the 2008 recession. The chart above illustrates the same path is likely to arise from the current policy direction of the state. The policy emphasis continues to focus on securing additional federal assistance to mitigate the current job and income impacts rather than steps that would accelerate reopening of jobs to a broader range of wage levels both under the current conditions and as the crisis finally begins to ease.
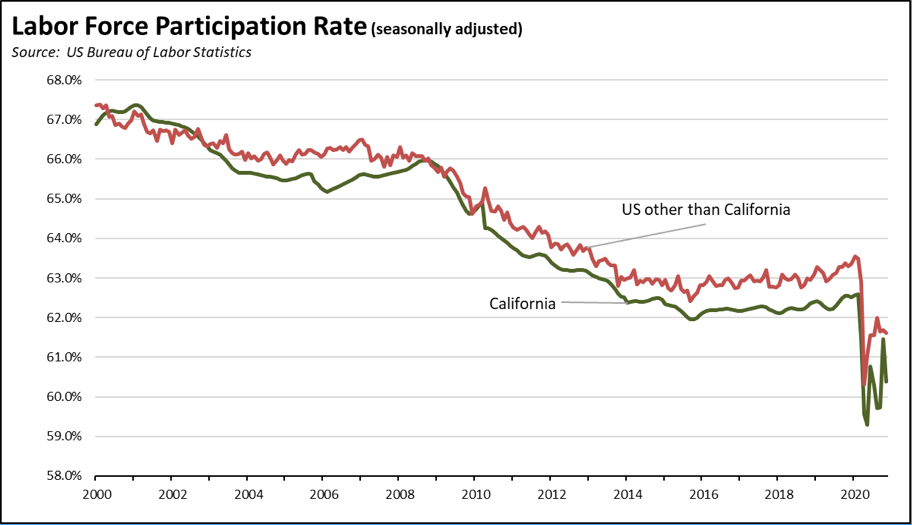
Labor Force Participation Rate Drops to 60.4%
California’s seasonally adjusted labor force participation rate dropped 1.1 points to 60.4%. Nationally, the participation rate eased 0.2 point to 61.5%.
For the 12 months ending November 2020, the seasonally adjusted data shows the California labor force was down 598,600 workers (-3.1% loss) compared to the rest of the US loss of 3,281,400 (-2.3%).
Employment Growth Ranking
The total number of persons employed (seasonally adjusted) over the 12 months ending in November was down 1,386,900. California had the lowest level among the states in terms of absolute employment loss over the year. Number 2 New York showed a loss of 788,300, #3 Texas at 636,300, and #4 Florida at 632,100.
Adjusted to account for differences in the size of each state economy, California over the year showed a 7.4% contraction, worse than the rest of the US with a loss of 5.3%. Ranked among the states, California dropped to the 7th worst loss rate.
Figure Source: US Bureau of Labor Statistics
Nonfarm Jobs: 1.411 Million Below Recovery
The growth in Nonfarm jobs (seasonally adjusted) slowed to 57,100 (seasonally adjusted) in November, compared to the revised gains in October of 145,600.
Nonfarm jobs were down 1,336,700 over the year. Adjusting for population, California loss rate improved slightly to 42nd among the states. The 12-month jobs loss rate was -7.6% compared to the rest of the US at -5.8%.
Figure Sources: California Employment Development
Department; US Bureau of Labor Statistics
Compared to the February 2020 numbers (seasonally adjusted) just prior to the current crisis and not accounting for population changes, nonfarm wage and salary jobs in California were still 1.411 million short of recovery.
Using the same methods as above for employment, the current trends and LAO projections suggest a similarly extended recovery for wage and salary jobs, again likely sometime in 2025. This trend, however, would put jobs recovery about a year earlier than what the state experienced following the 2008 recession.
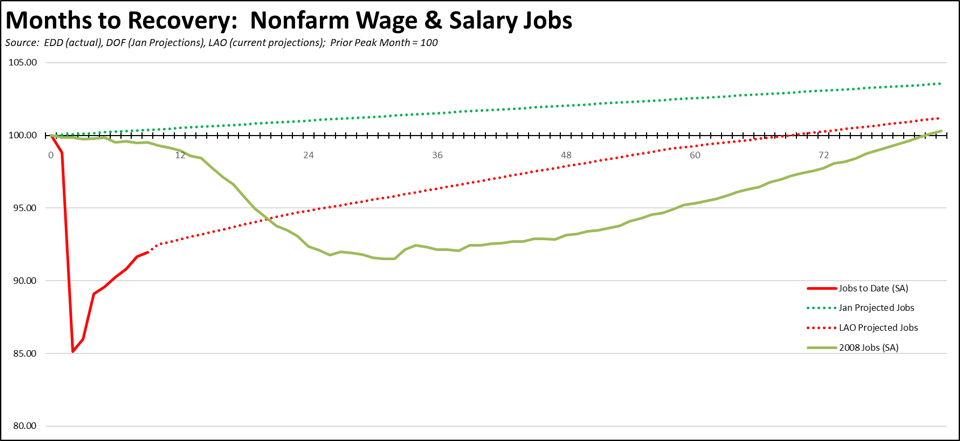
As reflected in the Department of Finance projections in January, a high share of job growth in 2021 was expected to come primarily from reclassification rather than actual improvements in wage opportunities for California workers. AB 5 was expected to eliminate many previous self-employment options for workers—as reflected in the deeper losses shown in the employment vs. the wage and jobs charts—and the higher job rates projected by the Department reflected the expectation that at least a portion of those positions would shift to wage and salary status, a statistical rather than an actual economic gain. Job growth potential in the outer years, however, was expected to be limited by labor force availability.
The slow projections in both the January and the most current LAO numbers assume that labor force participation will remain low and do not reflect the fact that even prior to the pandemic, the state still had considerable potential to expand jobs. Even prior to the current crisis, the state’s labor force participation rate remained well below earlier levels, and significantly below the other states even though California has had a relatively younger, working age population. Job creation potential has not so much been affected by the availability of labor but more the skill levels of those remaining outside the labor force and the continuing costs imposed on employing labor through the state’s employment regulations and overall higher other costs of doing business including energy, rents, and taxes and fees. Skills development also continues to be affected by the relatively poor outcomes coming from the state’s K-12 system in spite of a 58% increase in total K-12 funding since 2011-12, especially for minority and socioeconomically disadvantaged students.
Jobs Change by Industry
In the unadjusted numbers that allow a more detailed look at industry shifts, all but 2 industries continued to post job losses over the 12-month period. Utilities as an essential service and Finance & Insurance with a high incidence of telework opportunities again were level or positive.
Industries showing the greatest contractions over the year were led by Food Services, Government, Retail Trade, and Other Services.
| Not Seasonally Adjusted Payroll Jobs (1,000) | November 2020 | 12-month change | Nonfarm Growth Rank | % 12-month Change | Avg. Annual Wage |
|---|---|---|---|---|---|
| Total Farm | 340.0 | -73.5 | -17.8% | $37.4k | |
| Mining & Logging | 21.7 | -1.0 | 3 | -4.4% | $111.7k |
| Construction | 869.7 | -23.0 | 8 | -2.6% | $74.1k |
| Manufacturing | 1,222.0 | -95.5 | 17 | -7.2% | $101.0k |
| Wholesale Trade | 658.0 | -33.5 | 9 | -4.8% | $82.4k |
| Retail Trade | 1,604.3 | -112.9 | 19 | -6.6% | $39.5k |
| Utilities | 57.1 | 0.0 | 2 | 0.0% | $142.5k |
| Transportation & Warehousing | 669.4 | -5.9 | 4 | -0.9% | $61.6k |
| Information | 525.0 | -57.5 | 13 | -9.9% | $199.8k |
| Finance & Insurance | 555.3 | 12.7 | 1 | 2.3% | $140.1k |
| Real Estate & Rental & Leasing | 297.7 | -9.3 | 5 | -3.0% | $74.8k |
| Professional, Scientific & Technical Services | 1,334.7 | -12.2 | 6 | -0.9% | $131.2k |
| Management of Companies & Enterprises | 241.1 | -15.2 | 7 | -5.9% | $138.9k |
| Administrative & Support & Waste Services | 1,085.5 | -69.4 | 14 | -6.0% | $49.7k |
| Educational Services | 347.0 | -53.1 | 12 | -13.3% | $58.6k |
| Health Care | 1,563.5 | -37.8 | 11 | -1.5% | $71.3k |
| Social Assistance | 814.2 | -36.7 | 10 | -4.3% | $22.1k |
| Arts, Entertainment & Recreation | 234.0 | -85.4 | 15 | -26.7% | $66.2k |
| Accommodation | 150.7 | -87.3 | 16 | -36.7% | $41.3k |
| Food Services | 1,158.7 | -315.6 | 21 | -21.4% | $24.5k |
| Other Services | 476.2 | -102.4 | 18 | -17.7% | $44.0k |
| Government | 2,471.9 | -198.9 | 20 | -7.4% | $74.8k |
| Total Nonfarm | 16,357.7 | -1,339.9 | -7.6% | ||
| Total Wage & Salary | 16,697.7 | -1,413.4 | -7.8% | ||
Figure Source: California Employment Development Department;
Wages based on most recent Quarterly Census of Employment & Wages
Unemployment Rates by Region (not seasonally adjusted)
Unemployment rates continued to reflect the regional mix of jobs that have been retained through telework compared to relative shares of lower wage services and tourism jobs that have been hit the hardest by the state-ordered closures and other restrictions.
| wdt_ID | Region | Unemployment Rates |
|---|---|---|
| 2 | California | 7.9 |
| 6 | Bay Area | 5.9 |
| 10 | Orange County | 6.4 |
| 14 | Central Coast | 6.7 |
| 18 | Sacramento | 6.7 |
| 22 | Central Sierra | 6.9 |
| 26 | Upstate California | 7.0 |
| 30 | San Diego/Imperial | 7.0 |
| 34 | Inland Empire | 7.9 |
| 38 | Central Valley | 9.0 |
| 39 | Los Angeles | 10.1 |
Figure Source: California Employment Development Department
Unemployment Rates by Legislative District (not seasonally adjusted)
Lowest
| wdt_ID | Congressional District | Unemployment Rate |
|---|---|---|
| 2 | CD18 (Eshoo-D) | 4.3 |
| 3 | CD17 (Khanna-D) | 5.0 |
| 4 | CD52 (Peters-D) | 5.3 |
| 5 | CD02 (Huffman-D) | 5.4 |
| 6 | CD12 (Pelosi-D) | 5.4 |
| 7 | CD49 (Levin-D) | 5.2 |
| 9 | CD24 (Carbajal-D) | 5.6 |
| 10 | CD15 (Swalwell-D) | 5.7 |
| 12 | CD14 (Speier-D) | 5.7 |
| 13 | CD04 (McClintock-R) | 5.8 |
| wdt_ID | Senate District | Unemployment Rate |
|---|---|---|
| 2 | SD13 (Becker-D) | 4.6 |
| 3 | SD15 (Cortese-D) | 5.4 |
| 4 | SD36 (Bates-R) | 5.4 |
| 5 | SD39 (Atkins-D) | 5.5 |
| 6 | SD01 (Dahle-R) | 5.6 |
| 7 | SD02 (McGuire-D) | 5.7 |
| 8 | SD10 (Wieckowski-D) | 5.6 |
| 9 | SD11 (Wiener-D) | 5.8 |
| 10 | SD37 (Min-D) | 5.9 |
| 11 | SD19 (Limón-D) | 6.2 |
| wdt_ID | Assembly District | Unemployment Rate |
|---|---|---|
| 2 | AD28 (Low-D) | 4.3 |
| 3 | AD16 (Bauer-Kahan-D) | 4.5 |
| 4 | AD22 (Mullin-D) | 4.7 |
| 5 | AD24 (Berman-D) | 4.5 |
| 6 | AD78 (Ward-D) | 5.1 |
| 7 | AD10 (Levine-D) | 5.1 |
| 8 | AD25 (Lee-D) | 5.0 |
| 9 | AD06 (Kiley-R) | 4.9 |
| 10 | AD77 (Maienschein-D) | 5.3 |
| 11 | AD76 (Boerner Horvath-D) | 5.4 |
Highest
| wdt_ID | Congressional District | Unemployment Rate |
|---|---|---|
| 2 | CD28 (Schiff-D) | 10.5 |
| 3 | CD32 (Napolitano-D) | 10.5 |
| 4 | CD21 (Cox-D) | 10.7 |
| 5 | CD43 (Waters-D) | 11.3 |
| 6 | CD29 (Cardenas-D) | 11.1 |
| 7 | CD37 (Bass-D) | 10.7 |
| 9 | CD34 (Gomez-D) | 11.4 |
| 10 | CD51 (Vargas-D) | 11.8 |
| 12 | CD40 (Roybal-Allard-D) | 12.5 |
| 13 | CD44 (Barragan-D) | 14.0 |
| wdt_ID | Senate District | Unemployment Rate |
|---|---|---|
| 2 | SD32 (Archuleta-D) | 9.0 |
| 3 | SD22 (Rubio-D) | 9.6 |
| 4 | SD40 (Hueso-D) | 10.6 |
| 5 | SD14 (Hurtado-D) | 11.6 |
| 6 | SD18 (Hertzberg-D) | 11.1 |
| 7 | SD21 (Wilk-R) | 11.1 |
| 9 | SD24 (Durazo-D) | 11.7 |
| 10 | SD33 (Gonzalez-D) | 12.0 |
| 12 | SD30 (vacant) | 12.0 |
| 13 | SD35 (Bradford-D) | 12.2 |
| wdt_ID | Assembly District | Unemployment Rate |
|---|---|---|
| 2 | AD48 (Rubio-D) | 10.8 |
| 3 | AD62 (Burke-D) | 10.9 |
| 4 | AD32 (Salas-D) | 11.1 |
| 5 | AD36 (Lackey-R) | 12.4 |
| 6 | AD46 (Nazarian-D) | 12.3 |
| 7 | AD56 (Garcia-D) | 11.5 |
| 9 | AD63 (Rendon-D) | 13.1 |
| 10 | AD51 (Carrillo-D) | 13.3 |
| 12 | AD64 (Gipson-D) | 13.5 |
| 13 | AD59 (Jones-Sawyer-D) | 13.9 |
How Far Back Has the Economy in Each County Been Pushed?
As an indication of the severity of the current economic downturn, the following chart illustrates how much economic ground each county has lost using employment levels as the measure. Based on annual averages, the chart below indicates the last year each county saw the November employment numbers. Because the current series only goes back to 1990 for most counties, several of the entries indicate “Before 1990.” Los Angeles County is the exception, with data going back to 1976. The “Change” column indicates the change from April, the month reflecting the effects of the initial round of closures.
| wdt_ID | County | Last Year Employment Equal To or Less Than April | Last Year Employment Equal to or Less Than November | Change |
|---|---|---|---|---|
| 2 | Alameda County | 2009 | 2013 | 4 |
| 3 | Alpine County | 2009 | 2014 | 5 |
| 4 | Amador County | 1997 | 2014 | 17 |
| 5 | Butte County | 1998 | 1999 | 1 |
| 6 | Calaveras County | 2012 | 2014 | 2 |
| 7 | Colusa County | 1999 | 2004 | 5 |
| 8 | Contra Costa County | 1997 | 2013 | 16 |
| 9 | Del Norte County | 1992 | 1992 | 0 |
| 10 | El Dorado County | 1999 | 2016 | 17 |
| 11 | Fresno County | 2012 | 2015 | 3 |
| County | Last Year Employment Equal To or Less Than April | Last Year Employment Equal to or Less Than November | Change |
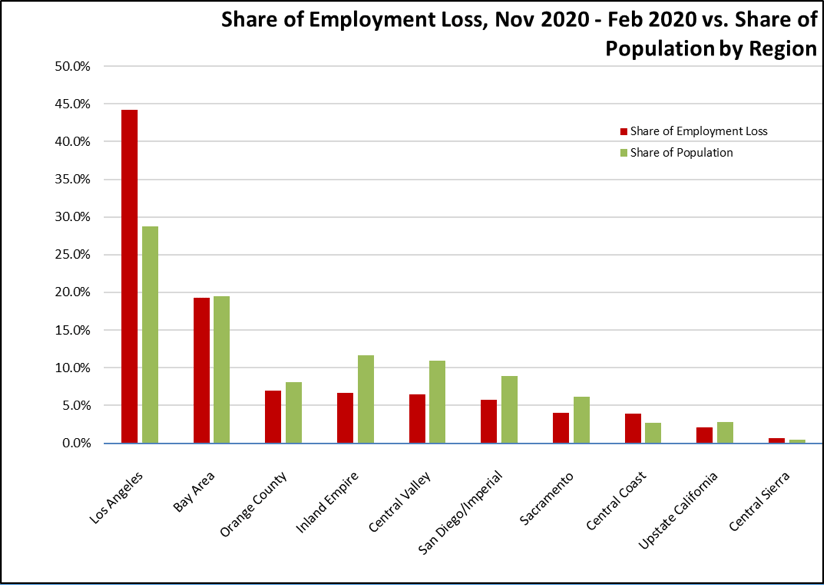
Employment Share by Region
The following chart compares change in employment (compared to pre-COVID February 2020) vs. population share as a measure of the disparate economic effects from the social distancing measures. Los Angeles Region, which experienced relatively greater job creation in lower income, population-serving and tourism industries during the recently ended expansion period, accounted for just under half of the employment loss in November. Regions such as the Bay Area and San Diego with a greater incidence of jobs amenable to telework have been slightly less impacted. Regions such as the Central Valley and Inland Empire with a higher degree of essential businesses but also effects from seasonal factors have shown somewhat greater resiliency.
MSAs with the Worst Unemployment Rates: Los Angeles 10th Worst in Nation
California had 9 MSAs among the 25 regions with the worst unemployment rates in October. As a result of a pattern of jobs growth in recent years that concentrated on the hardest-hit lower wage, population-serving and tourism service industries in Los Angeles County, Los Angeles-Long Beach-Anaheim MSA (Los Angeles and Orange Counties) had the 10th worst in the nation.
| wdt_ID | MSA | October Unemployment Rate | US Rank out of 389 |
|---|---|---|---|
| 1 | El Centro MSA | 18.8 | 388 |
| 2 | Los Angeles-Long Beach-Anaheim MSA | 11.0 | 380 |
| 3 | Visalia-Porterville MSA | 10.9 | 379 |
| 4 | Bakersfield MSA | 10.6 | 378 |
| 5 | Stockton-Lodi MSA | 10.0 | 374 |
| 6 | Merced MSA | 9.3 | 366 |
| 7 | Hanford-Corcoran MSA | 9.3 | 366 |
| 8 | Fresno MSA | 9.3 | 366 |
| 9 | Yuba City MSA | 9.2 | 365 |