The Center for Jobs and the Economy has released our initial analysis of the November Employment Report from the California Employment Development Department.
Recovery Progress
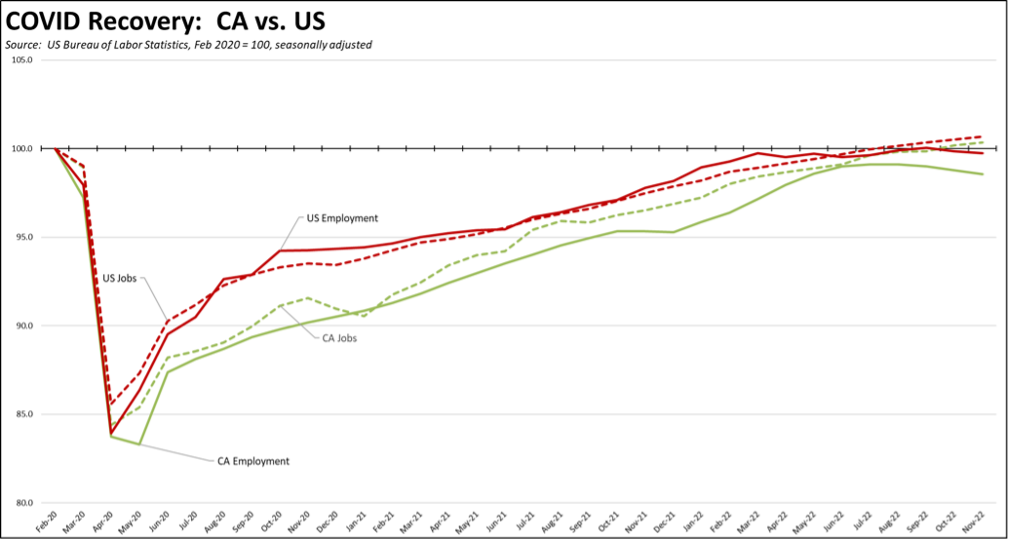
The November numbers continued the mixed results of recent months, but overall showed slowing in the state economy. Nonfarm job growth at 26,800 was the second lowest monthly gain for the year, but still kept the numbers above the pre-pandemic peak in February 2020. The employment numbers posted a loss for the fourth month in a row, bringing the total decline over that period to a loss of 108,100. The US numbers were similar, with a jobs gain of 263,000 and employment losses of 138,000. Compared to the February 2020 pre-pandemic peaks, California was 0.3% above that recovery mark for nonfarm wage and salary jobs, and continued to backslide to 1.5% short for employment. Jobs, however, have substantial ground to recover in order to achieve recovery defined as return to trend.
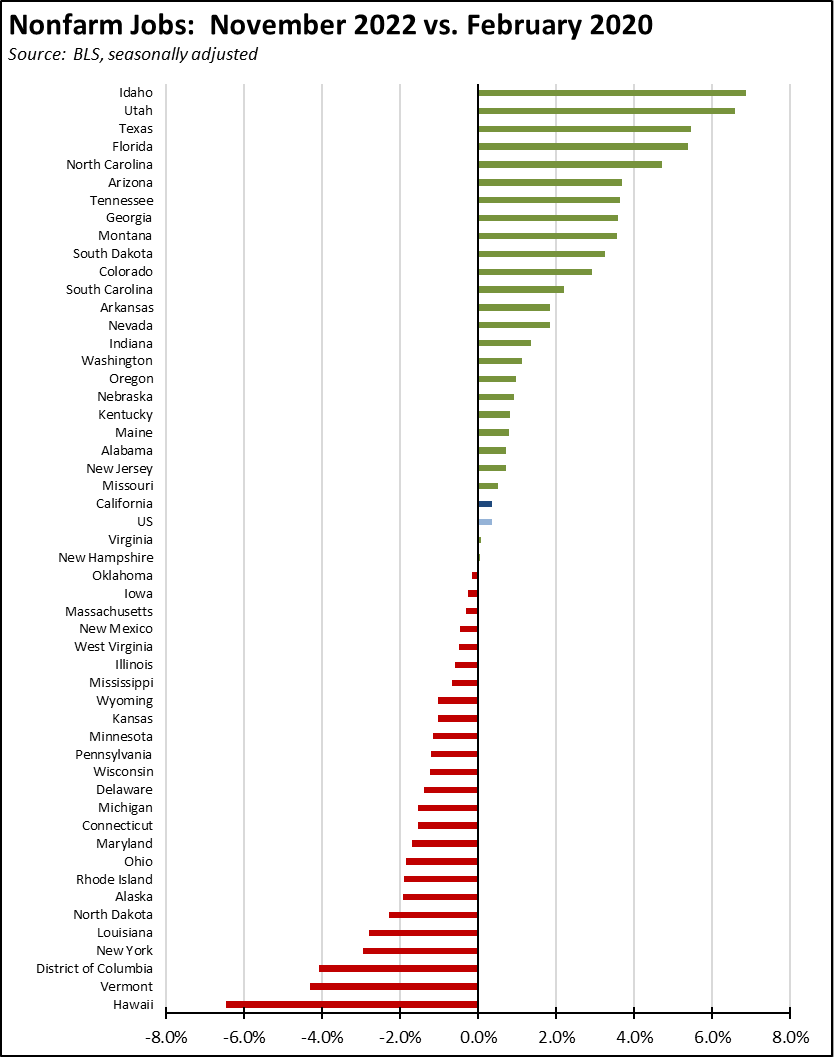
California nonfarm gains weakened to 26,800, coming in third among the states behind Texas (33,600) and Florida (28,100). Over the prior 12 months, California (675,600) was just barely ahead of Texas (657,600). California’s gains, however, primarily constitute jobs recovery from the series of state-ordered shutdowns. Compared to the pre-pandemic peak, California jobs have grown only 60,700, posting real growth behind 8 other states led by Texas at 706,700 and Florida at 487,400. Measured by jobs, California has basically returned to where it was nearly three years ago, while other states have experienced expansion.
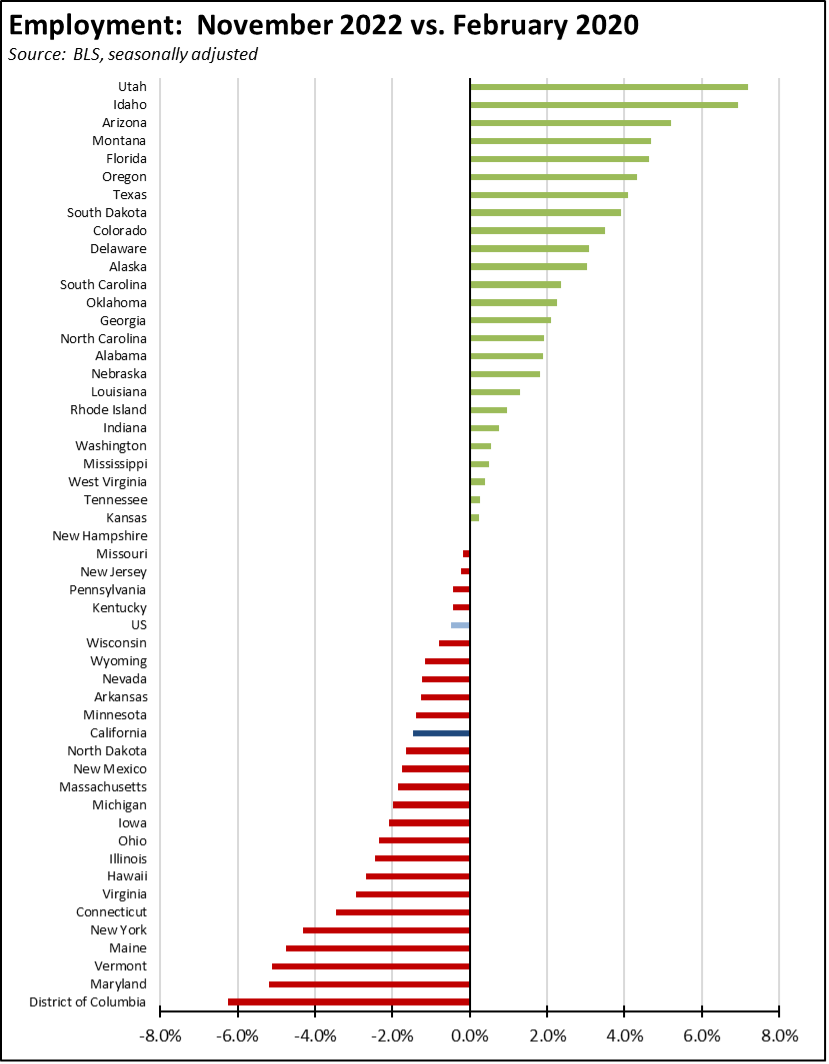
In the employment numbers, California dipped to 36th from 35th highest among the states when measured by a return to the pre-pandemic employment peak, while 26 states had more people working than before the pandemic. The state’s unemployment rate edged up to 4.1% as the labor force again remained stagnant, the 11th highest rate among the states and DC. Overall, the number of states including California having unemployment rates at or below the February 2020 level dropped from 36 to 29.
2022 Jobs Growth Likely to be Revised Lower
The monthly job numbers reported by EDD and Bureau of Labor Statistics are estimates based on the Current Employment Statistics (CES) surveys. These numbers are revised each year in March relying heavily on the Quarterly Census of Employment & Wages (QCEW), which instead contains complete counts based on employment tax filings. The advantage of the CES series is that it is available monthly. The QCEW data is released only quarterly with a five-month lag.
Following release of the QCEW Q2 data, Federal Reserve Bank of Philadelphia issued their analysis of what these numbers likely mean to the scale of the upcoming revisions in March. In the chart below, the CES data (orange line) is compared to the likely revisions coming from the QCEW data to date (solid blue line) along with projections for the rest of period shown (dotted blue line).
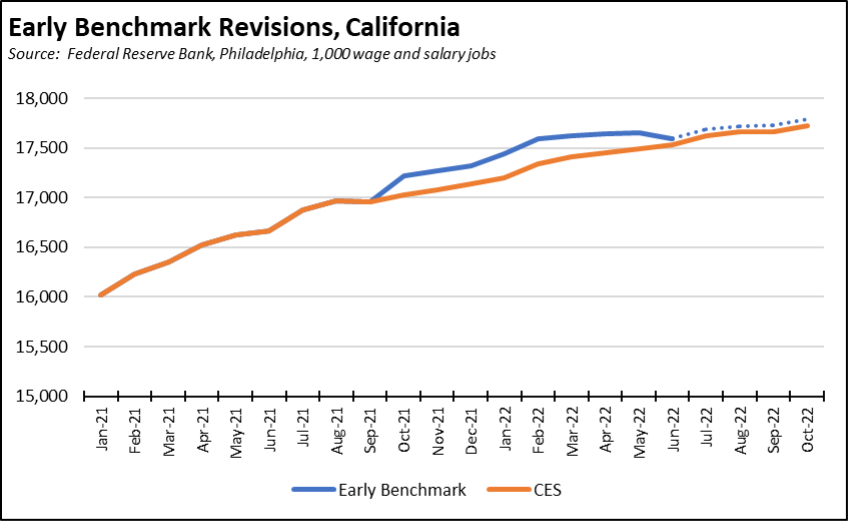
The Philadelphia Fed analysis indicates that job gains in 2022 have been weaker than reported in the CES estimates, both for California and the nation as a whole. Job gains instead are likely to be revised upwards for Q4 2021. While ending near the same point in October as the CES estimates, California job gains year-to-date in 2022 through October are 564,500 in these early benchmark revisions, compared to the 695,500 shown in the CES estimates. The difference is a drop of 131,000 (-18.8%).
Recession Watch: Tech Layoffs
In the most recent reports for 2022, California-based tech companies have laid off at least an estimated 88,608 employees while others have substantially slowed their hiring plans. Of these, 80,650 are from companies based in the Bay Area. These estimates are compiled from press and other reports, not all of which contain the number of affected workers. The totals, therefore, are larger than indicated.
The Bay Area component is critical for three reasons.
First, the Bay Area in general and the tech industry specifically has been the sole reason for California’s elevated economic performance since 2012. Absent this factor, economic growth in the rest of the state has been only marginally better than the rest of the nation, and substantially behind other states such as Texas. As shown in the recently released county GDP (nominal) data, California GDP was restrained in the period 2001 to 2012 as the Bay Area and the tech industry regrouped from the Dot.Com recession at the beginning of the century. Total California GDP then grew 59.6% between 2012 and the latest results in 2021, compared to 41.0% for the rest of the states. The Bay Area, however, grew 90.8% in this period while the rest of the state grew only 47.1%, marginally better than the rest of the nation at 41.0% but largely offset by the growing cost of living in this state.
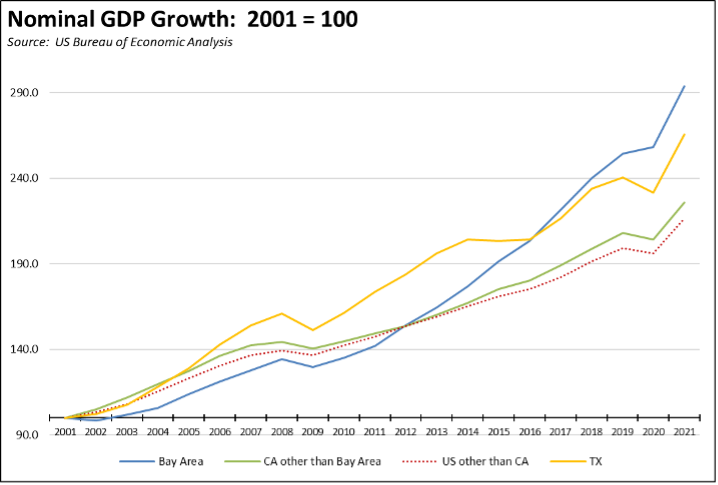
Second, the Bay Area’s dominance reflects state policies that favor high wage tech jobs while increasing the costs of doing business for other industries in the state. As shown in the chart, California’s superior economic performance has been highly concentrated in expansion of high wage tech jobs. Texas in contrast is an example of a state that has achieved nearly comparable economic performance but in a more sustained trend by also focusing on middle wage including blue collar middle wage jobs combined with far lower costs of living, notably so for housing and energy.
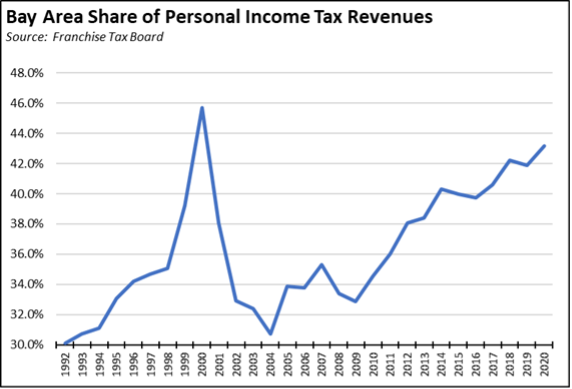
Third, this income mix also heavily skews the state’s budget model, making the state budget condition and the current level of spending overly reliant on the Bay Area economic performance. The Bay Area currently accounts for 19.8% of the state’s population, but in the latest data for tax year 2020, paid 43.2% of the state’s personal income tax which in turn accounts for 63% of total revenues in the current Budget Act. Dramatic shifts in tax revenues from this region have had significant effects on overall state spending in the past, such as in the beginning of the 2000s when Bay Area receipts plummeted from 45.7% of personal income tax in 2000 to only 30.7% by 2004. Spending since the current upsurge coming from the tech expansion since 2012 has expanded on the assumption that tech remains the state’s economic future. The current weakening suggests that at best the industry has reached a mature stage of more moderate gains at least in the near term.
Other states have made a policy investment in expanding a more diverse range of industries and worker skills. California instead remains reliant on one.
These results are reflected in the current budget cash flow reports. While the more complete accounting from Department of Finance for November has not yet been released, the preliminary results from State Controller indicate that current fiscal year revenues as of November are running $2.3 billion ahead of projections. This current gain, however, comes from substantially reduced personal income tax refunds for tax year 2021 in October providing a gain of $3.9 billion. The current $2.3 billion to the good consequently represents the results of the state’s economic activity in 2021 and not the current levels in 2022. With weakening economic results especially in the budget-critical Bay Area, the recent LAO analysis expects total revenues in 2021-22 through 2023-24 to come in $41 billion lower than projected, producing a $24 billion deficit in 2023-24 along with ongoing deficits going from $17 billion to $8 billion in the 5-year forecast period.
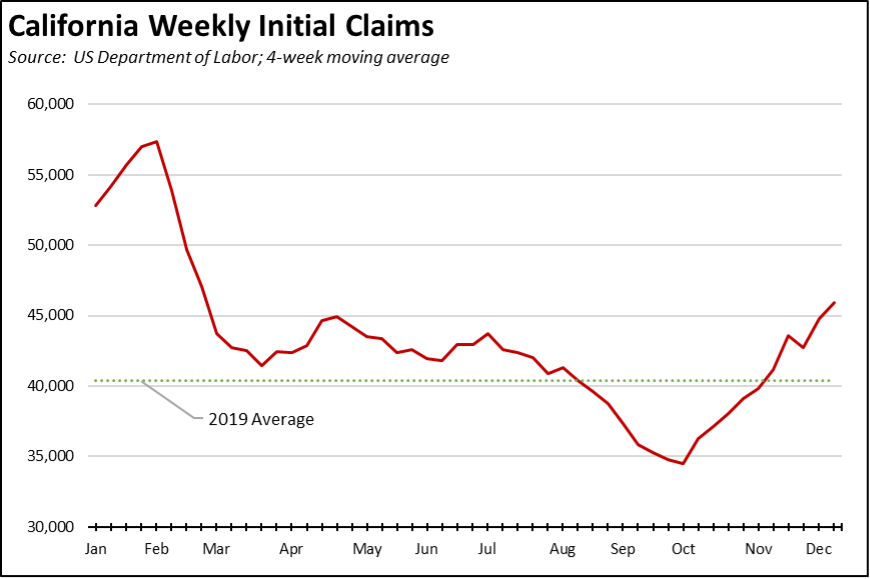
Recession Watch: Unemployment Insurance Claims Rising
The number of initial claims (4-week moving average) continued rising in California along with the rest of the US, with the state numbers now above the 2019 average. For the past 4 weeks ending with the week of December 10, California initial claims were 19% of the national total, and insured unemployment (a proxy for continuing claims) in the 4 weeks through the week of December 3 were 22% of the total.
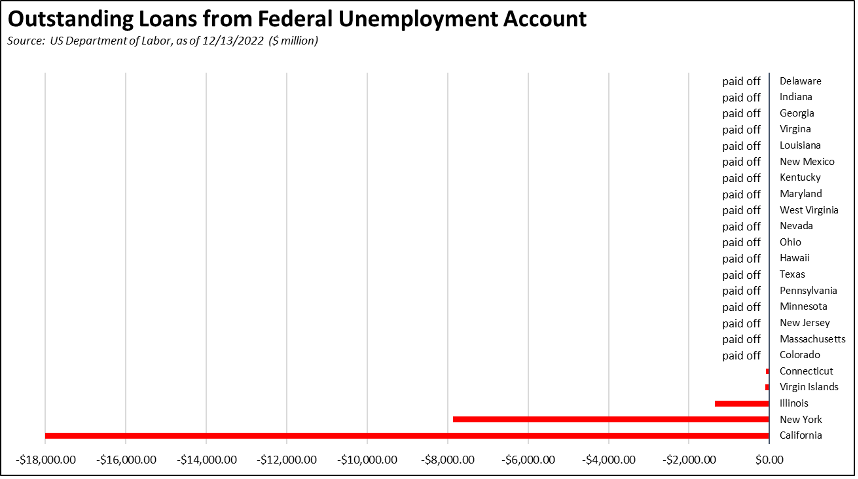
Federal Trust Fund Debt Now Down to California & New York
Even with the prospects of another economic downturn rising, California’s primary fund to assist unemployed workers remains fully unprepared. With Illinois previously announcing it will pay off its debt by the end of the year, California and, in a distant second, New York remain the primary states still relying on federal borrowing to sustain their unemployment funds both now and during what increasingly appears to be a looming recession in the upcoming year. In the current numbers, California is responsible for 66% of the total current federal debt.
CA Unemployment Rate
California’s reported unemployment rate (seasonally adjusted) in November increased 0.1 point from October to 4.1%.
The November numbers show employment dropping for the fourth month in a row, posting a loss of 42,700. Unemployment rose by 21,800. The labor force was essentially unchanged with a drop of 21,000, and the participation rate dipped 0.1 point to 62.2%.
US Unemployment Rate
The reported national numbers show US unemployment rate (seasonally adjusted) unchanged at 3.7%. Employment was down 138,000, unemployment up 48,000, and the labor force little changed with a drop of 186,000. The labor force participation rate also dipped 0.1 point to 62.1%.
Nonfarm Jobs
Nonfarm wage and salary jobs were up 26,800, remaining above the pre-pandemic peak in February 2020 for the second month in a row.
Nonfarm jobs nationally were up 263,000, posting the fifth month in a row above the pre-pandemic peak in February 2020.
The seasonally adjusted numbers for California showed gains in all but 2 industries, with the increases led by Health Care & Social Assistance (10,500), Accommodation & Food Services (8,100), and Information (6,300). Losses were in Retail Trade (-14,700) and Transportation, Warehousing & Utilities (-6,500).
Job Openings
California unfilled job openings at the end of October were 1.119 million, representing 1.5 job openings for every unemployed person that month. Nationally, job openings were down slightly, dipping 3.3% to 10.3 million.
Counties with Double-Digit Unemployment
The number of counties with an unemployment rate at 10% or more rose to 2. The unadjusted rates ranged from 2.2% in San Mateo to 16.7% in Imperial.