Highlights for policy makers:
- Unemployment Rate Level at 4.9%; Total Employment Gains 97,200
- Labor Force Participation Rate Matches Lowest Level from 1976
- State Employment Growth Rankings—California Rose to 2nd Place
- Nonfarm Jobs Up 31,700
- Four Industries below 2007 Pre-Recession Job Levels
- Job Gains by Wage Level
- Two-Tier Economy Persists—Central Valley Unemployment More than Twice as High as Bay Area
- Bay Area Provided 39% of Net Employment Growth Since Recession
- Six California MSAs in the 10 Worst Unemployment Rates Nationally
Unemployment Rate Improves to 4.9%; Total Employment Gains 97,200
The Labor Force data for October 2017 (seasonally adjusted; California preliminary) is shown below, along with the change from the prior month:
| Seasonally Adjusted | California | US | ||
|---|---|---|---|---|
| Oct 2017 | Change from Sep 2017 | Oct 2017 | Change from Sep 2017 | |
| Unemployment Rate | 4.9% | -0.2 | 4.1% | -0.1 |
| Labor Force | 19,358,000 | 0.3% | 160,381,000 | -0.5% |
| Participation Rate | 62.4% | 0.1 | 62.7% | -0.4 |
| Employment | 18,405,900 | 0.5% | 153,861,000 | -0.3% |
| Unemployment | 952,200 | -3.5% | 6,520,000 | -4.1% |
The related not seasonally adjusted numbers (California preliminary), with the change from October 2016:
| Not Seasonally Adjusted | California | US | ||
|---|---|---|---|---|
| Oct 2017 | Change from Oct 2016 | Oct 2017 | Change from Oct 2016 | |
| Unemployment Rate | 4.3% | -0.9 | 3.9% | -0.8 |
| Labor Force | 19,353,400 | 0.8% | 160,465,000 | 0.4% |
| Participation Rate | 62.4% | 0.0 | 62.7% | -0.1 |
| Employment | 18,516,000 | 1.8% | 154,223,000 | 1.2% |
| Unemployment | 837,400 | -16.9% | 6,242,000 | -16.2% |
California Employment Development Department’s (EDD) latest release shows on a seasonally adjusted basis, total employment was up 97,200 from September, while the number of unemployed dropped by 34,900. The labor force rose by 62,300.
California’s seasonally adjusted unemployment rate improved to 4.9%. California tied with Illinois, Mississippi, and New Jersey for the 8th highest unemployment rate among the states. The unadjusted rate dropped from 5.2% in October 2016 to 4.3%.
Total US employment saw a seasonally adjusted decline of 484,000 from September, while the number of unemployed dropped by 281,000. The national unemployment rate was down 0.1 point to 4.1%. The national labor force numbers eased by 765,000.
Labor Force Participation Rate Matches Lowest Level from 1976
California’s participation rate (seasonally adjusted) in October rose to 62.4%, while the US rate declined to 62.7%.
The seasonally adjusted California participation rate in October remained near the previous lows in 1976.
State Employment Growth Rankings—California Rose to 2nd Place
| Rank | Number of Employed | Percentage Change | Population Adjusted (employment growth per 1,000 civilian noninstitutional population) |
|---|---|---|---|
| 1 | FL 334,900 | CO 4.4% | CO 28.8 |
| 2 | CA 261,200 | OR 3.9% | OR 23.0 |
| 3 | TX 213,000 | GA 3.7% | UT 22.3 |
| 4 | NY 179,500 | TN 3.6% | GA 21.9 |
| 5 | GA 173,400 | FL 3.6% | WA 21.1 |
| 6 | CO 125,200 | WA 3.5% | TN 20.8 |
| 7 | WA 121,200 | UT 3.3% | MN 20.7 |
| 8 | TN 108,700 | AR 3.3% | FL 20.0 |
| 9 | VA 97,700 | MN 3.1% | AR 18.4 |
| 10 | NC 92,000 | MD 2.8% | MD 18.0 |
| 11 | MN 89,500 | KY 2.7% | KY 15.1 |
| 12 | MD 85,000 | AZ 2.6% | VA 14.9 |
| 13 | AZ 80,100 | VA 2.4% | AZ 14.8 |
| 14 | OR 75,900 | WI 2.2% | WI 14.3 |
| 15 | WI 65,400 | NV 2.1% | ID 12.4 |
| 16 | OH 55,900 | ID 2.0% | NV 12.2 |
| 17 | KY 52,300 | NY 2.0% | NC 11.6 |
| 18 | MA 51,200 | NC 2.0% | NY 11.3 |
| 19 | UT 49,400 | SC 1.8% | ME 10.3 |
| 20 | AR 42,500 | ME 1.7% | TX 10.2 |
| 21 | SC 38,500 | TX 1.7% | SC 9.9 |
| 22 | MI 33,100 | AL 1.6% | MA 9.2 |
| 23 | AL 32,700 | RI 1.5% | RI 9.2 |
| 24 | NV 28,100 | MA 1.5% | AL 8.6 |
| 25 | IN 22,200 | CA 1.4% | CA 8.5 |
| 26 | OK 21,400 | KS 1.2% | KS 7.9 |
| 27 | CT 18,500 | OK 1.2% | DC 7.8 |
| 28 | KS 17,500 | DC 1.2% | OK 7.1 |
| 29 | ID 15,900 | DE 1.1% | DE 6.6 |
| 30 | ME 11,300 | NM 1.1% | CT 6.4 |
| 31 | NM 9,100 | OH 1.0% | ND 6.2 |
| 32 | LA 9,000 | CT 1.0% | OH 6.1 |
| 33 | RI 7,900 | ND 0.9% | NM 5.6 |
| 34 | NJ 6,700 | MI 0.7% | IN 4.3 |
| 35 | NE 5,400 | IN 0.7% | MI 4.2 |
| 36 | DE 5,000 | NE 0.6% | NE 3.7 |
| 37 | DC 4,400 | SD 0.5% | SD 3.3 |
| 38 | ND 3,600 | LA 0.5% | LA 2.5 |
| 39 | WV 2,700 | WV 0.4% | AK 2.2 |
| 40 | SD 2,200 | AK 0.4% | VT 1.9 |
| US 1,959,000 | US 1.3% | US 7.7 |
Between October 2016 and October 2017, Bureau of Labor Statistics (BLS) data shows the total number of employed in California increased by 261,200 (seasonally adjusted), or 13.3% of the total net employment gains in this period for the US. California rose to 2nd place behind Florida (which has a civilian working age population only 55% as large as California’s) at 334,900 and ahead of Texas (69% as large) at 213,000. Measured by percentage change in employment over the year, California improved to 25th highest. Adjusted for working age population, California also rose to 25th.
Nonfarm Jobs Up 31,700
EDD reported that between September and October 2017, seasonally adjusted nonfarm wage and salary jobs grew 31,700. September’s gains were revised to 50,300 from the previously reported 52,200.
In the not seasonally adjusted nonfarm numbers overall, hiring saw increases in all but 3 industries over the year. The change in total payroll jobs from October 2016 saw the largest increases in Construction (45,100), Social Assistance (41,700), and Government (35,700). Declines were in Manufacturing (-4,900), Mining & Logging (-600), and Utilities (-300).
| Not Seasonally Adjusted Payroll Jobs | Oct 2017 | Sep 2017 | Change Oct 2017 – Sep 2017 | Change Oct 2017 – Oct 2016 |
|---|---|---|---|---|
| Total Farm | 458,800 | 481,200 | -22,400 | -1,700 |
| Mining and Logging | 23,400 | 23,500 | -100 | -600 |
| Construction | 840,300 | 842,500 | -2,200 | 45,100 |
| Manufacturing | 1,300,500 | 1,311,400 | -10,900 | -4,900 |
| Wholesale Trade | 739,700 | 738,500 | 1,200 | 13,400 |
| Retail Trade | 1,693,500 | 1,676,300 | 17,200 | 3,100 |
| Utilities | 58,300 | 58,400 | -100 | -300 |
| Transportation & Warehousing | 546,000 | 542,500 | 3,500 | 12,400 |
| Information | 534,500 | 534,500 | 0 | 5,500 |
| Finance & Insurance | 551,500 | 549,700 | 1,800 | 2,800 |
| Real Estate & Rental & Leasing | 285,700 | 283,400 | 2,300 | 1,800 |
| Professional, Scientific & Technical Services | 1,234,300 | 1,225,000 | 9,300 | 4,000 |
| Management of Companies & Enterprises | 230,800 | 230,400 | 400 | 4,400 |
| Administrative & Support & Waste Services | 1,109,500 | 1,112,800 | -3,300 | 3,100 |
| Educational Services | 383,400 | 363,200 | 20,200 | 15,500 |
| Health Care | 1,496,600 | 1,488,900 | 7,700 | 19,300 |
| Social Assistance | 777,800 | 765,700 | 12,100 | 41,700 |
| Arts, Entertainment & Recreation | 306,700 | 307,900 | -1,200 | 5,500 |
| Accommodation | 224,700 | 224,700 | 0 | 4,200 |
| Food Services | 1,423,700 | 1,418,600 | 5,100 | 28,300 |
| Other Services | 585,200 | 581,300 | 3,900 | 18,200 |
| Government | 2,598,600 | 2,526,100 | 72,500 | 35,700 |
| Total Nonfarm | 16,944,700 | 16,805,300 | 139,400 | 258,200 |
| Total Wage and Salary | 17,403,500 | 17,286,500 | 117,000 | 256,500 |
At 256,800, California showed the second highest increase in seasonally adjusted nonfarm jobs among the states from October 2016 to October 2017, behind Texas at 316,100. By percentage growth in jobs, California dropped to 15th highest at 1.5%, near the US average of 1.4%. By population adjusted jobs growth, California dropped to 18th highest.
| Rank | Number of Jobs | Employment Growth (%) | Population Adjusted (job growth per 1,000 civilian noninstitutional population) |
|---|---|---|---|
| 1 | TX 316,100 | NV 2.8% | UT 17.6 |
| 2 | CA 256,800 | UT 2.7% | NV 15.8 |
| 3 | FL 197,500 | TX 2.6% | TX 15.1 |
| 4 | NY 102,600 | OR 2.5% | OR 14.0 |
| 5 | GA 87,800 | ID 2.4% | DC 13.2 |
| 6 | NC 75,200 | FL 2.3% | ID 13.0 |
| 7 | MA 69,000 | WA 2.1% | MA 12.5 |
| 8 | WA 68,500 | SC 2.1% | WA 11.9 |
| 9 | PA 65,800 | MD 2.0% | FL 11.8 |
| 10 | OH 59,400 | GA 2.0% | MD 11.5 |
| 11 | MD 54,400 | MA 1.9% | GA 11.1 |
| 12 | OR 46,300 | AR 1.9% | SC 10.9 |
| 13 | MI 45,100 | NC 1.7% | AR 10.1 |
| 14 | MN 42,600 | NM 1.6% | MN 9.8 |
| 15 | SC 42,500 | CA 1.5% | NC 9.5 |
| 16 | WI 42,400 | KY 1.5% | WI 9.3 |
| 17 | UT 39,000 | AL 1.5% | CO 8.7 |
| 18 | CO 37,800 | MN 1.5% | CA 8.4 |
| 19 | NV 36,600 | WI 1.4% | KY 8.3 |
| 20 | TN 34,800 | CO 1.4% | NM 8.2 |
| 21 | VA 33,700 | MT 1.2% | AL 7.6 |
| 22 | AZ 31,500 | OK 1.2% | MT 7.0 |
| 23 | MO 30,700 | TN 1.2% | OK 6.7 |
| 24 | NJ 30,000 | AZ 1.2% | NE 6.7 |
| 25 | IN 29,400 | PA 1.1% | TN 6.6 |
| 26 | AL 29,200 | HI 1.1% | OH 6.5 |
| 27 | KY 28,600 | NY 1.1% | HI 6.5 |
| 28 | AR 23,500 | OH 1.1% | NY 6.5 |
| 29 | OK 20,200 | MO 1.1% | MO 6.4 |
| 30 | IL 17,800 | MI 1.0% | PA 6.4 |
| 31 | ID 16,700 | VT 1.0% | VT 6.2 |
| 32 | IA 13,500 | NE 1.0% | AZ 5.8 |
| 33 | NM 13,200 | IN 0.9% | NH 5.8 |
| US 2,004,000 | US 1.4% | US 7.9 |
Four Industries Below 2007 Pre-Recession Job Levels
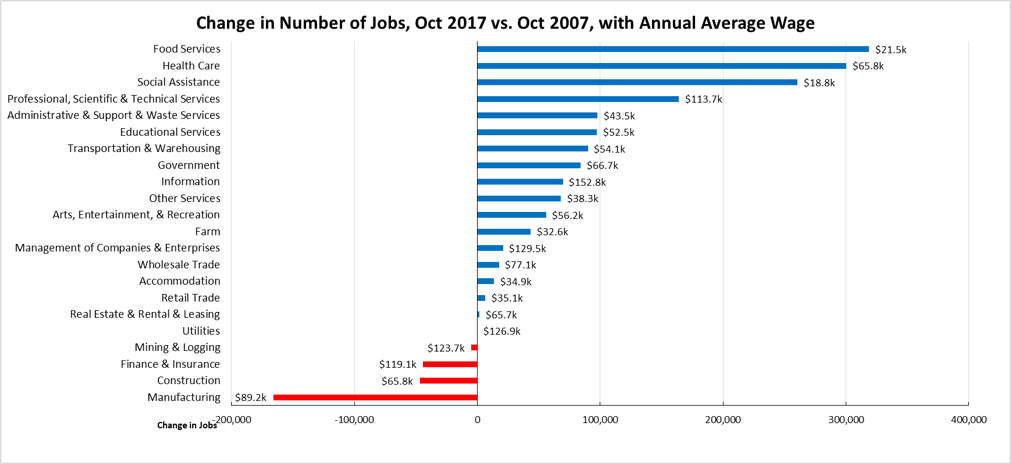
Comparing the number of jobs by industry in October 2017 (not seasonally adjusted), the state improved to 4 industries with employment below the 2007 pre-recession levels. The highest gain industries were led by lower wage Food Services, Health Care (with a relatively higher mix of lower and higher wage occupations), lower wage Social Assistance, and higher wage Professional, Scientific & Technical Services. Of the lagging industries, three—Manufacturing, Mining & Logging, and Construction—are blue collar middle class wage industries, while the higher wage Finance & Insurance also continued to lose ground.
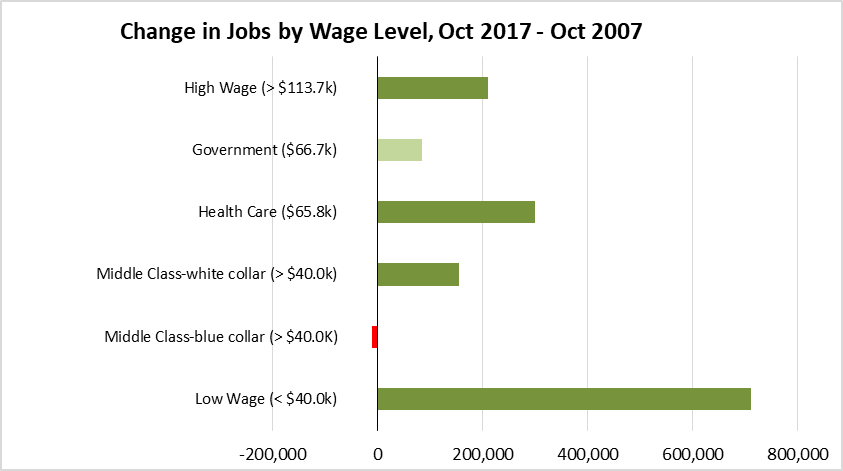
Job Gains by Wage Level
In the May Budget Revision, the Governor again pointed to the increasing share of lower wage jobs as one of the prime causes of slowing state revenues growth: The level of wages has been revised downward, and cash receipts have been significantly below forecast. The following chart illustrates this trend for total wage and salary jobs, according to the industry wage classification used previously in other Center analyses of this issue. As indicated, half of net jobs growth since the recession has been in the low wage industries. Middle Class-blue collar jobs continue to show a decline.
Two-Tier Economy Persists—Central Valley Unemployment More than Twice as High as Bay Area
While unemployment rates have improved in the interior counties as a result of seasonal employment, the level of unemployment rates (all data is not seasonally adjusted) continues to vary widely across the state, ranging from 3.1% in the Bay Area to more than twice as large at 7.3% in the Central Valley.
| Not Seasonally Adjusted | Unemployment Rate (%) October 2017 |
|---|---|
| California | 4.3 |
| Bay Area | 3.1 |
| Orange County | 3.3 |
| Sacramento | 4.1 |
| Central Coast | 4.2 |
| Los Angeles | 4.3 |
| Central Sierra | 4.5 |
| San Diego/Imperial | 4.5 |
| Inland Empire | 4.8 |
| Upstate California | 5.0 |
| Central Valley | 7.3 |
By Legislative District:
| Lowest 10 Unemployment Rates | |||||
|---|---|---|---|---|---|
| CD18 (Eshoo-D) | 2.4 | SD13 (Hill-D) | 2.3 | AD16 (Baker-R) | 2.2 |
| CD12 (Pelosi-D) | 2.5 | SD11 (Wiener-D) | 2.7 | AD22 (Mullin-D) | 2.2 |
| CD14 (Speier-D) | 2.7 | SD37 (Moorlach-R) | 2.9 | AD24 (Berman-D) | 2.4 |
| CD45 (Walters-R) | 2.7 | SD39 (Atkins-D) | 2.9 | AD28 (Low-D) | 2.5 |
| CD52 (Peters-D) | 2.7 | SD36 (Bates-R) | 3.0 | AD17 (Chiu-D) | 2.7 |
| CD17 (Khanna-D) | 2.8 | SD07 (Glazer-D) | 3.1 | AD77 (Maienschein-R) | 2.7 |
| CD15 (Swalwell-D) | 3.0 | SD10 (Wieckowski-D) | 3.2 | AD19 (Ting-D) | 2.8 |
| CD49 (Issa-R) | 3.0 | SD15 (Beall-D) | 3.2 | AD25 (Chu-D) | 2.8 |
| CD02 (Huffman-D) | 3.1 | SD26 (Allen-D) | 3.2 | AD73 (Brough-R) | 2.8 |
| CD33 (Lieu-D) | 3.1 | SD02 (McGuire-D) | 3.4 | AD78 (Gloria-D) | 2.8 |
| Highest 10 Unemployment Rates | |||||
|---|---|---|---|---|---|
| CD36 (Ruiz-D) | 5.5 | SD21 (Wilk-R) | 5.1 | AD80 (Gonzalez-D) | 5.8 |
| CD41 (Takano-D) | 5.5 | SD24 (de León-D) | 5.1 | AD34 (Fong-R) | 5.9 |
| CD09 (McNerney-D) | 5.8 | SD30 (Mitchell-D) | 5.1 | AD64 (Gipson-D) | 6.3 |
| CD10 (Denham-R) | 6.0 | SD35 (Bradford-D) | 5.3 | AD13 (Eggman-D) | 6.7 |
| CD44 (Barragán-D) | 6.1 | SD05 (Galgiani-D) | 6.0 | AD23 (Patterson-R) | 6.8 |
| CD23 (McCarthy-R) | 6.6 | SD08 (Berryhill-R) | 6.3 | AD21 (Gray-D) | 7.5 |
| CD22 (Nunes-R) | 7.5 | SD12 (Cannella-R) | 6.4 | AD31 (Arambula-D) | 8.9 |
| CD16 (Costa-D) | 8.2 | SD16 (Fuller-R) | 6.5 | AD26 (Mathis-R) | 9.1 |
| CD21 (Valadao-R) | 8.9 | SD40 (Hueso-D) | 8.0 | AD32 (Salas-D) | 9.1 |
| CD51 (Vargas-D) | 9.6 | SD14 (Vidak-R) | 10.0 | AD56 (Garcia-D) | 11.2 |
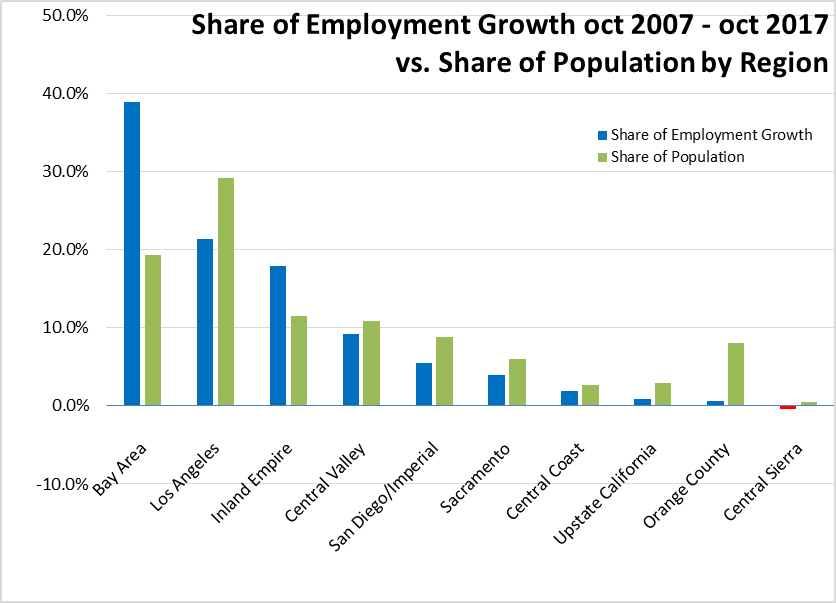
Bay Area Provided 39% of Net Employment Growth Since Recession
Containing 19.4% of the state’s population, the Bay Area was responsible for 38.9% of the net growth in employment since the pre-recession peaks in 2007. Los Angeles Region provided the next largest share at 21.4%, but spread over 29.2% of the population. Inland Empire is the only other region continuing to show employment gains above their population share.
Six California MSAs in the 10 Worst Unemployment Rates Nationally
According to BLS data, of the 10 Metropolitan Statistical Areas (MSAs) with the worst unemployment rates nationally, 6 are in California. Of the 20 worst, 10 are in California.
| Rank | Metropolitan Area | September 2017 Rate |
|---|---|---|
| 369 | Anchorage, AK Metropolitan Statistical Area | 6.3 |
| 370 | Brownsville-Harlingen, TX Metropolitan Statistical Area | 6.4 |
| 371 | Las Cruces, NM Metropolitan Statistical Area | 6.5 |
| 371 | Modesto, CA Metropolitan Statistical Area | 6.5 |
| 373 | Atlantic City-Hammonton, NJ Metropolitan Statistical Area | 6.6 |
| 373 | Madera, CA Metropolitan Statistical Area | 6.6 |
| 373 | Stockton-Lodi, CA Metropolitan Statistical Area | 6.6 |
| 376 | Vineland-Bridgeton, NJ Metropolitan Statistical Area | 6.7 |
| 377 | Yuba City, CA Metropolitan Statistical Area | 6.8 |
| 378 | Farmington, NM Metropolitan Statistical Area | 6.9 |
| 378 | McAllen-Edinburg-Mission, TX Metropolitan Statistical Area | 6.9 |
| 380 | Youngstown-Warren-Boardman, OH-PA Metropolitan Statistical Area | 7.1 |
| 381 | Fresno, CA Metropolitan Statistical Area | 7.5 |
| 381 | Hanford-Corcoran, CA Metropolitan Statistical Area | 7.5 |
| 381 | Merced, CA Metropolitan Statistical Area | 7.5 |
| 384 | Bakersfield, CA Metropolitan Statistical Area | 8.1 |
| 384 | Beaumont-Port Arthur, TX Metropolitan Statistical Area | 8.1 |
| 386 | Visalia-Porterville, CA Metropolitan Statistical Area | 9.5 |
| 387 | Yuma, AZ Metropolitan Statistical Area | 19.9 |
| 388 | El Centro, CA Metropolitan Statistical Area | 22.6 |
Note: All data sources, methodologies, and historical data series available at CenterforJobs.org.