Highlights for policy makers:
- Unemployment Dips to Record Low of 3.9%; Employment Up 50,000
- Labor Force Participation Rate Level at 62.1%
- Employment Growth Ranking—California Drops Back to 50th Highest
- Nonfarm Jobs Up 21,300 for Month; California Remains Ranked #1 for 12-month Gain
- Jobs Change by Industry
- Structural Shifts in State’s Economy
- Unemployment Rates by Region
- Unemployment Rates by Legislative District
- Employment Growth by Region
- MSAs with the Worst Unemployment Rates
- Chart of the Month: Disparate Pattern of the Economic Recovery in California
Unemployment Dips to Record Low of 3.9%; Employment Up 50,000
EDD reported total employment (seasonally adjusted; October preliminary) was up 50,000 from the revised September numbers, while the number of unemployed dropped 9,200. Unemployment rate dipped to a series low of 3.9%. The unadjusted rate was down 0.3 point from the year earlier to 3.7 percent. The improvement in the unemployment rate comes from the labor force continuing to level out, but with a shift in numbers to the employed.
California slipped slightly to the 17th highest unemployment rate among the states.
Total US employment saw a seasonally adjusted gain of 241,000, with the number of unemployed up by 86,000. The unemployment rate edged up to 3.6%. The unemployment rate change again reflects continuing growth of the total labor force on the national level.
Figure Sources: California Employment Development Department; US Bureau of Labor Statistics
Labor Force Participation Rate Level at 62.1%
After 3 months at its series low, California’s seasonally adjusted labor force participation rate showed some improvement to 62.1%. Nationally, the participation rate also edged up to 63.3%. The state continues to experience lower than average participation rates in spite of having a relatively younger population than the rest of the US.
For the 12 months ending October 2019, the seasonally adjusted data shows the California labor force shrank by 57,400 workers (-0.3% growth) compared to the rest of the US gain of 1.7 million (1.2%).
The continuing stall out in labor force growth has significant implications for the California economy. The increasing difficulty of finding qualified workers, and in some cases any workers, puts California businesses at a competitive disadvantage to other states where the current expansion continues to draw workers back into the labor force. At the same time, this situation produces caseload demands on state and local welfare and other social assistance budgets well above where they should be given the current stage of the extended recovery.
Employment Growth Ranking—California Drops Back to 50th Highest
In another sign of the economy’s slowing, the total number of persons employed (seasonally adjusted) over the 12 months ending in October again shrank, by 24,000. California dropped back to the 50th highest rank with Texas leading with an additional 220,500 persons employed over this period, and Florida in second place with a gain of 190,100.
Adjusted to account for differences in the size of each state economy, California had a 0.1% contraction in employment, below the average for the rest of the US with a gain of 1.4%. Ranked among the states, California’s growth rate remained in 46th place, while Alabama led with 2.7% growth.
Figure Source: US Bureau of Labor Statistics
Nonfarm Jobs Up 21,300 for Month; California Remains Ranked #1 for 12-month Gain
Nonfarm jobs (seasonally adjusted) were up 21,300 as September’s gains were revised to 26,700 from the previously reported 21,300.
For the 12 months ending October, total jobs growth was 308,000, keeping the state in 1st place behind Texas which gained 297,100 jobs in this period, with Florida in third at 228,600.
Adjusting for population size, California came in at 14th among the states, with a 12-month jobs growth rate of 1.8% compared to the rest of the US at 1.3%.
Figure Sources: California Employment Development Department; US Bureau of Labor Statistics
Jobs Change by Industry
In the unadjusted numbers that allow a more detailed look at industry shifts, hiring saw increases in all but one industry over the year.
Gains in payroll jobs were led by Social Assistance ($19.8k average annual wages), Government ($70.1k), and Health Care ($68.1k).
Retail Trade ($36.7k) showed a decline.
All wage data is from the most current 4-quarter average from the Quarterly Census of Employment & Wages.
| Not Seasonally Adjusted Payroll Jobs (1,000) | 19-Sep | 12-month change |
|---|---|---|
| Total Farm | 462.8 | 4.3 |
| Mining & Logging | 23.5 | 0.0 |
| Construction | 913.1 | 34.3 |
| Manufacturing | 1,346.9 | 12.2 |
| Wholesale Trade | 700.1 | 1.7 |
| Retail Trade | 1,679.7 | -5.7 |
| Utilities | 57.3 | 0.4 |
| Transportation & Warehousing | 632.0 | 11.8 |
| Information | 559.4 | 0.8 |
| Finance & Insurance | 548.9 | 7.0 |
| Real Estate & Rental & Leasing | 302.8 | 8.1 |
| Professional, Scientific & Technical Services | 1,328.3 | 28.8 |
| Management of Companies & Enterprises | 258.8 | 4.9 |
| Administrative & Support & Waste Services | 1,186.6 | 28.3 |
| Educational Services | 404.0 | 14.3 |
| Health Care | 1,588.9 | 35.5 |
| Social Assistance | 860.2 | 41.1 |
| Arts, Entertainment & Recreation | 316.3 | 5.3 |
| Accommodation | 240.4 | 7.8 |
| Food Services | 1,473.9 | 33.2 |
| Other Services | 576.1 | 0.9 |
| Government | 2,655.4 | 37.6 |
| Total Nonfarm | 17,652.6 | 308.3 |
| Total Wage & Salary | 18,115.4 | 312.6 |
Figure Source: California Employment Development Department
Structural Shifts in State’s Economy
Comparing current job numbers to the pre-recession levels in 2007 illustrates the structural shift in the state’s economy, with the primary jobs growth occurring in the higher and lower wage industries.
Jobs growth within the traditional middle class wage—especially blue collar industries such as Manufacturing, Mining & Logging, and Utilities—continues to lag. After stronger gains during the recovery, both Wholesale and Retail Trade have continued to show weakness, reflecting competitive pressures from nontraditional channels at the same time these industries have been weakened by state policies producing higher operating costs. Finance & Insurance also remains in the negative column as companies have moved back office and other operations out of the state.
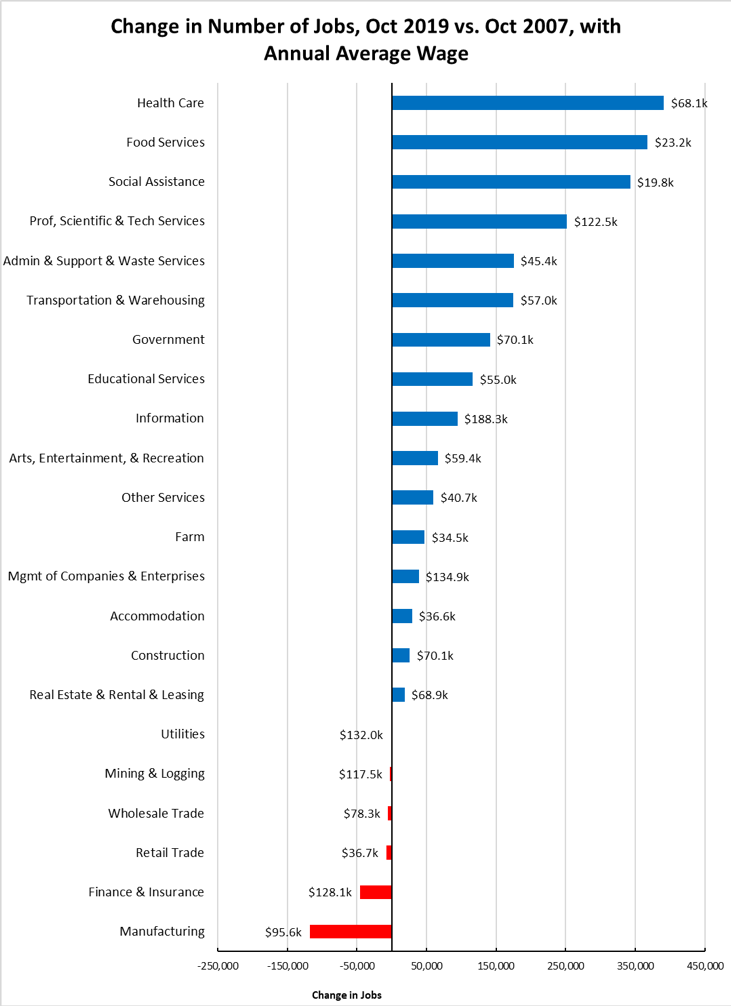
Figure Source: California Employment Development Department
Unemployment Rates by Region
| wdt_ID | Region | Unemployment Rates |
|---|---|---|
| 1 | California | 3.7 |
| 2 | Bay Area | 2.3 |
| 3 | Orange County | 2.5 |
| 4 | Sacramento | 3.1 |
| 5 | Central Coast | 3.3 |
| 6 | Central Sierra | 3.3 |
| 7 | San Diego/Imperial | 3.7 |
| 8 | Inland Empire | 3.7 |
| 9 | Upstate California | 4.1 |
| 10 | Los Angeles | 4.4 |
| 11 | Central Valley | 5.9 |
Figure Source: California Employment Development Department
Unemployment Rates by Legislative District
Lowest
| wdt_ID | Congressional District | Unemployment Rate |
|---|---|---|
| 1 | CD18 (Eshoo-D) | 1.8 |
| 2 | CD12 (Pelosi-D) | 1.9 |
| 3 | CD14 (Speier-D) | 2.0 |
| 4 | CD17 (Khanna-D) | 2.1 |
| 5 | CD15 (Swalwell-D) | 2.1 |
| 6 | CD52 (Peters-D) | 2.2 |
| 7 | CD49 (Levin-D) | 2.2 |
| 8 | CD45 (Porter-D) | 2.3 |
| 9 | CD48 (Rouda-D) | 2.3 |
| 10 | CD02 (Huffman-D) | 2.4 |
| wdt_ID | Senate District | Unemployment Rate |
|---|---|---|
| 1 | SD13 (Hill-D) | 1.7 |
| 2 | SD11 (Wiener-D) | 2.0 |
| 3 | SD36 (Bates-R) | 2.3 |
| 4 | SD37 (Moorlach-R) | 2.3 |
| 5 | SD39 (Atkins-D) | 2.3 |
| 6 | SD10 (Wieckowski-D) | 2.3 |
| 7 | SD15 (Beall-D) | 2.4 |
| 8 | SD07 (Glazer-D) | 2.4 |
| 9 | SD02 (McGuire-D) | 2.6 |
| 10 | SD38 (Jones-R) | 2.8 |
| wdt_ID | Assembly District | Unemployment Rate |
|---|---|---|
| 1 | AD22 (Mullin-D) | 1.6 |
| 2 | AD16 (Bauer-Kahan-D) | 1.7 |
| 3 | AD24 (Berman-D) | 1.8 |
| 4 | AD17 (Chiu-D) | 1.9 |
| 5 | AD28 (Low-D) | 2.0 |
| 6 | AD19 (Ting-D) | 2.1 |
| 7 | AD25 (Chu-D) | 2.1 |
| 8 | AD78 (Gloria-D) | 2.2 |
| 9 | AD73 (Brough-R) | 2.2 |
| 10 | AD10 (Levine-D) | 2.2 |
Highest
| wdt_ID | Congressional District | Unemployment Rate |
|---|---|---|
| 1 | CD34 (Gomez-D) | 4.9 |
| 2 | CD29 (Cardenas-D) | 4.9 |
| 3 | CD43 (Waters-D) | 5.2 |
| 4 | CD40 (Roybal-Allard-D) | 5.2 |
| 5 | CD22 (Nunes-R) | 5.8 |
| 6 | CD23 (McCarthy-R) | 5.6 |
| 7 | CD16 (Costa-D) | 6.4 |
| 8 | CD44 (Barragan-D) | 6.2 |
| 9 | CD21 (Cox-D) | 7.3 |
| 10 | CD51 (Vargas-D) | 8.5 |
| wdt_ID | Senate District | Unemployment Rate |
|---|---|---|
| 1 | SD14 (Hurtado-D) | 8.2 |
| 2 | SD40 (Hueso-D) | 7.1 |
| 3 | SD35 (Bradford-D) | 5.5 |
| 4 | SD30 (Mitchell-D) | 5.3 |
| 5 | SD33 (Gonzalez-D) | 5.1 |
| 6 | SD16 (Grove-R) | 5.3 |
| 7 | SD24 (Durazo-D) | 5.0 |
| 8 | SD12 (Caballero-D) | 5.2 |
| 9 | SD21 (Wilk-R) | 4.8 |
| 10 | SD18 (Hertzberg-D) | 4.8 |
| wdt_ID | Assembly District | Unemployment Rate |
|---|---|---|
| 1 | AD13 (Eggman-D) | 5.5 |
| 2 | AD51 (Carrillo-D) | 5.5 |
| 3 | AD36 (Lackey-R) | 5.6 |
| 4 | AD21 (Gray-D) | 5.8 |
| 5 | AD59 (Jones-Sawyer-D) | 6.0 |
| 6 | AD64 (Gipson-D) | 6.2 |
| 7 | AD31 (Arambula-D) | 7.1 |
| 8 | AD32 (Salas-D) | 7.3 |
| 9 | AD26 (Mathis-R) | 7.8 |
| 10 | AD56 (Garcia-D) | 10.4 |
Employment Growth by Region
Containing 19.5% of the state’s population, the Bay Area has accounted for 38.0% of net employment growth compared to pre-recession levels. Los Angeles Region, with 29.0% of the population, accounted for only 16.6% of net employment gains, while Inland Empire continues to rank the second highest.
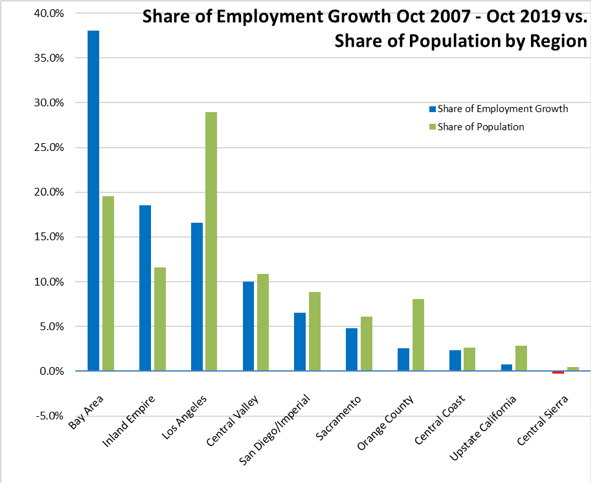
Figure Sources: California Employment Development Department; Department of Finance
MSAs with the Worst Unemployment Rates
Of the 20 Metropolitan Statistical Areas (MSAs) with the worst unemployment rates in September 2018, 6 are in California, including El Centro MSA (Imperial County) with the highest rate nationally.
| wdt_ID | MSA | Unemp. | Rank (out of 389) |
|---|---|---|---|
| 1 | El Centro MSA | 20.7 | 389 |
| 2 | Visalia-Porterville MSA | 7.6 | 387 |
| 3 | Bakersfield MSA | 6.0 | 385 |
| 4 | Hanford-Corcoran MSA | 5.7 | 383 |
| 5 | Merced MSA | 5.5 | 379 |
| 6 | Fresno MSA | 5.3 | 371 |
Figure Source: US Bureau of Labor Statistics, September 2018 data
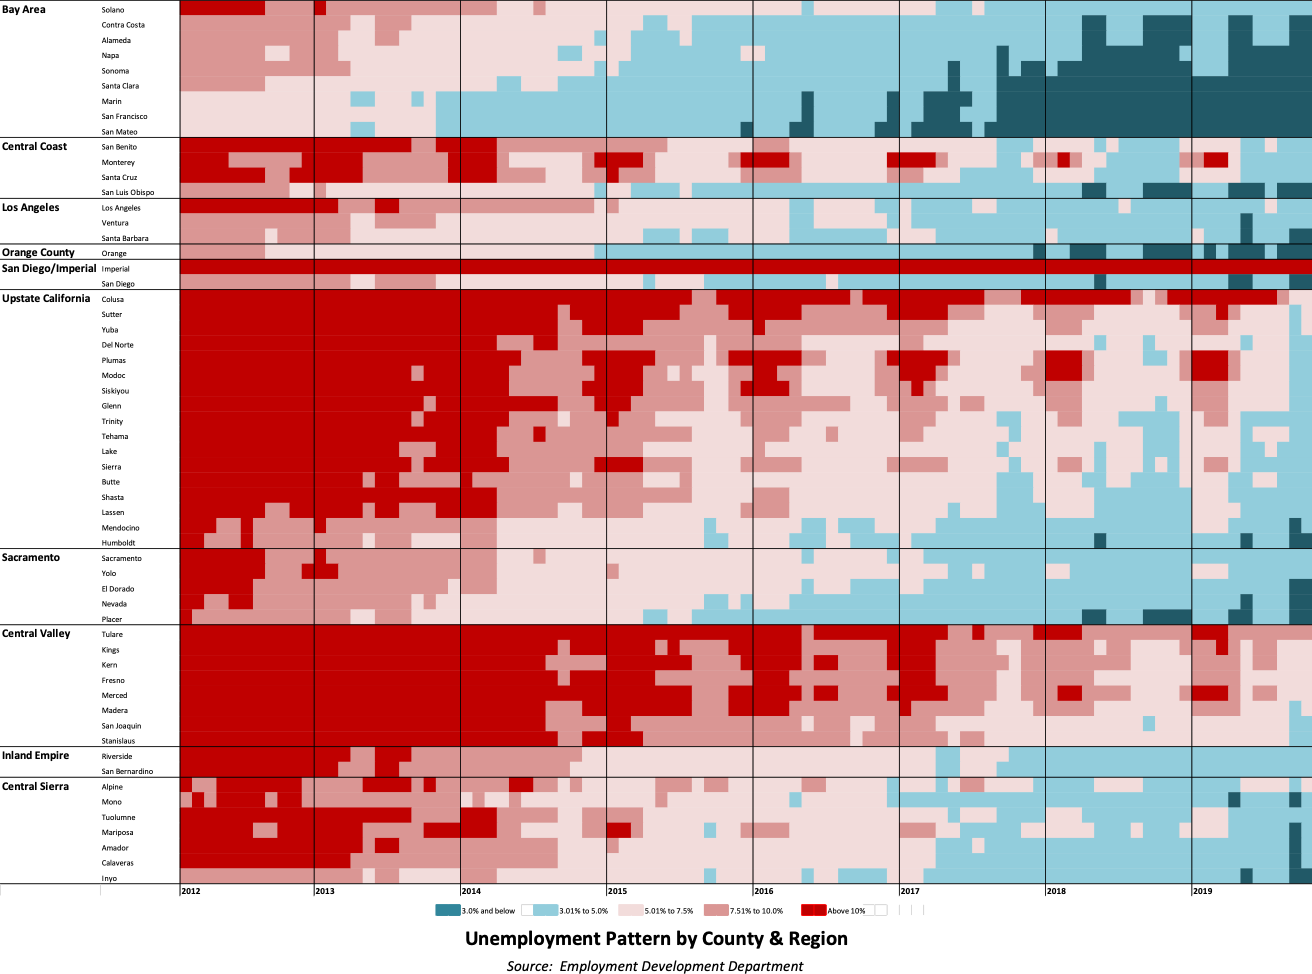
Chart of the Month: Disparate Pattern of the Economic Recovery in California
The following chart provides a graphic summary of the economic recovery that began in California in February 2012, and how the different regions and counties fared in this period. The lighter blue lines indicate unemployment rates of between 3% and 5%, accounting for most definitions of full employment. The darker blue lines cover counties with unemployment rates below 3%, generally regarded as a level indicating labor shortages. The red lines indicate gradations above these levels, with the darkest red indicating rates of over 10% unemployment.
Some general conclusions become apparent when viewing the data in this form. First, the Bay Area showed by far the quickest recovery and along with a few other primarily coastal counties and Sacramento Region foothill counties now dominates the portion of the state with the lowest unemployment rates. Reflecting the general conditions of the current recovery as one of the slowest on record, the interior regions have demonstrated much more delayed improvement, with large portions of the Central Valley and Imperial County well behind the rest of the state and, as indicated in the monthly MSA rankings, still leading the state and the nation in terms of unemployment.