Highlights for policy makers:
- COVID-19 and the State Economy
- Employment: 1.265 Million Below Recovery
- Labor Force Participation Rate Up at 61.6%
- Employment Growth Ranking
- Nonfarm Jobs: 1.470 Million Below Recovery
- Jobs Change by Industry
- Unemployment Rates by Region (not seasonally adjusted)
- Unemployment Rates by Legislative District (not seasonally adjusted)
- How Far Back Has the Economy in Each County Been Pushed?
- Employment Share by Region
- MSAs with the Worst Unemployment Rates: Los Angeles Remains 6th Worst in Nation
COVID-19 and the State Economy
While generally more positive than in recent months, the October employment and job numbers continue to reflect more the conditions existing at the time the surveys used to estimate the data were conducted rather than current conditions in the state economy. The surveys used for the October data were done the same week the state initiated its Blueprint for a Safer Economy, allowing the resumption of business operations in many parts of the state. The October numbers, consequently, show an upsurge in employment comparable to the one following the similar reopening in June. The job numbers, however, largely reflect a continuation of the recovery trend from the past two months.
Last week’s shifts in the county tiers announced by the governor essentially constitute a third shutdown of state businesses, concentrated on the lower wage, service jobs that continue to bear the brunt of the state restrictions. Due to the timing of the employment and job surveys, the effects of these actions will not be fully reflected in the data until the December estimates are released later in January.
October Numbers in Context: Job and Employment Numbers Diverge
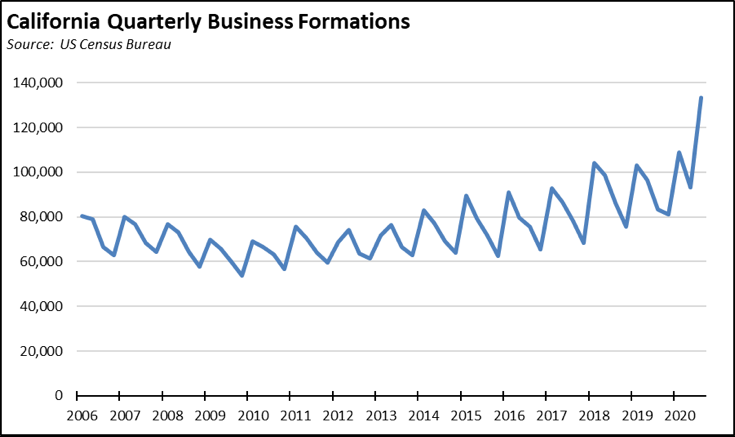
The difference in the October numbers, however, indicate a reemergence of a divergence in the employment and job numbers. While there are technical reasons for this split that may become resolved in future updates and revisions, this divergence also suggests that as the shutdowns lengthen, many workers are again starting their own businesses much as they did to cope with the prior recession that began in 2008. Their success in pursuing this strategy successfully under the current circumstances, however, is hindered by last year’s passage of AB 5 along with other restrictions adopted by the state both through legislation and under the current emergency provisions issued by the governor.
Some evidence of this shift is provided by the Census Bureau’s experimental Business Formation data, which is based on applications for an Employer Identification Numbers through filings of IRS Form SS-4. As indicated in the chart, new business applications tracked through this source have risen significantly during the current pandemic crisis. Other anecdotal evidence suggests that part of the surge is also being driven by telecommuting workers who are starting a side business as an additional income source or potentially as a future employment shift as they disperse geographically. Taking the second and third quarters combined to reflect activity during the pandemic conditions, applications were up 26% over the same period in 2019 for California. Reflecting the regulatory restrictions in the state as above, new business formation was much stronger in the rest of the country at 35% growth.
October Numbers in Context: Effects on Housing
Viewed by industry and by wage, the current strategy of business, school, and other restrictions followed by the state have resulted in the heaviest burdens on lower wage workers and households. This trend has served to intensify the two-tier structure of the state’s economy, with additional barriers now being imposed through reduction of job opportunities and the threat of long term unemployment leading to permanent reductions in life-time earnings potential for many of these workers.
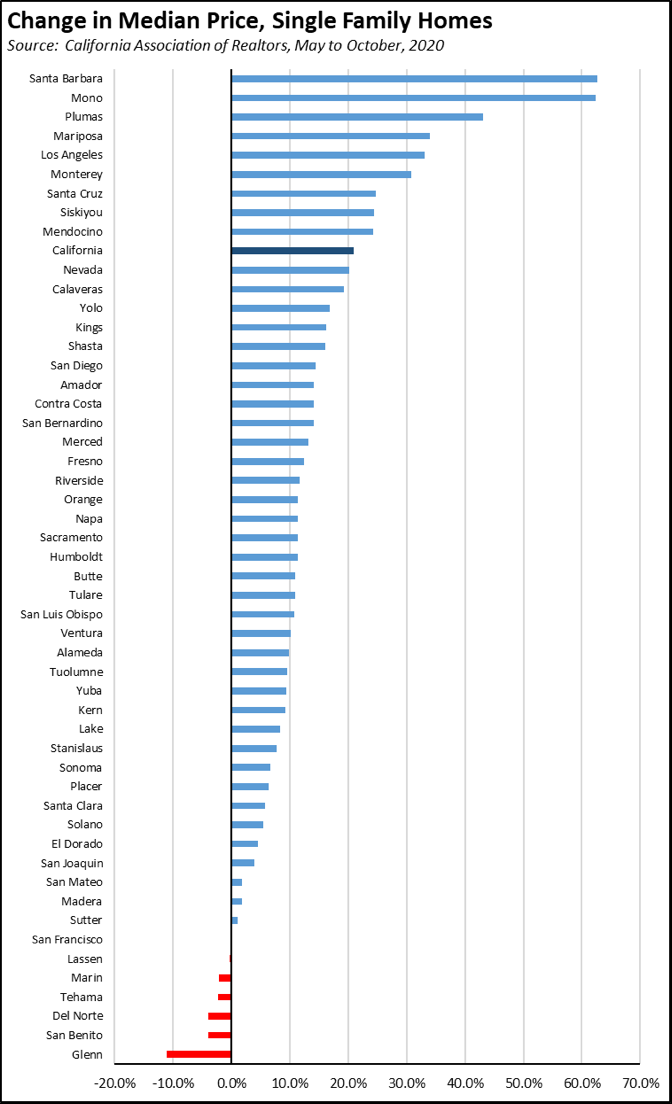
Further evidence of growing dominance of the two-tier structure is being provided through the housing market. Higher wage workers especially those retaining their jobs by telecommuting have helped boost housing prices overall even during the current crisis as they seek safer venues outside the congested coastal urban areas and as they seek larger spaces better able to accommodate both work from home for themselves and learning from home for their children.
After growing 2.1% in 2018 and 6.8% in 2019, the median price of existing single family homes in California spiked 21.0% between May and October this year. There was much stronger price growth in outlying areas compared to the coastal urban areas especially the Bay Area that has seen movement by telecommuting tech workers.
In addition to this new source of demand, price appreciation has been driven as well by the failure of the state to enact substantive reforms to reverse the trend of inadequate supply. What reforms that have been done to date have focused primarily on affordable housing and rentals. Little has been done to promote construction of housing for ownership in particular by lower and middle income households.
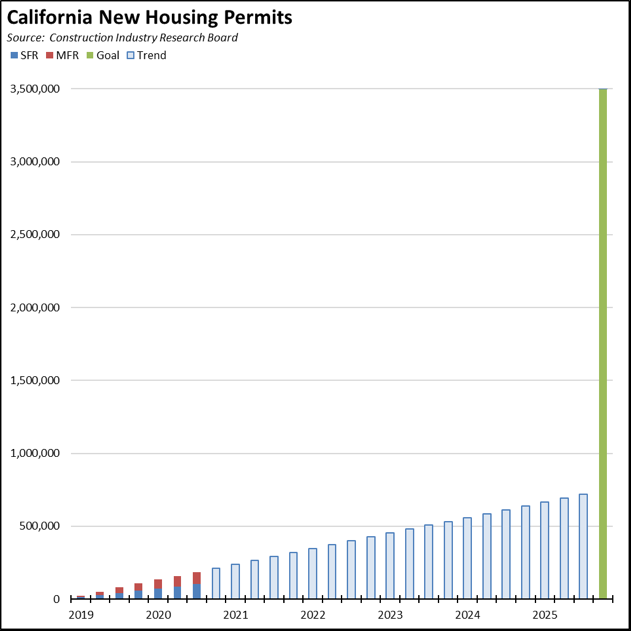
While the current supply situation has been challenged further by the pandemic restrictions, the number of new housing units in 2020 to date is only 7% below the outcome in 2019. As a consequence, the state has fallen well behind the governor’s announced goal of 3.5 million new housing units by 2025. Since 2019, only 184,837 new units have been permitted through the 3rd quarter of 2020. In this same period, Texas has seen permits for 363,206 new units and Florida 272,768 units, in part to accommodate Californians moving to those states in search of more affordable housing.
At the current rate, only about 750,000 units would be permitted in California by the end of 2025, or only about 60% of the new units required just to keep up with population growth and only 21% of the 3.5 million goal.
The failure of the state to enact meaningful supply reforms means that the current migrations of higher income households is exacerbating the housing challenges for the lower and middle income ones. Housing prices are rising rapidly even as incomes for the lower tier remain uncertain. Available supply is being bid away, diminishing even further the prospects for home ownership and consequently long term wealth accumulation for those now hit hardest by the state’s closure strategies. The most the state has been able to offer to date is the prospect of renting ever smaller spaces. This is a situation likely to lead to the perpetuation if not the intensification of the state’s prior income and wealth divides.
Employment: 1.265 Million Below Recovery
EDD reported that employment (seasonally adjusted; October preliminary) growth rose substantially in October to 888,600 above the revised September numbers, while the number of unemployed dropped by 279,300. The reported unemployment rate improved 1.8 points to 9.3%. The unadjusted rate was 5.4 points worse than the year earlier at 9.0%.
California edged down to the 5th highest unemployment rate among the states.
Total US employment saw a seasonally adjusted gain of 2,243,000, with the number of unemployed dropping by 1,519,000. The reported unemployment rate dropped 1.0 point to 6.9%.
Figure Sources: California Employment Development Department; US Bureau of Labor Statistics
Compared to the February 2020 numbers (seasonally adjusted) just prior to the current crisis and not accounting for population changes, employment in California still was 1,265,310 short of recovery.
Labor Force Participation Rate Up at 61.6%
California’s seasonally adjusted labor force participation rate rose by 1.9 points to 61.6%. Nationally, the participation rate was up 0.3 point to 61.7%.
For the 12 months ending October 2020, the seasonally adjusted data shows the California labor force was down 207,500 workers (-1.1% loss) compared to the rest of the US loss of 3,326,500 (-2.3%).
Employment Growth Ranking
The total number of persons employed (seasonally adjusted) over the 12 months ending in October was still down 1,240,000. California had the lowest level among the states in terms of absolute employment loss over the year. Number 2 New York showed a loss of 939,400, #3 Florida at 675,200, and #4 Texas at 551,900.
Adjusted to account for differences in the size of each state economy, California over the year showed a 6.6% contraction, worse than the rest of the US with a loss of 5.4%. Ranked among the states, California had the 12th worst loss rate.
Figure Source: US Bureau of Labor Statistics
Nonfarm Jobs: 1.470 Million Below Recovery
Nonfarm jobs (seasonally adjusted) rose 145,500 (seasonally adjusted) in October, while the gains in September were revised to 102,400 from the previously reported 96,000.
Nonfarm jobs were down 1,369,400 over the year. Adjusting for population, California loss rate remained 44th among the states. The 12-month jobs loss rate was -7.8% compared to the rest of the US at -5.8%.
Figure Sources: California Employment Development
Department; US Bureau of Labor Statistics
Compared to the February 2020 numbers (seasonally adjusted) just prior to the current crisis and not accounting for population changes, nonfarm wage and salary jobs in California were still 1,470,300 short of recovery.
Jobs Change by Industry
In the unadjusted numbers that allow a more detailed look at industry shifts, all but 2 industries continued to post job losses over the 12-month period. Utilities as an essential service and Finance & Insurance with a high incidence of telework opportunities again were positive.
Industries showing the greatest contractions over the year were led by Food Services, Government, Arts, Entertainment & Recreation, and Other Services. For Government, most of the loss was in Local Government Education, which was down 133,300 over the year.
| Not Seasonally Adjusted Payroll Jobs (1,000) | October 2020 | 12-month change | Nonfarm Growth Rank | % 12-month Change | Avg. Annual Wage |
|---|---|---|---|---|---|
| Total Farm | 373.8 | -86.9 | -18.9% | $35.5k | |
| Mining & Logging | 22.0 | -1.0 | 3 | -4.3% | $119.5k |
| Construction | 885.4 | -16.1 | 7 | -1.8% | $72.5k |
| Manufacturing | 1,228.5 | -95.0 | 16 | -7.2% | $97.1k |
| Wholesale Trade | 658.7 | -35.7 | 9 | -5.1% | $80.4k |
| Retail Trade | 1,550.7 | -102.1 | 17 | -6.2% | $37.7k |
| Utilities | 56.9 | 0.1 | 2 | 0.2% | $137.0k |
| Transportation & Warehousing | 637.8 | -21.6 | 8 | -3.3% | $62.0k |
| Information | 526.3 | -43.3 | 12 | -7.6% | $188.7k |
| Finance & Insurance | 553.1 | 11.1 | 1 | 2.0% | $133.0k |
| Real Estate & Rental & Leasing | 293.6 | -13.9 | 4 | -4.5% | $71.2k |
| Professional, Scientific & Technical Services | 1,331.7 | -14.2 | 5 | -1.1% | $126.8k |
| Management of Companies & Enterprises | 239.7 | -15.6 | 6 | -6.1% | $135.1k |
| Administrative & Support & Waste Services | 1,074.7 | -78.6 | 14 | -6.8% | $47.3k |
| Educational Services | 345.7 | -50.8 | 13 | -12.8% | $56.0k |
| Health Care | 1,553.8 | -36.4 | 10 | -1.5% | $69.6k |
| Social Assistance | 812.5 | -40.5 | 11 | -4.7% | $20.9k |
| Arts, Entertainment & Recreation | 207.3 | -115.2 | 19 | -35.7% | $60.0k |
| Accommodation | 153.6 | -87.0 | 15 | -36.2% | $39.7k |
| Food Services | 1,165.2 | -311.3 | 21 | -21.1% | $24.1k |
| Other Services | 476.1 | -105.2 | 18 | -18.1% | $41.9k |
| Government | 2,464.5 | -183.5 | 20 | -6.9% | $72.0k |
| Total Nonfarm | 16,237.8 | -1,355.8 | -7.7% | ||
| Total Wage & Salary | 16,611.6 | -1,442.7 | -8.0% | ||
Figure Source: California Employment Development Department;
Wages based on most recent Quarterly Census of Employment & Wages
Unemployment Rates by Region (not seasonally adjusted)
Unemployment rates continued to reflect the regional mix of jobs that have been retained through telework compared to relative shares of lower wage services and tourism jobs that have been hit the hardest by the state-ordered closures and other restrictions.
| wdt_ID | Region | Unemployment Rates |
|---|---|---|
| 2 | California | 9.0 |
| 6 | Bay Area | 6.9 |
| 10 | Central Coast | 7.1 |
| 14 | Upstate California | 7.4 |
| 18 | Sacramento | 7.5 |
| 22 | Orange County | 7.5 |
| 26 | Central Sierra | 7.6 |
| 30 | San Diego/Imperial | 8.2 |
| 34 | Inland Empire | 9.0 |
| 38 | Central Valley | 9.8 |
| 39 | Los Angeles | 11.5 |
Figure Source: California Employment Development Department
Unemployment Rates by Legislative District (not seasonally adjusted)
Lowest
| wdt_ID | Congressional District | Unemployment Rate |
|---|---|---|
| 2 | CD18 (Eshoo-D) | 4.9 |
| 3 | CD17 (Khanna-D) | 5.8 |
| 4 | CD02 (Huffman-D) | 6.1 |
| 5 | CD24 (Carbajal-D) | 6.2 |
| 6 | CD52 (Peters-D) | 6.2 |
| 7 | CD49 (Levin-D) | 6.1 |
| 9 | CD04 (McClintock-R) | 6.5 |
| 10 | CD12 (Pelosi-D) | 6.5 |
| 12 | CD15 (Swalwell-D) | 6.7 |
| 13 | CD14 (Speier-D) | 6.7 |
| wdt_ID | Senate District | Unemployment Rate |
|---|---|---|
| 2 | SD13 (Hill-D) | 5.3 |
| 3 | SD01 (Dahle-R) | 6.1 |
| 4 | SD15 (Beall-D) | 6.3 |
| 5 | SD36 (Bates-R) | 6.3 |
| 6 | SD02 (McGuire-D) | 6.4 |
| 7 | SD10 (Wieckowski-D) | 6.6 |
| 8 | SD39 (Atkins-D) | 6.4 |
| 9 | SD17 (Monning-D) | 6.9 |
| 10 | SD19 (Jackson-D) | 7.0 |
| 11 | SD37 (Moorlach-R) | 7.0 |
| wdt_ID | Assembly District | Unemployment Rate |
|---|---|---|
| 2 | AD28 (Low-D) | 5.0 |
| 3 | AD16 (Bauer-Kahan-D) | 5.3 |
| 4 | AD22 (Mullin-D) | 5.5 |
| 5 | AD24 (Berman-D) | 5.3 |
| 6 | AD78 (Gloria-D) | 6.0 |
| 7 | AD10 (Levine-D) | 5.8 |
| 8 | AD25 (Chu-D) | 5.8 |
| 9 | AD06 (Kiley-R) | 5.6 |
| 10 | AD77 (Maienschein-R) | 6.2 |
| 11 | AD04 (Aguiar-Curry-D) | 6.3 |
Highest
| wdt_ID | Congressional District | Unemployment Rate |
|---|---|---|
| 2 | CD21 (Cox-D) | 11.8 |
| 3 | CD28 (Schiff-D) | 12.0 |
| 4 | CD32 (Napolitano-D) | 12.0 |
| 5 | CD43 (Waters-D) | 12.8 |
| 6 | CD29 (Cardenas-D) | 12.6 |
| 7 | CD37 (Bass-D) | 12.2 |
| 9 | CD34 (Gomez-D) | 13.0 |
| 10 | CD51 (Vargas-D) | 13.6 |
| 12 | CD40 (Roybal-Allard-D) | 14.2 |
| 13 | CD44 (Barragan-D) | 15.9 |
| wdt_ID | Senate District | Unemployment Rate |
|---|---|---|
| 2 | SD32 (Archuleta-D) | 10.3 |
| 3 | SD22 (Rubio-D) | 11.0 |
| 4 | SD40 (Hueso-D) | 12.3 |
| 5 | SD14 (Hurtado-D) | 12.8 |
| 6 | SD18 (Hertzberg-D) | 12.7 |
| 7 | SD21 (Wilk-R) | 12.7 |
| 9 | SD24 (Durazo-D) | 13.3 |
| 10 | SD33 (Gonzalez-D) | 13.7 |
| 12 | SD30 (Mitchell-D) | 13.7 |
| 13 | SD35 (Bradford-D) | 13.9 |
| wdt_ID | Assembly District | Unemployment Rate |
|---|---|---|
| 2 | AD32 (Salas-D) | 12.3 |
| 3 | AD48 (Rubio-D) | 12.3 |
| 4 | AD62 (Burke-D) | 12.5 |
| 5 | AD36 (Lackey-R) | 14.1 |
| 6 | AD46 (Nazarian-D) | 13.9 |
| 7 | AD56 (Garcia-D) | 13.4 |
| 9 | AD63 (Rendon-D) | 14.8 |
| 10 | AD51 (Carrillo-D) | 15.1 |
| 12 | AD64 (Gipson-D) | 15.3 |
| 13 | AD59 (Jones-Sawyer-D) | 15.8 |
How Far Back Has the Economy in Each County Been Pushed?
As an indication of the severity of the current economic downturn, the following chart illustrates how much economic ground each county has lost using employment levels as the measure. Based on annual averages, the chart below indicates the last year each county saw the October employment numbers. Because the current series only goes back to 1990 for most counties, several of the entries indicate “Before 1990.” Los Angeles County is the exception, with data going back to 1976. The “Change” column indicates the change from April, the month reflecting the effects of the initial round of closures.
| wdt_ID | County | Last Year Employment Equal To or Less Than April | Last Year Employment Equal to or Less Than October | Change |
|---|---|---|---|---|
| 2 | Alameda County | 2009 | 2014 | 5 |
| 3 | Alpine County | 2009 | 2009 | 0 |
| 4 | Amador County | 1997 | 2015 | 18 |
| 5 | Butte County | 1998 | 2012 | 14 |
| 6 | Calaveras County | 2012 | 2015 | 3 |
| 7 | Colusa County | 1999 | 2012 | 13 |
| 8 | Contra Costa County | 1997 | 2014 | 17 |
| 9 | Del Norte County | 1992 | 1993 | |
| 10 | El Dorado County | 1999 | 2017 | 18 |
| 11 | Fresno County | 2012 | 2017 | 5 |
| County | Last Year Employment Equal To or Less Than April | Last Year Employment Equal to or Less Than October | Change |
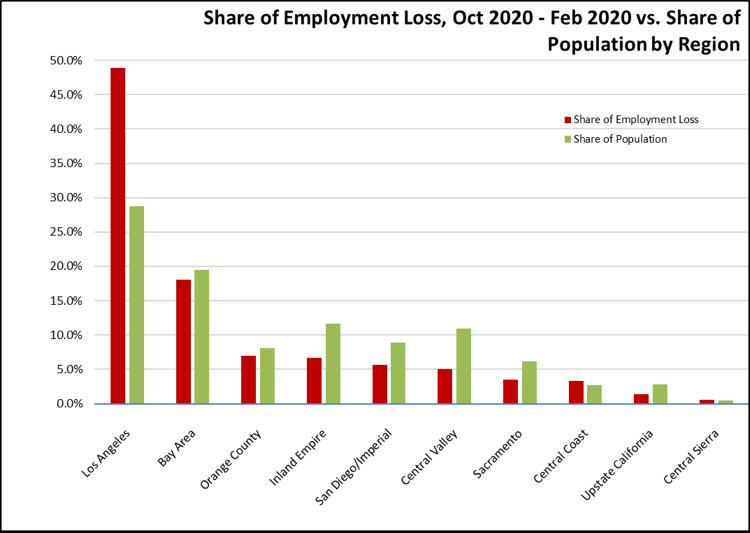
Employment Share by Region
The following chart compares change in employment (compared to pre-COVID February 2020) vs. population share as a measure of the disparate economic effects from the social distancing measures. Los Angeles Region, which experienced relatively greater job creation in lower income, population-serving and tourism industries during the recently ended expansion period, accounted for just under half of the employment loss in October. Regions such as the Bay Area and San Diego with a greater incidence of jobs amenable to telework have been slightly less impacted. Regions such as the Central Valley and Inland Empire with a higher degree of essential businesses but also effects from seasonal factors have shown somewhat greater resiliency.
MSAs with the Worst Unemployment Rates: Los Angeles Remains 6th Worst in Nation
California had 11 MSAs among the 25 regions with the worst unemployment rates in September. As a result of a pattern of jobs growth in recent years that concentrated on the hardest-hit lower wage, population-serving and tourism service industries in Los Angeles County, Los Angeles-Long Beach-Anaheim MSA (Los Angeles and Orange Counties) remained the 6th worst in the nation.
| wdt_ID | MSA | September Unemployment Rate | US Rank out of 389 |
|---|---|---|---|
| 1 | El Centro MSA | 21.5 | 388 |
| 2 | Los Angeles-Long Beach-Anaheim MSA | 13.6 | 384 |
| 3 | Bakersfield MSA | 12.4 | 380 |
| 4 | Visalia-Porterville MSA | 12.2 | 379 |
| 5 | Stockton-Lodi MSA | 11.4 | 377 |
| 6 | Merced MSA | 10.6 | 372 |
| 7 | Yuba City MSA | 10.4 | 368 |
| 8 | Riverside-San Bernardino-Ontario MSA | 10.4 | 368 |
| 9 | Fresno MSA | 10.4 | 368 |
| 10 | Modesto MSA | 10.3 | 366 |
| 11 | Hanford-Corcoran MSA | 10.3 | 366 |