The Center for Jobs and the Economy has released our initial analysis of the October Employment Report from the California Employment Development Department.
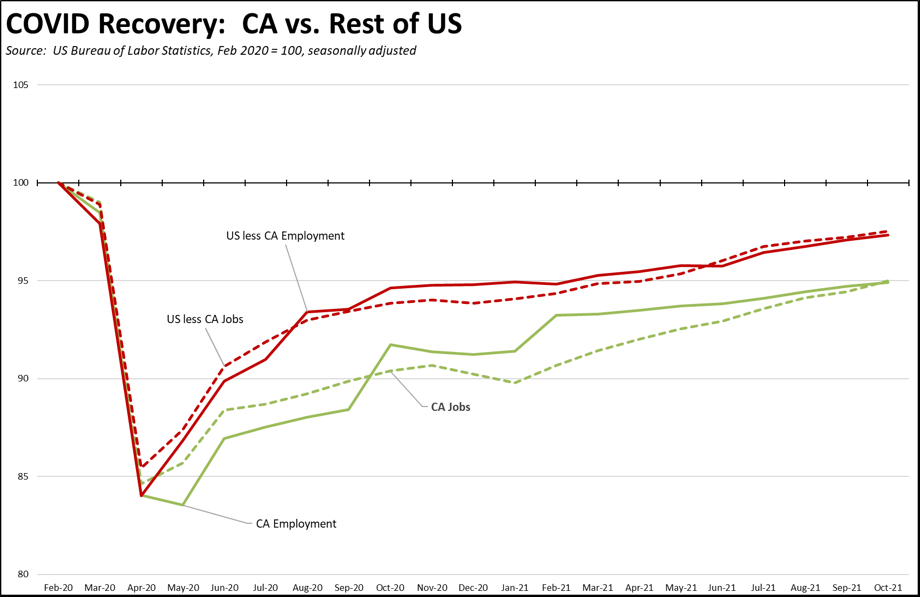
While the October job and employment numbers were again positive, California’s recovery progress continued to lag behind the rest of the country. The stronger non-farm jobs numbers reported in October, however, reflect the first full months’ worth of results following the end of the federal enhanced unemployment benefits in September. Jobs were up as more workers turned from the pandemic period reliance on social benefit programs back to jobs. This effect in particular was seen in strong results coming from population serving and tourism related services jobs in Accommodation & Food Services, Arts, Entertainment & Recreation, and Retail Trade. The results in California were also reflected in the sharpest upward revision to date in the national nonfarm job numbers for June to September, covering the period just after the early termination of the enhanced benefits by half the states.
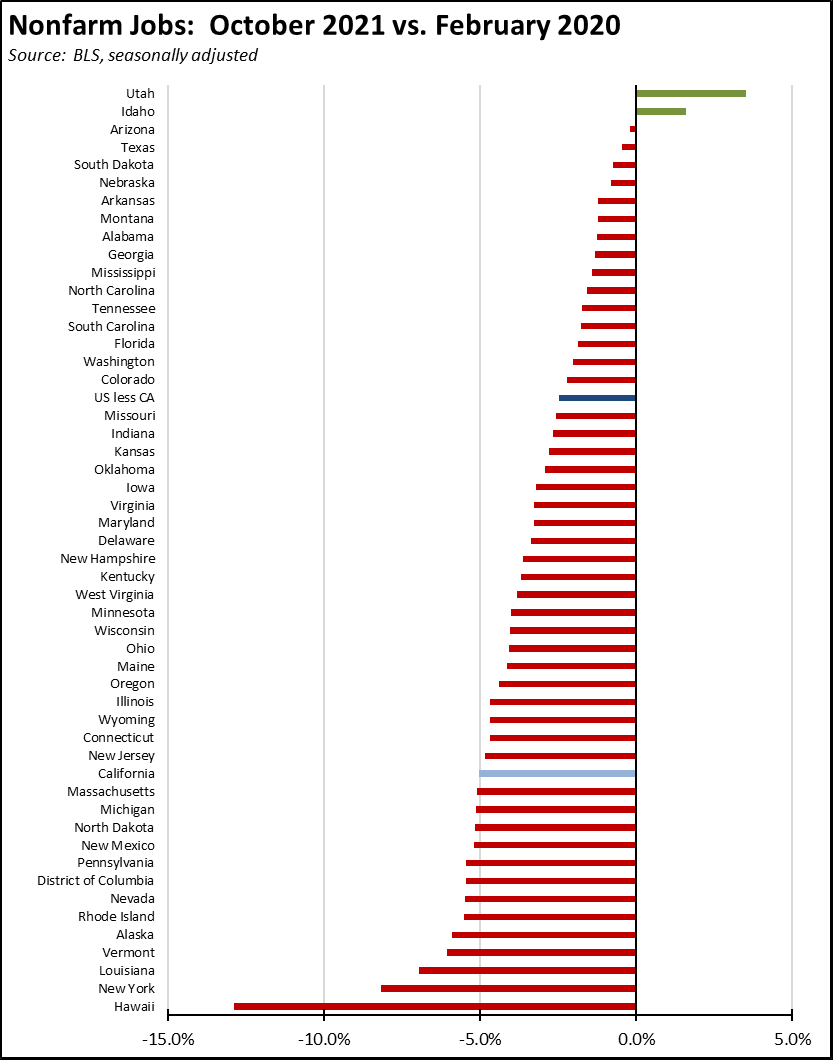
Viewed by state, California rose to 14th lowest in its current recovery level compared to the pre-pandemic job level, while the number of states moving into a growth phase remained at 2.
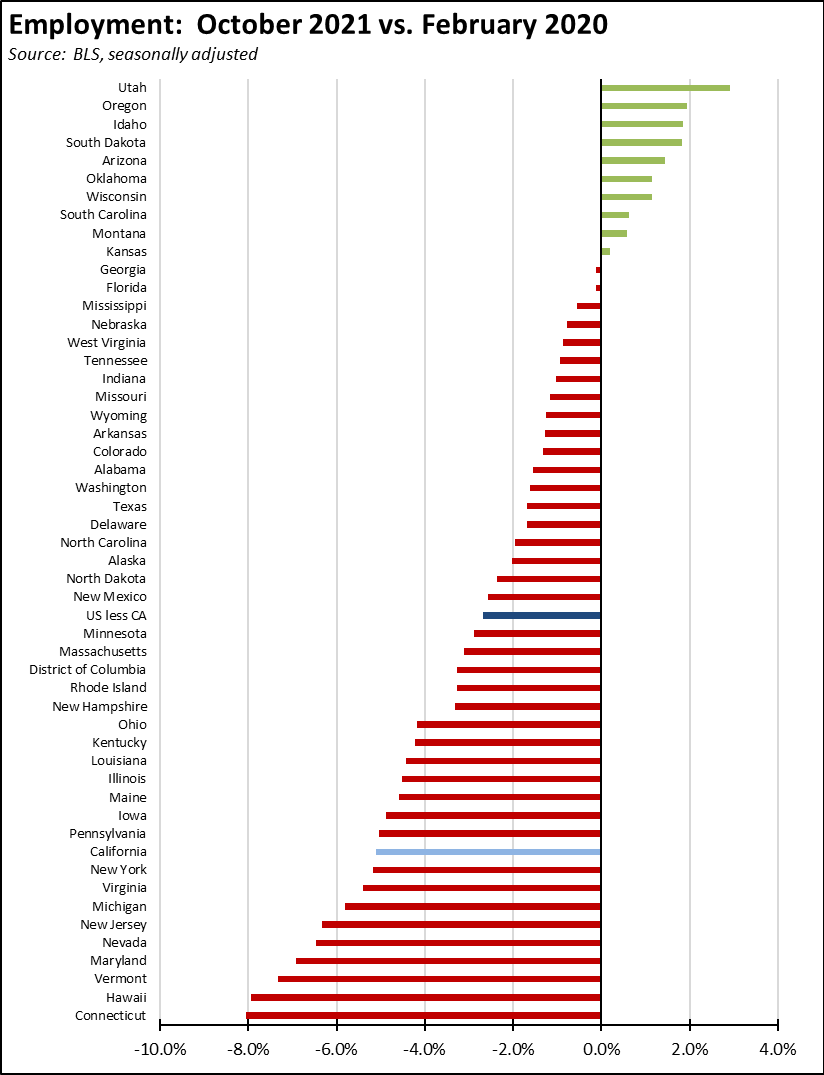
Measured by employment, 10 states have moved to growth while California edged up to the 10th lowest.
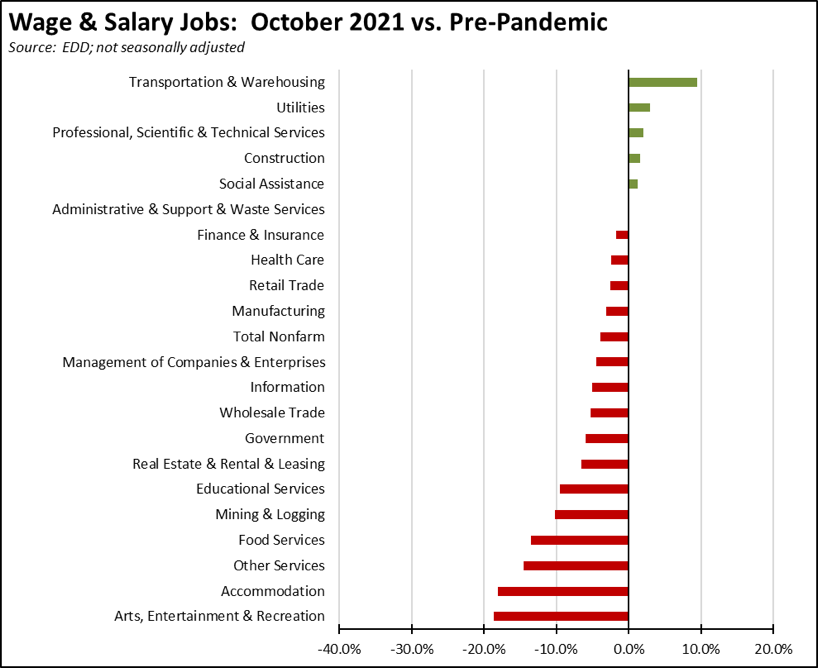
Most sectors of the state’s economy remain in the recovery stage. With the strong October gains in Administrative & Support & Waste Services taking these jobs to just above the pre-pandemic level, the current unadjusted data shows 6 industries have moved to the growth stage. The bulk of the state’s industries still face a prolonged period of regaining lost ground, and some—as reflected the most current Department of Finance projections—are likely to never recover to prior levels as the result of work, sales channel, and technology changes accelerated by the pandemic shutdowns.
But while the change in social benefit payment levels appears to have a positive effect on the job numbers, the current supply disruptions remain a lingering threat over the potential for continued improvements. While the both the federal and state governments recently announced steps to improve the critical flow of goods through the states gateway ports, congestion remains high. The most recent data from the Marine Exchange indicates there are now 95 ships at anchor or loitering off the ports of Los Angeles and Long Breach, compared to 108 ships on October 20 when the state issued its Supply Chain executive order. In addition, the shift to 24-hour operation at the Port of Los Angeles—the centerpiece of the federal actions—is now reported to be encountering significant barriers due to a variety of other factors not addressed in the initial agreement. While overall congestion is likely to recede as the holiday shipping crunch is passed, a number of core issues remain to be addressed by additional actions throughout the supply chain.
CA Unemployment Rate
Rate
California’s reported unemployment rate (seasonally adjusted) in October improved 0.2 point to 7.3%, the best since March 2020 at the beginnings of the pandemic. California, however, remained in a tie with Nevada for the worst unemployment rate among the states. Nebraska topped the states at 1.9%, followed by Utah at 2.2%.
The October numbers show the number of unemployed down by only 41,200. Employment rose 32,700. As a result, the labor force was essentially unchanged with a dip of 8,500, again reflecting continuing labor shortages. The state’s labor force participation rate dipped 0.1 point to 61.1%, while the US rate remained unchanged at 61.6%.
US Unemployment Rate
Rate
The reported national numbers show US unemployment rate (seasonally adjusted) improving 0.2 point to 4.6%, also the best since March 2020 at the beginnings of the pandemic. Employment was up 359,000, while unemployment dropped 255,000. The labor force was up 104,000.
Nonfarm Jobs
Change
Nonfarm wage and salary jobs rose 96,800 (seasonally adjusted) in October, while the gains in September were revised up 7,900 to 9,600 to 55,300.
Nonfarm jobs nationally were up 531,000. However, reflecting the difficulties of relying on seasonally adjusted data during a period when pandemic factors and government policies are more dominant, revisions to prior months’ estimates were the largest on record. In total, nonfarm job numbers for June through September were revised up by 626,000, indicating that jobs recovery was much stronger than previously reported following the early termination of the federal unemployment benefit enhancements by 26 states.
As of the October numbers, California has regained 67% of the nonfarm jobs lost to the state shutdowns. The rest of the states combined regained 83% of the jobs lost in the pandemic period.
California job increases were led by Administrative & Support & Waster Services which had the largest monthly gain on record at 29,800, Accommodation & Food Services (11,600), and Arts, Entertainment & Recreation (9,900). Losses were in 2 industries: Government at -4,000 due to the seasonal adjustment factors and Management of Companies & Enterprises at -200.
Job Openings
the end of September
From the new Bureau of Labor Statistics Job Openings & Labor Turnover Survey (JOLTS) estimates by state, the number of unfilled job openings grew by 32,000 to 1.155 million, the highest of any state.
To put this number in perspective, the 1.155 million unfilled jobs are 30% more than what is needed to close the remaining gap with the pre-pandemic jobs numbers. The jobs are there for the state to fully recover. The workers are not.
Reflecting what some media outlets now term the “great resignation,” the number of workers quitting their jobs also remains elevated, at 443,000. This data point, however, only illustrates one side of the story as hirings also were high at 660,000. Viewed from this standpoint, the higher quit levels instead reflect a challenge to continued job growth within the state, as employers face both a challenge in finding qualified workers and once hired, keeping them. With layoffs and discharges currently running only half as much as in pre-pandemic 2019, the quit level is now a more controlling factor in the extent to which hires now produce a positive jobs change.
Wages
Average Hourly Wage,
Private Workers
For the 12 months ending October, the average hourly wage for private sector workers grew 4.9%. Average weekly hours worked dipped 1.1%, resulting in a combined 3.7% increase in average weekly earnings. As reflected in the national results from the Atlanta Fed Wage Growth Tracker, wage growth in particular has been concentrated among the lowest wage workers, with the lowest quartile experiencing 5.1% growth in October 2021, compared to 3.6% overall and 2.7% for the highest wage quartile.
While California weekly earnings rate is comparable to the 3.8% annual average experienced 2014-2019, workers in the current circumstances are losing ground due to the rising costs of living in the state. In the most recent results, inflation as measured by the California CPI was running at an annual rate of 5.1% as of September. Inflation prospects remain elevated as companies are increasingly forced to raise prices in light of growing costs for labor and supplies, especially within the current market conditions of labor scarcity combined with continued inventory uncertainties stemming from the supply chain disruptions. While wages continue to grow, they are likely to be offset by growing costs especially in high-cost of living California.
Counties with Double-Digit Unemployment
Unemployment
Above 10%
The number of counties with an unemployment rate at 10% or above remained at 1. The unadjusted rates ranged from 3.4% in Marin to 17.7% in Imperial.
On an MSA basis in September, California again contained 11 of the 25 MSAs with the worst unemployment rates in the country, ranging from Modesto MSA at 6.9% (#365 out of 389) to El Centro MSA at 18.1% (worst in the country at #389).
Los Angeles-Long Beach-Anaheim MSA was at 7.4% (tie for #374).
The highest ranked California region was again San Jose-Sunnyvale-Santa Clara MSA at 4.0% (10-way tie for #189), meaning 173 urban areas in the country were performing better than those in California.