The Center for Jobs and the Economy has released our initial analysis of the JanuaryEmployment Report from the California Employment Development Department. For additional information and data about the California economy visit www.centerforjobs.org/ca.
Highlights for policy makers:
- Recovery Progress: CA vs. US
- Recovery Progress: CA Jobs by Wage Level
- California Labor Force
- Recovery Progress: CA Employment vs. Other States
- Nonfarm Jobs
- Recovery Progress: CA Nonfarm Jobs vs. Other States
- JOB OPENINGS
- Unemployment Rates by Region
- Employment Recovery by Region
- Counties with Double-Digit Unemployment
- MSAs with the Worst Unemployment Rates
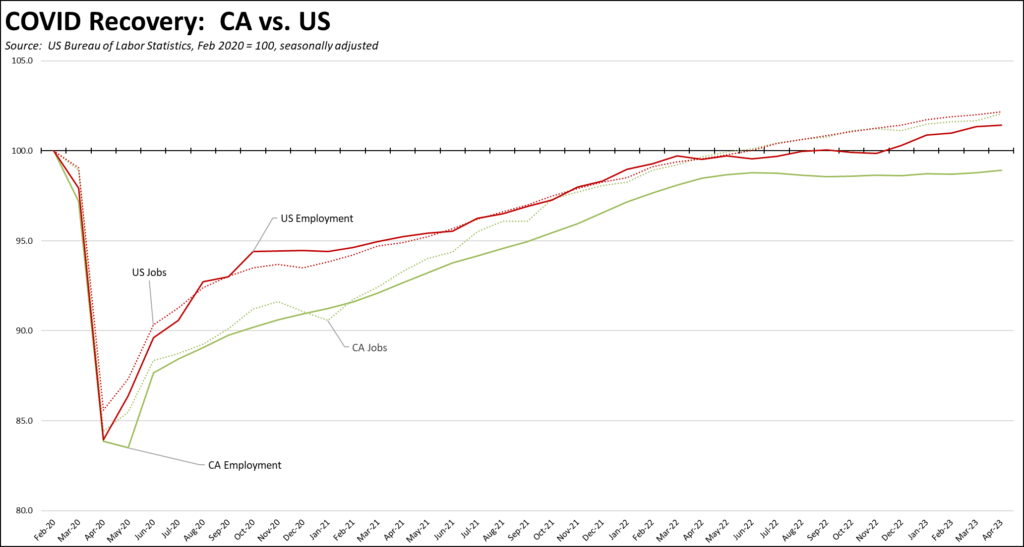
Recovery Progress: CA vs. US
The April data generally showed more positive news than in prior months. Nonfarm jobs (seasonally adjusted) showed a gain of 67,000 in April, with an upward revision to the previous month’s number to 11,900. However, the April results continue the general pattern in the jobs numbers since last July of one month reporting jobs in the 60s followed by two months of sharply lower results. Employment continued the moderate gains seen last month with a gain of 25,200, but the total still remains 203,300 (1.1%) below the pre-pandemic peak in February 2020. Even with the uptick in the last two months, California employment has remained little changed since last June, putting pressure on the state’s ability to expand jobs going forward.
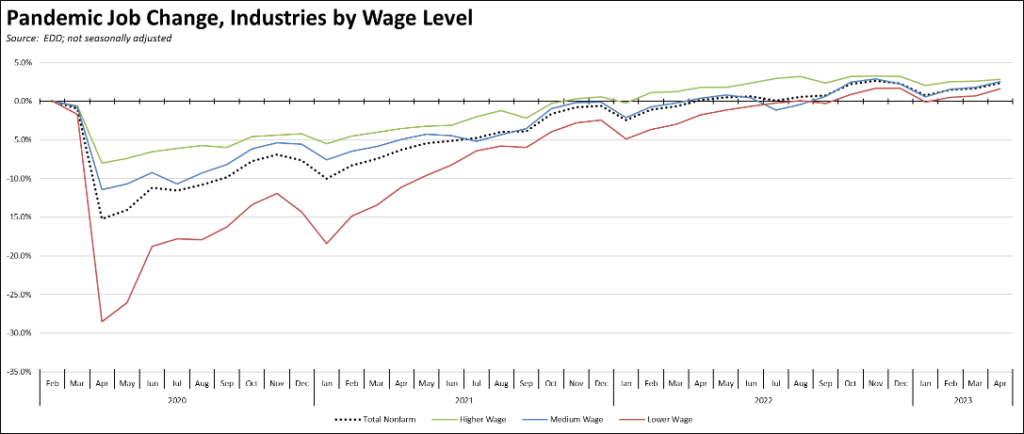
Recovery Progress: CA Jobs by Wage Level
Using the unadjusted series to provide a more detailed look at jobs by industry wage level, recovery across the three wage levels began to converge as gains in the higher wage industries began to level out. Lower wage industries still show the weakest recovery, but showed the strongest gains as seasonal hiring picked up.
California Labor Force
California’s reported unemployment rate (seasonally adjusted) in April rose 0.1 point to 4.5% as the labor force showed minor gains. The US rate improved by 0.1 point to 3.4%.
California had the 3rd highest unemployment rate among the states and DC.
Employment was up 25,300 (seasonally adjusted), the highest monthly gain since last May. The April results finally reversed the dip in total employment since last June. US employment rose by 139,000.
California unemployment rose 7,400, while US unemployment was down by 182,000.
California labor force numbers (seasonally adjusted) saw a positive gain of 32,700, pushing the labor force participation rate up 0.1 point to 62.4%. The US labor force was essentially unchanged with a dip of 43,000, while the participation rate was unchanged at 62.6%.
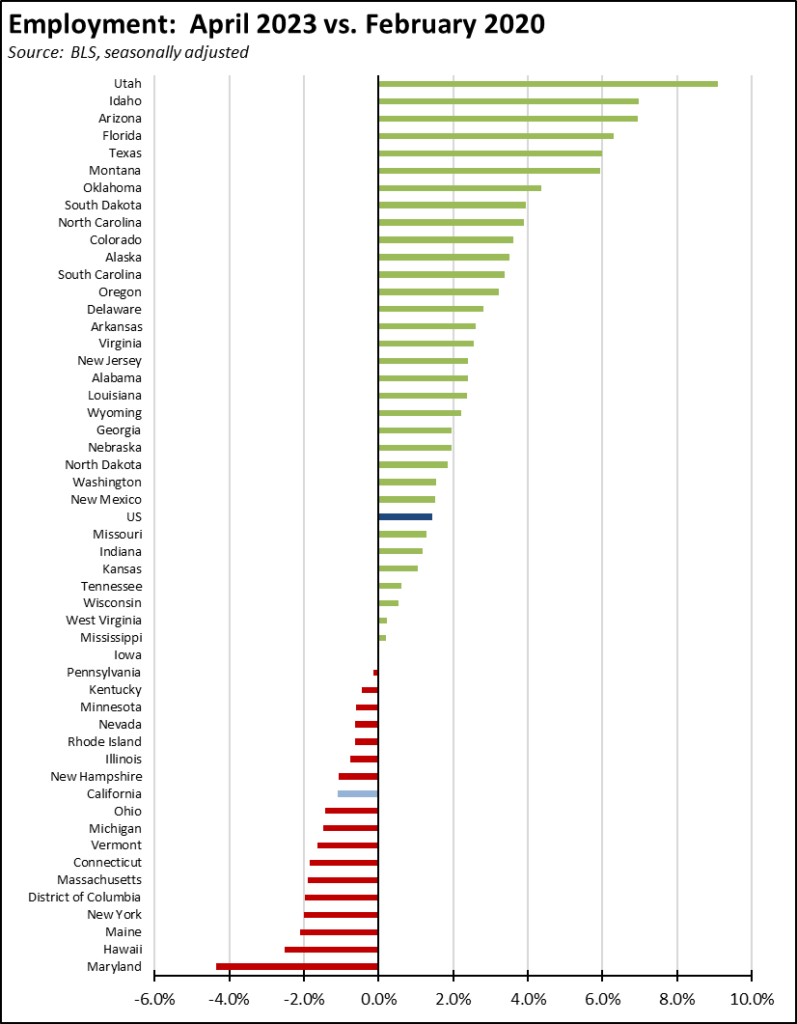
Recovery Progress: CA Employment vs. Other States
Compared to the pre-pandemic peak in February 2020, California’s weak employment recovery again placed it 41st highest among the states and DC.
Nonfarm Jobs
Nonfarm wage and salary jobs were up 67,000 (seasonally adjusted), while the previously reported March gains were revised up by 3,200 to 11,900.
Nonfarm jobs nationally were up 235,000 in April.
The seasonally adjusted numbers for California showed gains in all but 2 industries, with the increases led by Health Care & Social Assistance (18,200), Accommodation & Food Services (7,200), and Arts, Entertainment & Recreation (5,900). Losses were in Wholesale Trade (-900) and Mining & Logging (-100).
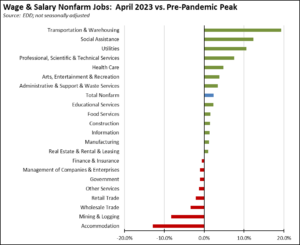
Using the unadjusted numbers to show a more detailed industry breakdown, blue collar, middle-class wage Transportation & Warehousing continues to show the strongest recovery compared to the pre-pandemic peak. This industry is followed by Social Assistance—largely composed of government-funded In-home Supportive Services (IHSS)—and Utilities. Weakest recovery continues to be the blue collar, higher-wage jobs in Mining & Logging targeted by state policy for reductions and in the lower-wage Accommodation jobs that were heavily impacted by the state shutdown policies.
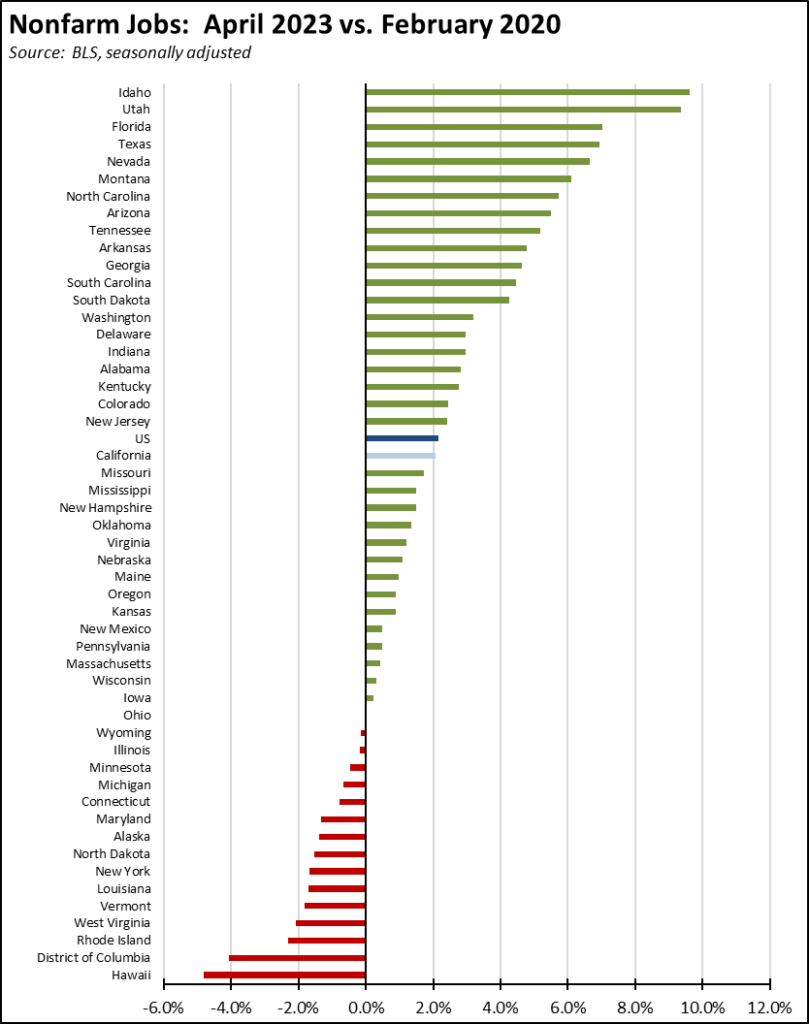
Recovery Progress: CA Nonfarm Jobs vs. Other States
On a comparative basis, California’s 67,000 jobs gain was the highest among the states and DC. Texas was second at 33,300 and Florida third at 21,200. Compared to the pre-pandemic peak in February 2020, California with real job gains of 365,400 again was third, behind Texas (859,800) and Florida (637,100). On a comparative basis, California’s recovery rate again ranked 21st highest among the states. Fifteen states and DC remained below their pre-pandemic peaks.
JOB OPENINGS
California unfilled job openings at the end of March continued dropping to 0.911 million, down 74,000 from February and down 434,000 since the peak last May. While unfilled job openings remain high and represent a potential source of growth for both state incomes and tax revenues, the downward trend since last November largely reflects businesses in the state pulling back on their hiring plans. Nationally, job openings dropped 384,000 in March to 9.59 million.
Unemployment Rates by Region
Unemployment rates (not seasonally adjusted) compared to pre-pandemic February 2020 are shown below.
Figure Source: California Employment Development Department
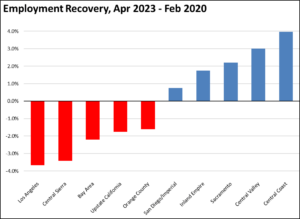
Employment Recovery by Region
Los Angeles Region continues to lag the rest of the state in recovery to the pre-pandemic peak employment levels (not seasonally adjusted).
Counties with Double-Digit Unemployment
The number of counties with an unemployment rate (not seasonally adjusted) at 10% or improved from 5 to 2 as seasonal hiring increased. The unadjusted rates ranged from 2.5% in San Mateo to 14.8% in Colusa.
MSAs with the Worst Unemployment Rates
The number of California MSAs among the 25 regions with the worst unemployment rates in March increased from 11 to 13. Los Angeles-Long Beach-Anaheim MSA dipped to #320 in a tie with 4 other MSAs in other states. San Jose-Sunnyvale-Santa Clara was again the highest ranked California MSA, tied at #174 with 12 other MSAs.