The Center for Jobs and the Economy has released our initial analysis of the August Employment Report from the California Employment Development Department. For additional information and data about the California economy visit www.centerforjobs.org/ca. Data note: the more complete monthly data generally released by BLS in tandem with EDD will not be available until next Tuesday, and will be addressed in our subsequent jobs report.
Highlights for policy makers:
- Recovery Progress: California Numbers Show Substantial Weakening
- California Poverty Rate Once Again Highest Among the States
- California Labor Force
- Nonfarm Jobs by Region
- Counties with Double-Digit Unemployment
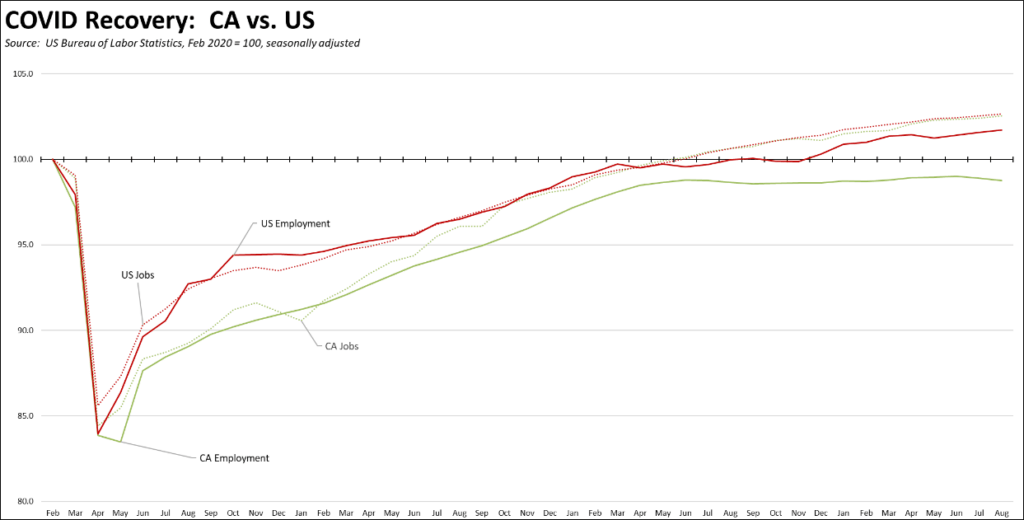
Recovery Progress: California Numbers Show Substantial Weakening
The August numbers show substantial weakening in the state numbers. Nonfarm jobs (seasonally adjusted) were up by 23,100, but July’s respectable gain of 27,900 was slashed to only 8,900 in the monthly revision.
The preliminary benchmark revisions for March 2023 further indicate that the overall 2023 job numbers will likely be lower than previously reported to date. California showed the largest revision among the states, with the adjustment putting total nonfarm jobs 197,800 lower (-1.1%). This outcome indicates average jobs growth from April 2022 to March 2023 would plunge from 29,900 monthly to only 13,400. California’s adjustment also represents about two-thirds of the total preliminary revision (-306,000) to the national numbers. Both Texas (-15,000) and Florida (-9,700) showed much lower change.
The preliminary benchmark revisions are done only for March 2023 from the actual job counts from the Quarterly Census of Employment and Wages. The results will be broadened in the annual revisions to be released in March 2024 for the period 2019 through 2023.
The employment numbers were even more disappointing. Total employment (seasonally adjusted) dropped the second month in a row, down 27,900. The August number essentially reversed the 2023 gains, putting employment just below the June 2022 total.
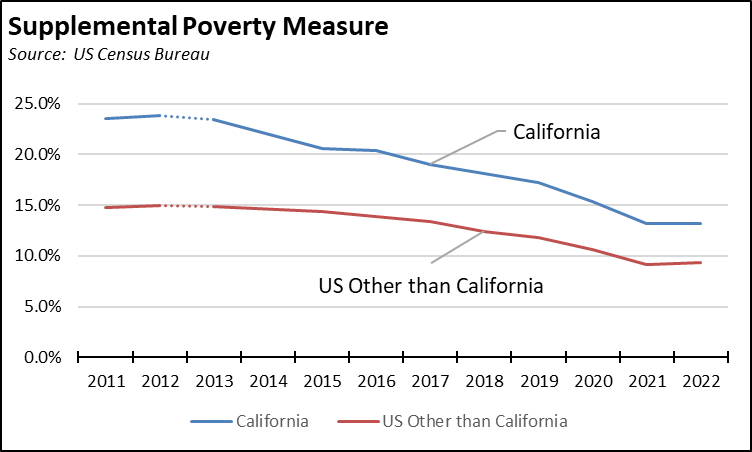
California Poverty Rate Once Again Highest Among the States
In its annual analysis of incomes and poverty, US Census Bureau again reported that California had the highest supplemental poverty rate among the states. California’s poverty rate in 2022 was 13.2%, unchanged from 2021 and the lowest in this series that extends back to 2011. In comparison, the US rate was a quarter lower at 9.8%, and the combined rate for all states (and DC) other than California was 9.3%.
The supplemental poverty measure is an attempt to produce a more comprehensive measure of poverty that takes into account more sources of income and core costs of living. The official poverty measure is based only on money income, and is measured against a theoretical food budget from the early 1960s, adjusted since then by inflation. The supplemental measure begins with money income but then makes adjustments for some federal cash and non-cash benefits, federal income and payroll taxes, work and medical expenses, and more critically adjustments for differences in regional housing costs. This latter component continues to overwhelm the potential benefits from other anti-poverty measures in California.
California Labor Force
California’s reported unemployment rate (seasonally adjusted) in August was unchanged at 4.6%. The US rate rose 0.3 point to 3.8% primarily due to expansion in the labor force.
Employment dropped 27,900 (seasonally adjusted). US employment rose by 222,000.
California unemployment edged up by 9,800, while US unemployment grew by 514,000 as additional workers were drawn back into the labor force.
Nonfarm Jobs by Region
The change in nonfarm jobs (seasonally adjusted) from July and net growth since pre-pandemic February 2020 are shown below. Orange County led in the monthly jobs growth, while Los Angeles Region posted the largest loss. Compared to the pre-pandemic peak, the interior regions continue to show the strongest recovery.
Because the data in the table is seasonally adjusted, the numbers should be considered as the total for the counties in each region rather than the regional number. This job series also is not available for all areas in California.
Counties with Double-Digit Unemployment
The number of counties with an unemployment rate (not seasonally adjusted) at 10% or more dipped to 1. The unadjusted rates ranged from 3.3% in San Mateo to 19.7% in Imperial.