The Center for Jobs and the Economy has released our initial analysis of the August Employment Report from the California Employment Development Department. For additional information and data about the California economy visit www.centerforjobs.org/ca.
Mixed Results in July Data
The August numbers were positive but at relatively modest levels. Although revisions to the July numbers show stronger growth that month, nonfarm wage and salary jobs grew by only 6,800 in August, the 8th highest level among the states. Employment gains were 8,700.
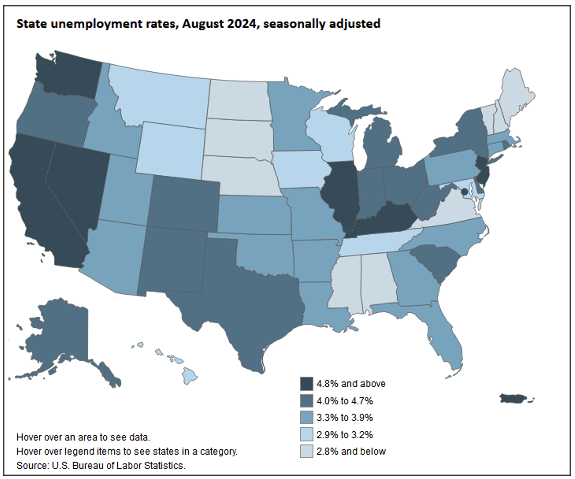
The unemployment rate of 5.3% remained at the 2nd worst among the states, tied with Illinois and just ahead of Nevada. The number of unemployed again was above 1 million for the 8th month in a row, posting the worst levels since the pandemic months in 2021. The 0.1 point rise in the unemployment rate, however, came as the labor force grew by 20,000, with both the rise in the number of employed and unemployed reflecting new entrants.
While the administration has remained focused on arguing that higher wages somehow have not affected jobs in Limited-Service Restaurants, jobs in some of core base industries affecting overall economic performance and budget revenues came in weaker. Using the seasonally adjusted series, Manufacturing was down 4,700 for the month, down 27,900 from August 2023, and overall down 51,500 from the pre-pandemic high. Information as the result of tech industry layoffs and continuing effects from the movie/tv production strike was off 5,100 for the month, 21,200 for the year, and 109,800 from the peak. Financial Activities showed little change (-100) for the month, but a loss of 4,100 for the year, and 38,200 from the peak. Using the unadjusted series, Transportation & Warehousing—a key industry providing middle class wage jobs especially for workers with a high school education or less—fared somewhat better with a gain of 300 for the month and 8,500 for the year, but was down 49,700 from the pre-pandemic high.
California Labor Force
California’s reported unemployment rate (seasonally adjusted) edged up 0.1 point to 5.3%. The US rate dipped 0.1 point to 4.2%.
Among the states, California again had the second highest unemployment rate, tied with Illinois and just behind Nevada.
Employment
Employment rose by 8,700 (seasonally adjusted), with the total employment loss since the previous peak in May 2023 at 79,400.
US employment rose by 168,000.
California unemployment edged up by 11,300, while US unemployment dropped by 48,000. California unemployment has been above 1 million for the past 8 months in a row, the highest levels since the pandemic period in 2021.
Participation Rate
California labor force (seasonally adjusted) rose by 20,000, while the labor force participation rate was up 0.1 point to 62.1%. The US labor force rose 120,000, while the participation rate was unchanged at 62.7%.
Recovery Progress: CA Employment vs. Other States
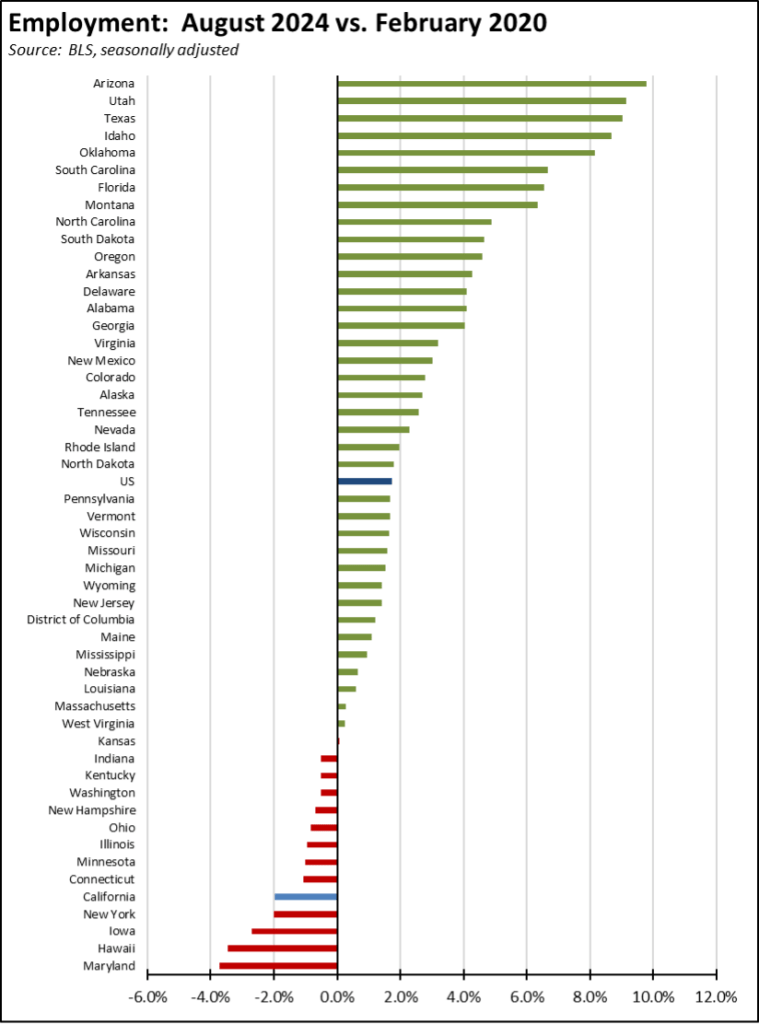
Compared to the pre-pandemic peak in February 2020, California’s relative ranking for employment recovery improved marginally to 5th lowest among the states and DC.
Nonfarm Jobs
Jobs Change
Nonfarm wage and salary jobs rose 6,800 in the preliminary results for August, while the July gains were adjusted up by 8,000 to 29,900.
For the US as a whole, nonfarm jobs rose 142,000 in August.
The seasonally adjusted numbers for California showed gains in 10 industries and losses in 8. Increases were led by population-serving services in Healthcare & Social Assistance (11,500), Accommodation & Food Services (4,600), and Other Services (3,900). Losses in contrast were in the state’s core base industries, led by Private Educational Services (-6,600), Information (-5,100), and Manufacturing (-4,700).
Wages & Hours
Change in Average
Weekly Earnings
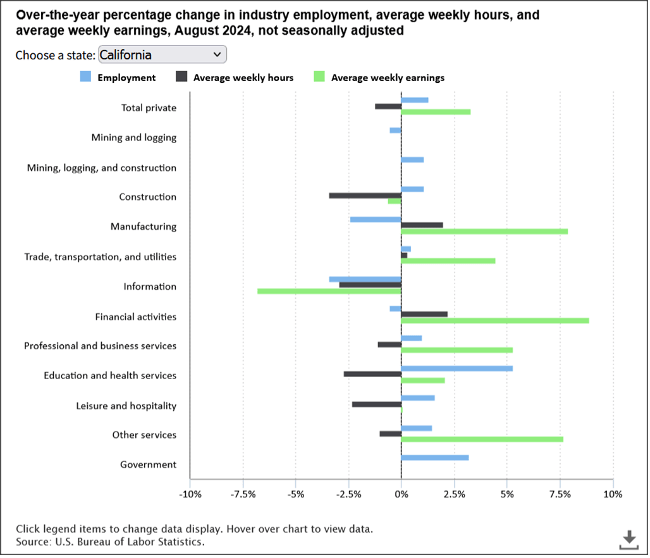
Turning to the seasonally unadjusted series, average weekly earnings rose 3.3% over the year, the 24th highest rate among the states and DC. Earnings growth was dampened slightly by average weekly hours, which dipped 1.2% over the year, the 17th lowest rate among the states.
Looking at industries, highest earnings growth over the year was in Financial Activities, Manufacturing, and Information. Leisure & Hospitality, which contains restaurants, saw weekly earnings growth of only 0.1% as average weekly hours dropped 2.3%.
Interactive Original: https://www.bls.gov/charts/state-employment-and-unemployment/change-in-nonfarm-employment-by-state-map.htm
Recovery Progress: CA Nonfarm Jobs vs. Other States
Interactive Original: https://www.bls.gov/charts/state-employment-and-unemployment/change-in-nonfarm-employment-by-state-map.htm
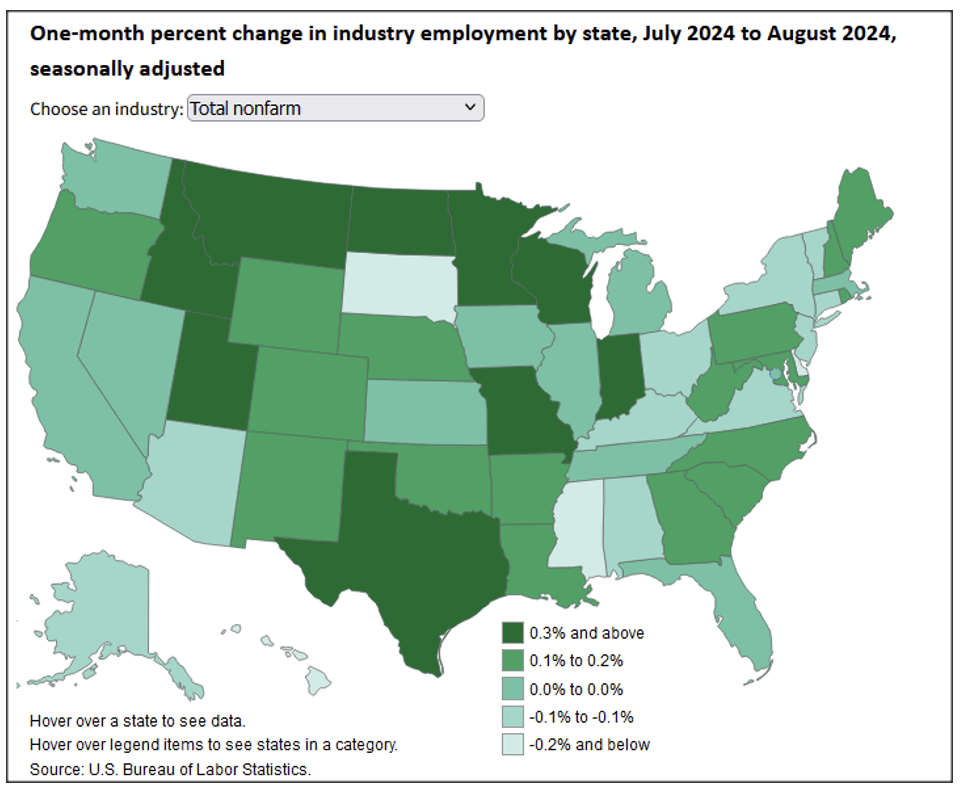
California’s monthly job performance in August was the 8th highest among the states and DC. Jobs growth instead was led by Texas with 78,000, Indiana with 19,800, and Minnesota with 14,400. The Texas number included some bounce-back from Hurricane Beryl.
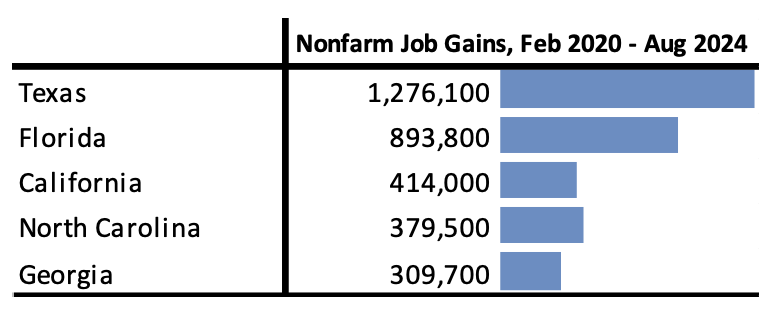
Compared to the pre-pandemic peak, California has now gained a net 414,000 nonfarm jobs, remaining in 3rd place just ahead of much smaller North Carolina. As the result of these shifts, California nonfarm jobs have dropped from 11.6% to 11.4% of the US total, Texas growing from 8.5% to 9.0%, and Florida from 6.0% to 6.3% in just over 4 years.
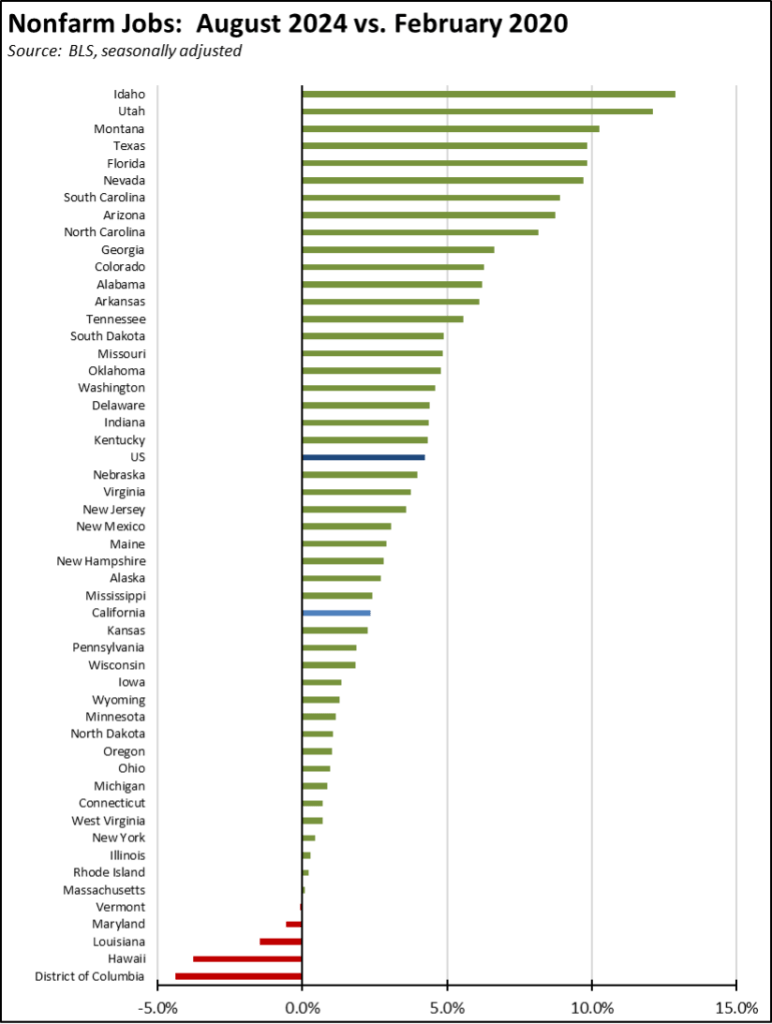
Adjusted for size, the July revisions helped California notch up to 30th highest, still below the US average. Only 4 states and DC remain below their pre-pandemic peaks.
Nonfarm Jobs by Region
By region, job gains were concentrated in Central and Sacramento Valleys, while the budget-critical Bay Area showed a modest gain of 1,100. Los Angeles and Orange County regions were essentially unchanged.
Because the data in the table is seasonally adjusted, the numbers should be considered as the total for the counties in each region rather than the regional number. This job series also is not available for all areas in California.
Unemployment Rates by Region
Looking at employment change over the year, the Bay Area continued to show losses while portions of Southern California and the Central Valley again showed gains.
Unemployment rates (not seasonally adjusted) remain higher in most regions compared to pre-pandemic February 2020 levels.
Counties with Double-Digit Unemployment
Unemployment Above
10%
The number of counties with an unemployment rate (not seasonally adjusted) at 10% or more edged down to 2. The unadjusted rates ranged from 4.0% in San Mateo and Inyo to 20.2% in Imperial.
California MSAs in the 25 Highest Unemployment Rates
Unemployment Rate
The number of California MSAs in the top 25 with the highest unemployment rates nationally remained unchanged at 10 in July.
Unemployment Rate by Legislative District
The estimated unemployment rates are shown below for the highest and lowest districts. The full data and methodology are available on the Center’s website.

