The Center for Jobs and the Economy has released our initial analysis of the January Employment Report from the California Employment Development Department. For additional information and data about the California economy visit www.centerforjobs.org/ca.
2024 Jobs Lowered by 97,000

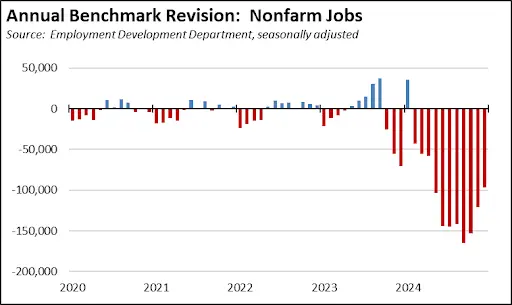
Today’s release incorporates the first stage of the annual data benchmark revisions. The core results for wage and salary jobs:
- Nonfarm jobs (seasonally adjusted) at the end of 2024 were reduced by 97,000.
- Incorporating the 2023 changes, total jobs gains in 2024 were revised from a preliminary gain of 180,500 to 153,700.
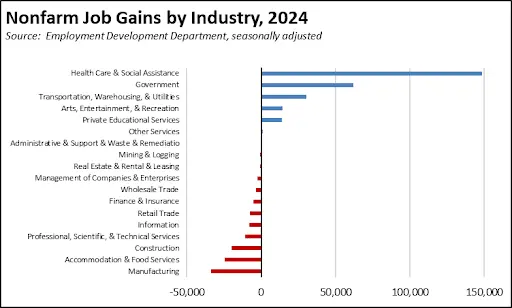
- Jobs growth by industry was dominated by Government and government-supported Healthcare & Social Assistance, which combined grew by 210,600 in 2024. Trade related Transportation, Warehousing & Utilities grew by 30,500, while jobs in all other private industries shrank by a net 87,400. The greatest losses were in Manufacturing. Jobs in the two primary tech-containing industries—Information and Professional, Scientific, & Technical Services—showed losses of 18,600.
- Using the not seasonally adjusted series, Limited Service Restaurants—the industry containing fast food operations affected by the state’s new minimum wage of $20 an hour—fell 23,100 between January 2023 and January 2024, and were at their lowest level since March 2019. In all, jobs in this industry were 48,900 (-6.2%) below their prior peak level.

- Total jobs recovery compared to the pre-pandemic high in February 2020 was revised from a preliminary gain of 452,400 to 368,500.

The labor force numbers, in contrast, saw stronger improvement:
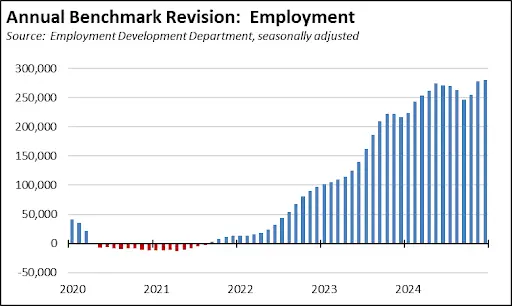
- Total employment (seasonally adjusted) at the end of 2024 was revised up by 279,900.
- Employment change in 2024 was revised from the preliminary loss of 13,700 to a gain of 49,000.
- Total employment recovery compared to the pre-pandemic high in February 2020 rose from a preliminary loss of 394,100 to a loss of 150,000.
- Total unemployment (seasonally adjusted) at the end of 2024 was revised up only slightly by 14,200. Unemployment remained above the 1 million mark in every month in 2024.
- The unemployment rate (seasonally adjusted) at the end of 2024 was unchanged at 5.5%.
The remainder of this report summarizes the results for January, which were released along with the 2024 benchmark revisions.
California Labor Force
Rate
California’s reported unemployment rate (seasonally adjusted) dipped 0.1 point in January to 5.4%. The US rate dipped 0.1 point to 4.0%.
Employment rose 17,600 (seasonally adjusted) in January, while US employment rose by 2,234,000 in the revised numbers.
California unemployment dipped by 6,400, while US unemployment dropped by 37,000. California unemployment has been above 1 million every month since January 2024, the highest levels since the pandemic period in 2021.
Nonfarm Jobs
Change
Nonfarm wage and salary jobs were unchanged in the preliminary numbers for January.
For the US as a whole, nonfarm jobs rose 125,000.
Counties with Double-Digit Unemployment
Unemployment Above
10%
The number of counties with an unemployment rate (not seasonally adjusted) at 10% rose to 5. The unadjusted rates ranged from 3.8% in San Mateo to 17.9% in Imperial.
