The Center for Jobs and the Economy has released our initial analysis of the July Employment Report from the California Employment Development Department. For additional information and data about the California economy visit www.centerforjobs.org/ca.
Highlights for policy makers:
- Recovery Progress: CA vs. US
- Recovery Progress: CA Jobs by Wage Level
- California Labor Force
- Recovery Progress: CA Employment vs. Other States
- Nonfarm Jobs
- Recovery Progress: CA Nonfarm Jobs vs. Other States
- JOB OPENINGS
- Nonfarm Jobs by Region
- Unemployment Rates by Region
- Employment Recovery by Region
- Counties with Double-Digit Unemployment
- MSAs with the Worst Unemployment Rates
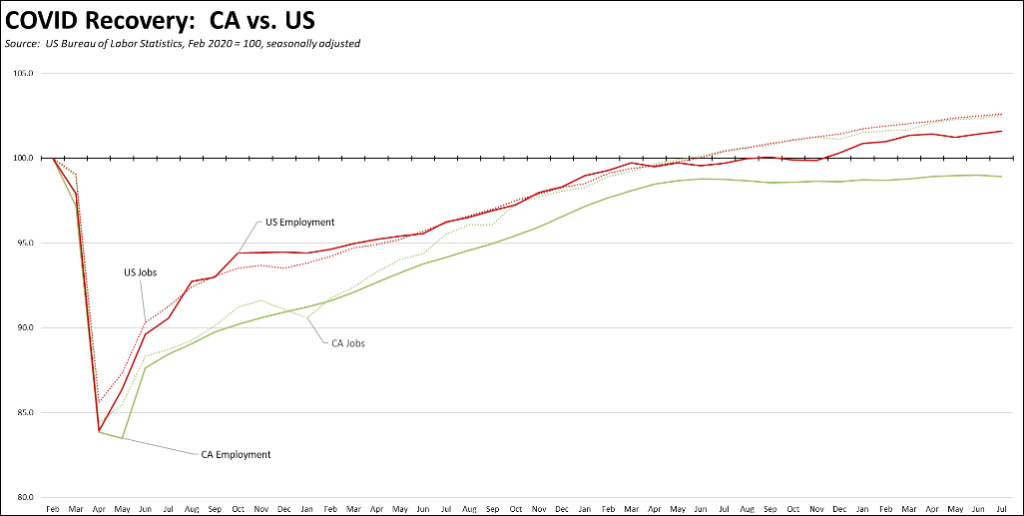
Recovery Progress: CA vs. US
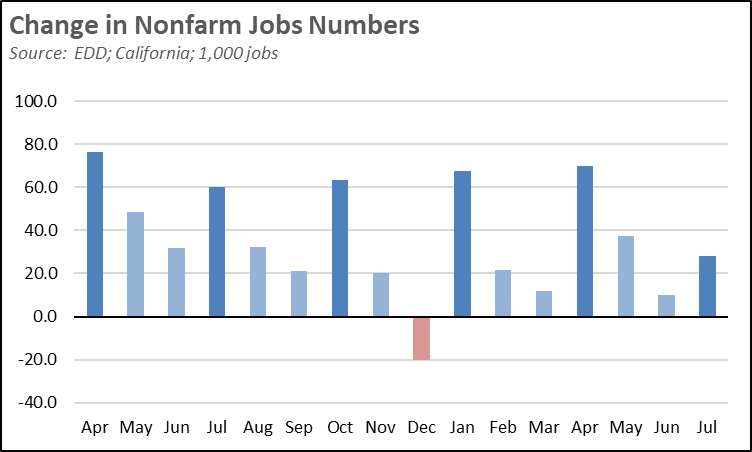
The July data was again mixed but overall indicates a slowing in the state economy. At a gain of 27,900, nonfarm jobs (seasonally adjusted) were 29% below the average in the second quarter. Of more interest, the July numbers broke the previous pattern since April 2022 of the first quarter reporting job gains above 60,000, followed by slower gains in the following two months. Comparing just the first month of each quarter in this period, the July number was 59% lower. Overall, however, California continues to keep pace with the jobs recovery rate nationally.
Employment remains more disappointing. Total labor force showed a reversal of the gains in the prior two months. The total number of workers employed fell 17,000, again keeping total employment essentially unchanged since June 2022. Continued pressure on the employment numbers in part stems from the way in which the state has chosen to administer its unemployment insurance program. While containing 11.6% of total nonfarm jobs in the US, the latest numbers show California with 22.0% of total continuing claims under this program.
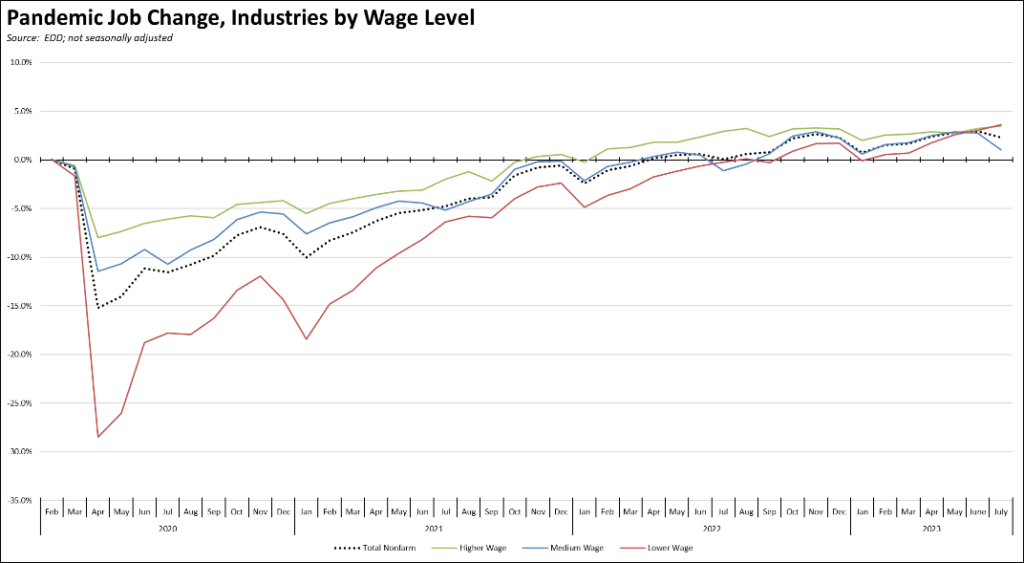
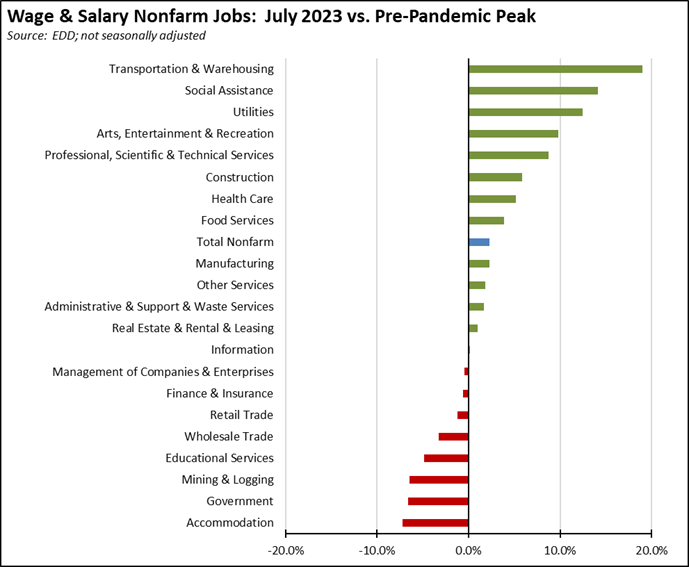
Recovery Progress: CA Jobs by Wage Level
Using the unadjusted series to provide a more detailed look at jobs by industry wage level, the lower and higher wage industries continued to show gains, while those in the middle gave up some ground.
California Labor Force
California’s reported unemployment rate (seasonally adjusted) in July was unchanged at 4.6%.The US rate improved 0.1 point to 3.5%.
California again had the 3rd highest unemployment rate, ahead of Nevada and DC.
Employment dropped 17,000 (seasonally adjusted). US employment rose 268,000.
California unemployment dipped 4,700, while US unemployment was down by 116,000.
California labor force numbers (seasonally adjusted) dropped 21,700, while the labor force participation rate was down 0.1 point to 62.4%. The US labor force was up 152,000, while the participation rate again was unchanged at 62.6%.
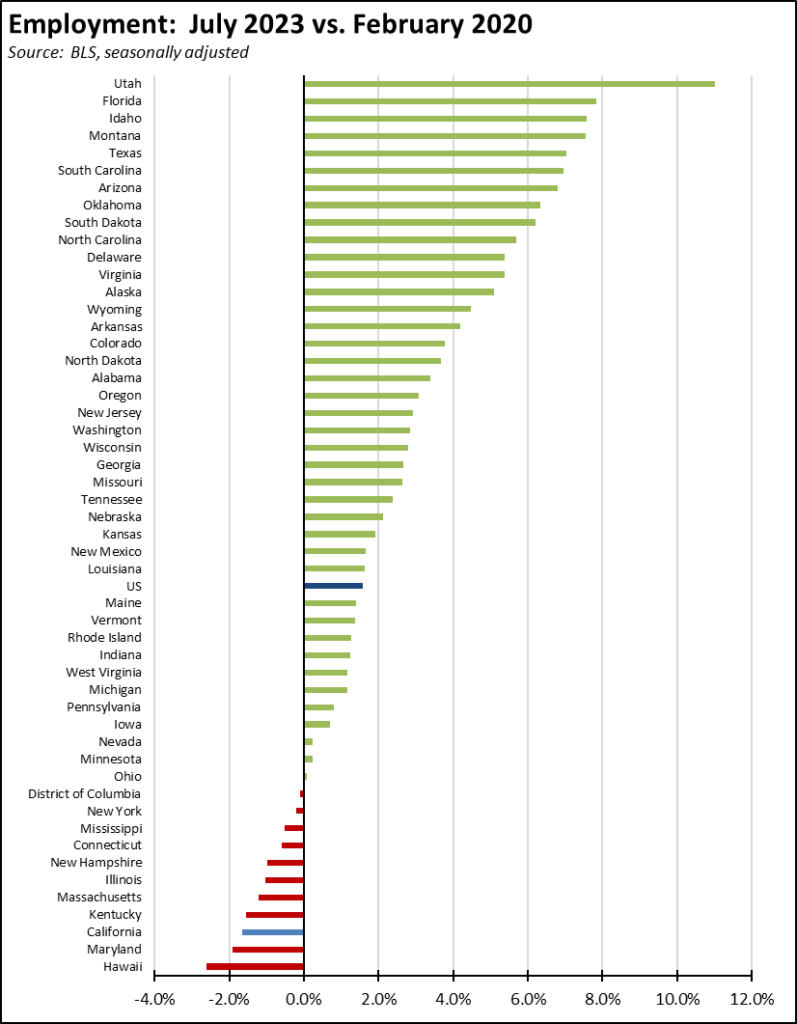
Recovery Progress: CA Employment vs. Other States
Compared to the pre-pandemic peak in February 2020, California’s continued weak employment recovery pushed the state’s ranking down from 42nd highest to 49th among the states and DC. In terms of getting workers back to jobs and earned income, California ranks above only Maryland and Hawaii.
Nonfarm Jobs
Nonfarm wage and salary jobs were up 27,900 (seasonally adjusted), while the previously reported June gains were revised down by 1,700.
Nonfarm jobs nationally were up 187,000 in July.
The seasonally adjusted numbers for California showed gains in 12 industries and losses in 6. Increases were led by Government (15,000), Healthcare & Social Assistance (8,500), and Accommodation & Food Services (5,700). Losses were led by Administrative & Support & Waste Management Services (-12,300), Information (-3,800), and Finance & Insurance (-1,400).
Using the unadjusted numbers to show a more detailed industry breakdown, blue collar, middle-class wage Transportation & Warehousing continues to show the strongest recovery compared to the pre-pandemic peak. As trade has been hampered by the ongoing labor negotiations and as state and local opposition to new warehousing has increased, these gains are quickly being made instead by Social Assistance—largely composed of government-funded and very low wage In-home Supportive Services (IHSS). Weakest recovery continues to be the blue collar, higher-wage jobs in Mining & Logging targeted by state policy for reductions and in the lower-wage Accommodation jobs that were heavily impacted by the state shutdown policies. The Government number reflects the beginning of summer vacation in the schools.
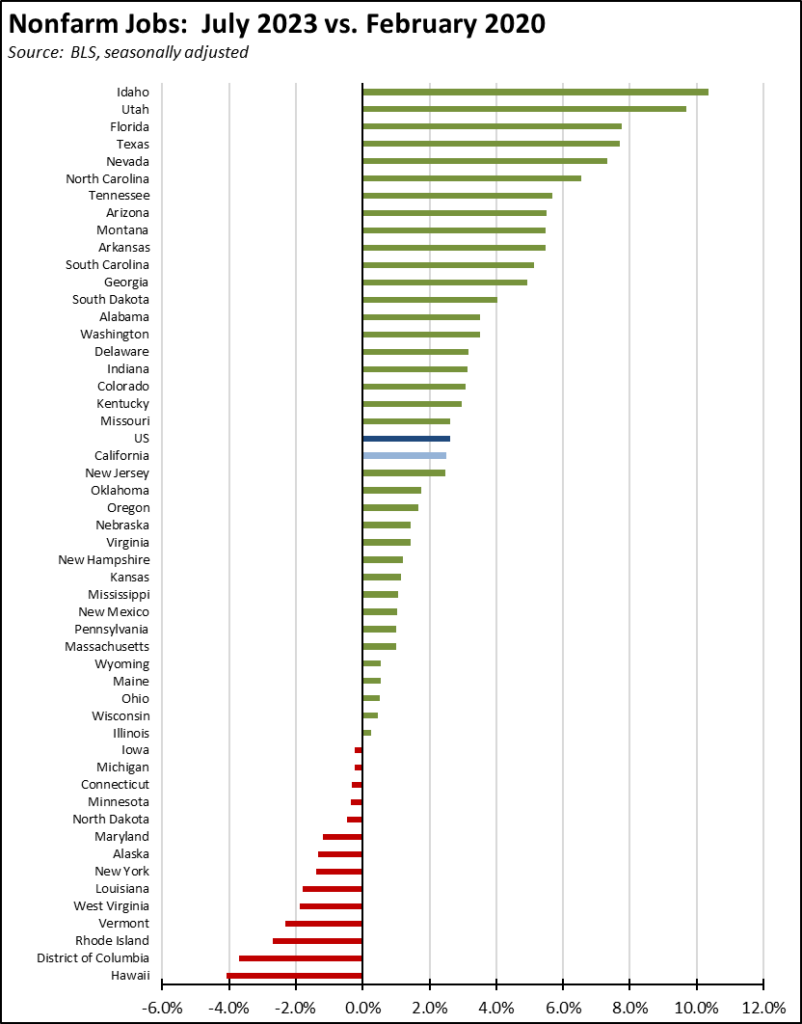
Recovery Progress: CA Nonfarm Jobs vs. Other States
California’s 27,900 jobs gain was 2nd highest compared to the other states and DC. Florida was highest at 44,500, and Texas nearly matched California’s performance at 26,300. Compared to the pre-pandemic peak in February 2020, California with real job gains of 443,500 again was third, behind Texas which was just shy of the million mark at 997,800 and Florida (704,000). On a comparative basis, California’s recovery rate again ranked 21st highest among the states. Thirteen states and DC remained below their pre-pandemic peaks.
JOB OPENINGS
Continued weakness in the labor force numbers saw California unfilled job openings rise by 127,000 at the end of June. Nationally, job openings dipped 34,000 in June to 9.6 million.
The number of quits in California at 327,000 came in at its lowest level since March 2021, likely indicating remaining concerns over a potential downturn. Hires in contrast at 596,000 were at their highest since last January.
Nonfarm Jobs by Region
The change in nonfarm jobs (seasonally adjusted) from June and net growth since pre-pandemic February 2020 are shown below. The interior regions show the largest net job gains since the pre-pandemic peak, while stronger jobs growth in June pushed Los Angeles Region more into positive territory.
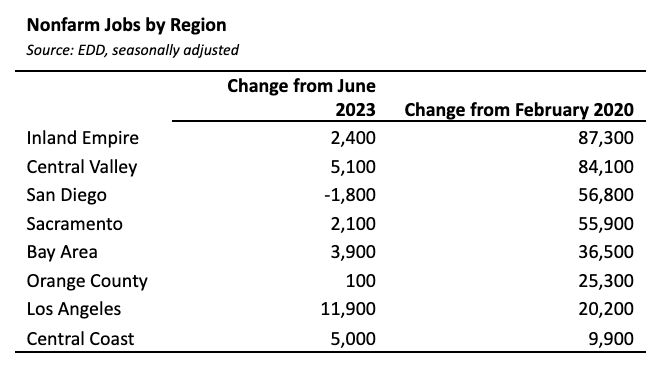
Because the data in the table is seasonally adjusted, the numbers should be considered as the total for the counties in each region rather than the regional number. This job series also is not available for all areas in California.
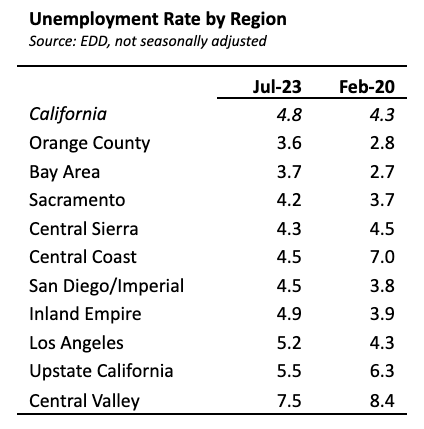
Unemployment Rates by Region
Unemployment rates (not seasonally adjusted) compared to pre-pandemic February 2020 are shown below. Orange County had the lowest rate in July but still has not matched its pre-pandemic performance.
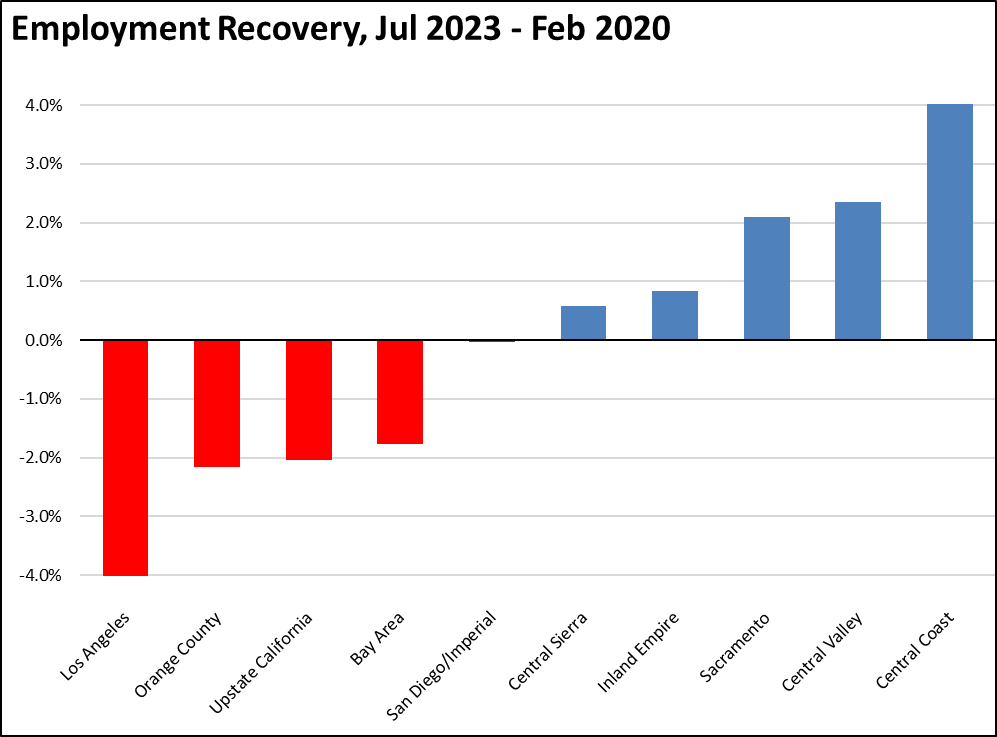
Employment Recovery by Region
Los Angeles Region continues to lag the rest of the state in recovery to the pre-pandemic peak employment levels (not seasonally adjusted).
Counties with Double-Digit Unemployment
The number of counties with an unemployment rate (not seasonally adjusted) at 10% or more dipped to 2. The unadjusted rates ranged from 3.0% in San Mateo to 17.7% in Imperial.
MSAs with the Worst Unemployment Rates
The number of California MSAs among the 25 regions with the worst unemployment rates in June remained at 12, including the worst region of the country in El Centro MSA (Imperial County). Los Angeles-Long Beach-Anaheim MSA was relatively little changed at #345 in a tie with 3 other MSAs. Napa and San Luis Obispo-Paso Robles-Arroyo Grande MSAs were the highest ranked California MSA, tied at #169 with 16 other MSAs.