The Center for Jobs and the Economy has released our initial analysis of the June Employment Report from the California Employment Development Department. For additional information and data about the California economy visit www.centerforjobs.org/ca.
Highlights for policy makers:
- Recovery Progress: CA vs. US
- Recovery Progress: CA Jobs by Wage Level
- California Labor Force
- Recovery Progress: CA Employment vs. Other States
- Nonfarm Jobs
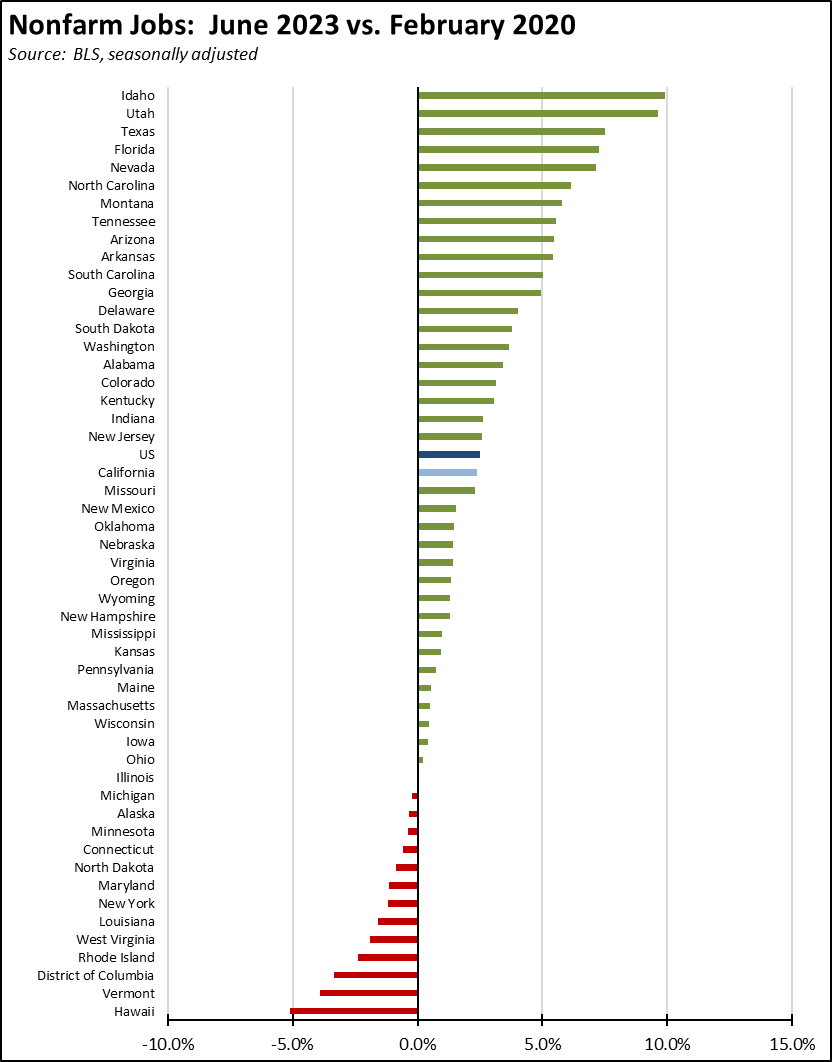
- Recovery Progress: CA Nonfarm Jobs vs. Other States
- JOB OPENINGS
- Nonfarm Jobs by Region
- Unemployment Rates by Region
- Employment Recovery by Region
- Counties with Double-Digit Unemployment
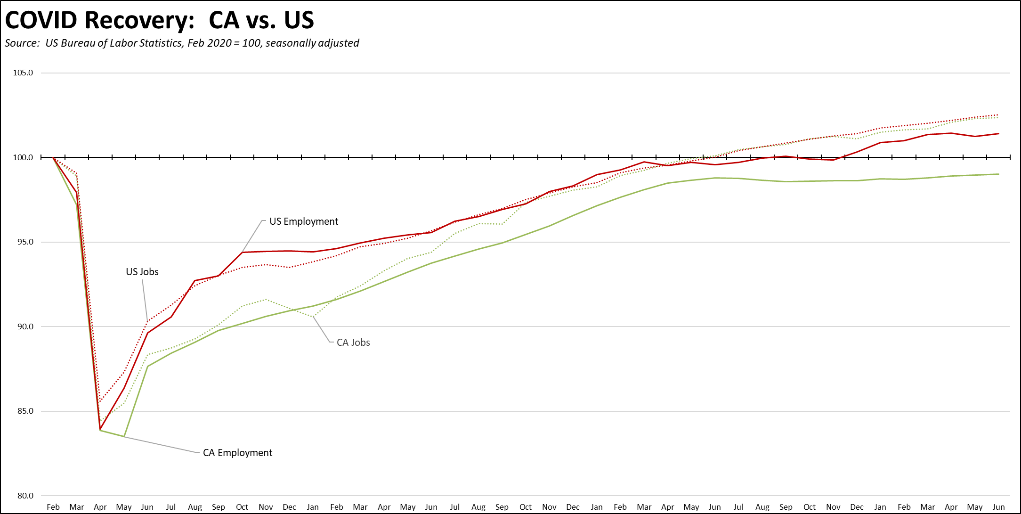
Recovery Progress: CA vs. US
The June data continued the pattern over the prior year of one month reporting job gains in the 60s followed by two months of pronounced slowing. Nonfarm jobs (seasonally adjusted) were up 11,600 in June, while May’s stronger gains were revised down by 9,900. Employment barely registered a gain at only 7,900. Nonfarm jobs continued rising beyond the pre-pandemic high, but employment still has yet to reach this recovery level. Employment was still 185,700 (1.0%) off the pre-pandemic peak in February 2020. Even with the uptick that has now run for 4 months, California employment has remained essentially unchanged since last June, putting pressure on the state’s ability to expand jobs going forward.
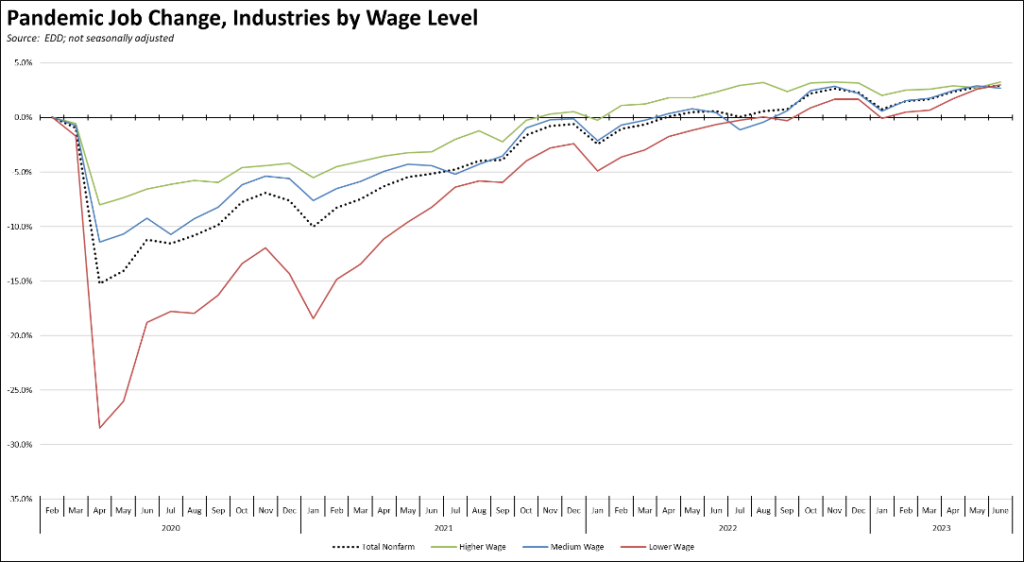
Recovery Progress: CA Jobs by Wage Level
Using the unadjusted series to provide a more detailed look at jobs by industry wage level, recovery across the three wage levels continued to converge around the total jobs growth point.
California Labor Force
California’s reported unemployment rate (seasonally adjusted) in June rose 0.1 point to 4.6% primarily due to an increase in the labor force number. The US rate improved 0.1 point to 3.6%.
California again had the 3rd highest unemployment rate, ahead of Nevada and DC.
Employment was up 7,900 (seasonally adjusted). US employment gained 273,000.
California unemployment rose 5,700, while US unemployment dropped 140,000.
California labor force numbers (seasonally adjusted) saw a positive gain of 13,500, while the labor force participation rate was unchanged at 62.5%. The US labor force was up 133,000, while the participation rate was unchanged at 62.6%.
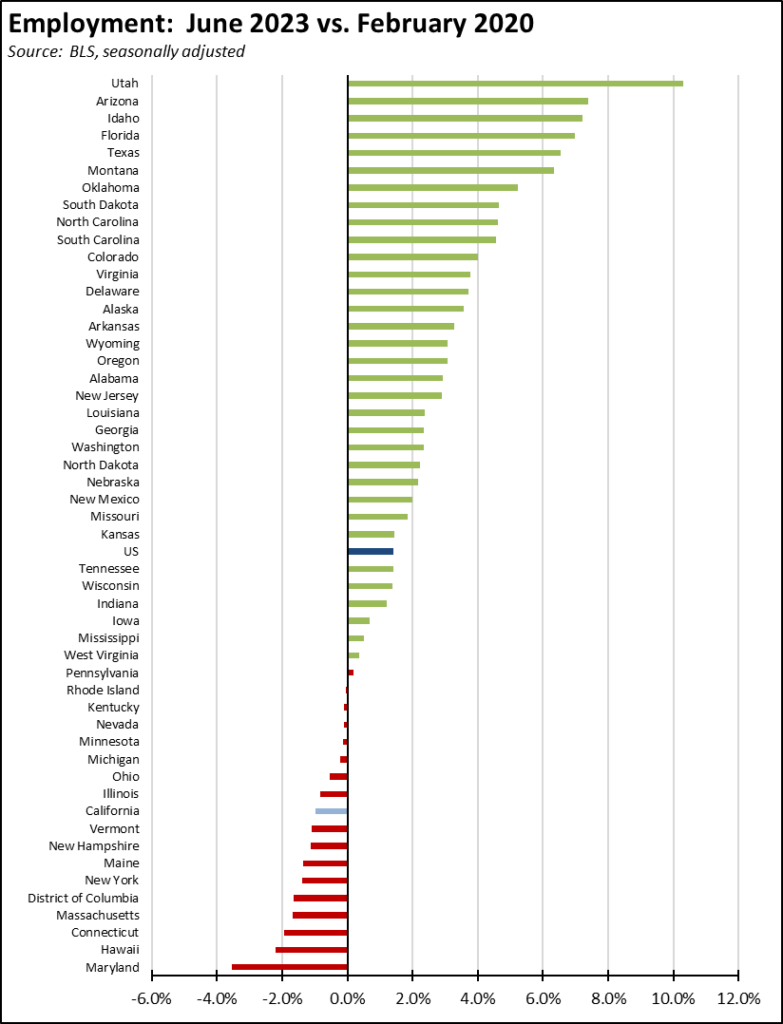
Recovery Progress: CA Employment vs. Other States
Compared to the pre-pandemic peak in February 2020, California’s continued weak employment recovery saw the state’s ranking still at 42nd highest among the states and DC.
Nonfarm Jobs
Nonfarm wage and salary jobs were up 11,600 (seasonally adjusted), while the previously reported April gains were revised down by 9,900 to 38,200.
Nonfarm jobs nationally were up 209,000 in June.
The seasonally adjusted numbers for California showed gains in 9 industries and losses in 8. Increases were led by Construction (6,000), Professional, Scientific & Technical Services (4,900), and Private Educational Services (4,200). Losses were led by Transportation, Warehousing & Utilities (-4,500), Administrative & Support & Waste Management Services (-4,400), and Retail Trade (-1,700).
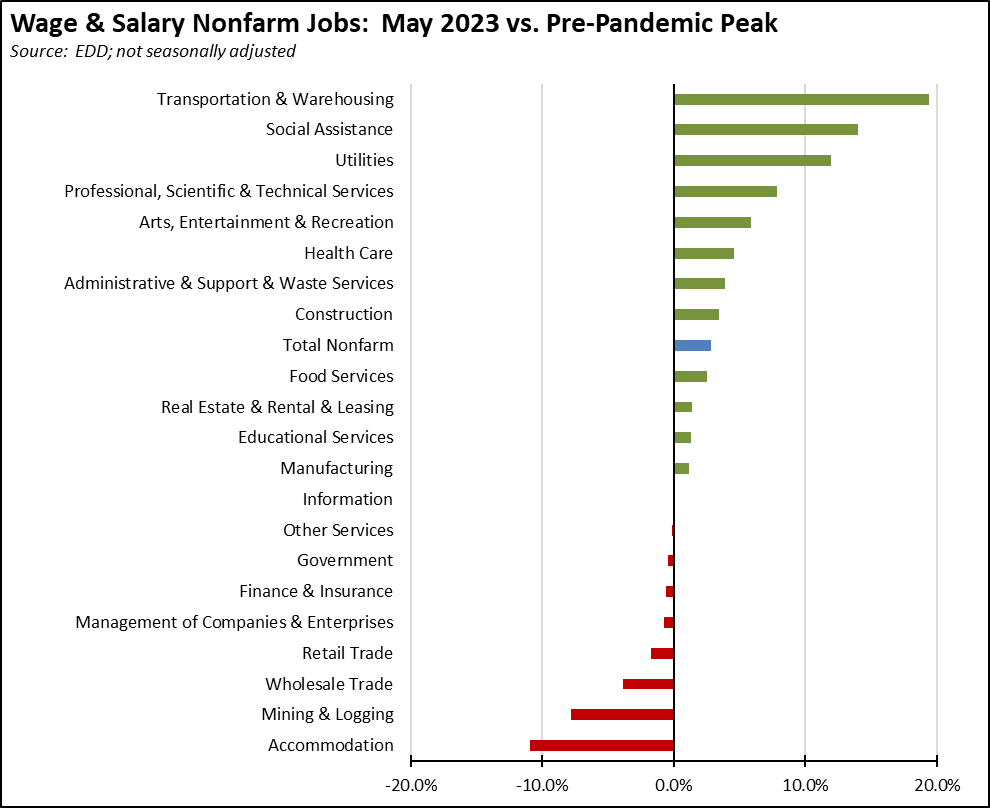
Using the unadjusted numbers to show a more detailed industry breakdown, blue collar, middle-class wage Transportation & Warehousing continues to show the strongest recovery compared to the pre-pandemic peak. As trade has been hampered by the ongoing labor negotiations and as state and local opposition to new warehousing has increased, these gains are quickly being made instead by Social Assistance—largely composed of government-funded and very low wage In-home Supportive Services (IHSS). Weakest recovery continues to be the blue collar, higher-wage jobs in Mining & Logging targeted by state policy for reductions and in the lower-wage Accommodation jobs that were heavily impacted by the state shutdown policies.
Recovery Progress: CA Nonfarm Jobs vs. Other States
California’s 11,600 jobs gain was 4th highest compared to the other states and DC. Texas was highest at 31,100, followed by New York at 28,100 and Washington at 11,900. Compared to the pre-pandemic peak in February 2020, California with real job gains of 417,300 again was third, behind Texas (973,300) and Florida (658,700). On a comparative basis, California’s recovery rate again ranked 21st highest among the states. Thirteen states and DC remained below their pre-pandemic peaks.
JOB OPENINGS
California unfilled job openings at the end of April reversed their decline, rising by 112,000. The total, however, was down 25.3% from the peak reached last May. Nationally, job openings rose 384,000 in April to 10.1 million.
Nonfarm Jobs by Region
The change in nonfarm jobs (seasonally adjusted) from May and net growth since pre-pandemic February 2020 are shown below. The interior regions show the largest net job gains since the pre-pandemic peak, while the Bay Area continues to grow and Los Angeles Region is just above that recovery level. Even with ongoing concerns over the Tech Industry, the Bay Area led jobs growing In June.
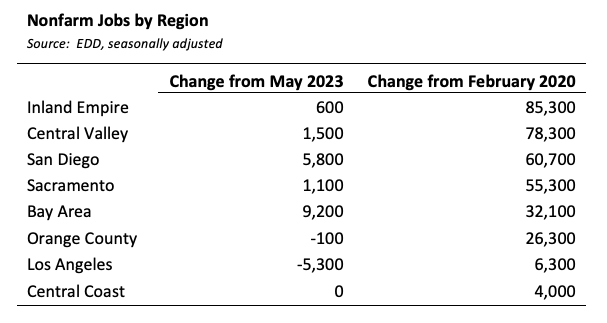
Because the data in the table is seasonally adjusted, the numbers should be considered as the total for the counties in each region rather than the regional number. This job series also is not available for all areas in California.
Unemployment Rates by Region
Unemployment rates (not seasonally adjusted) compared to pre-pandemic February 2020 are shown below.
| Unemployment Rate by Region | ||
|
Source: EDD, not seasonally adjusted |
||
| Jun-23 | Feb-20 | |
| California | 4.9 | 4.3 |
| Bay Area | 3.7 | 2.7 |
| Orange County | 3.7 | 2.8 |
| Sacramento | 4.4 | 3.7 |
| Central Sierra | 4.4 | 4.5 |
| San Diego/Imperial | 4.5 | 3.8 |
| Central Coast | 5.0 | 7.0 |
| Inland Empire | 5.0 | 3.9 |
| Los Angeles | 5.1 | 4.3 |
| Upstate California | 5.7 | 6.3 |
| Central Valley | 7.9 | 8.4 |
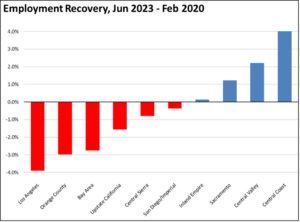
Employment Recovery by Region
Los Angeles Region continues to lag the rest of the state in recovery to the pre-pandemic peak employment levels (not seasonally adjusted), but labor shortfalls extended into additional regions in June.
Counties with Double-Digit Unemployment
The number of counties with an unemployment rate (not seasonally adjusted) at 10% or more remained at 3. The unadjusted rates ranged from 3.1% in San Mateo to 16.9% in Imperial.
|
MSA |
May Unemp. Rate |
Rank (out of 389) |
| El Centro MSA | 16.0% | 389 |
| Visalia-Porterville MSA | 10.0% | 387 |
| Merced MSA | 9.3% | 386 |
| Bakersfield MSA | 8.6% | 385 |
| Hanford-Corcoran MSA | 8.0% | 384 |
| Fresno MSA | 7.5% | 383 |
| Madera MSA | 7.3% | 382 |
| Yuba City MSA | 7.2% | 381 |
| Modesto MSA | 6.4% | 380 |
| Salinas MSA | 6.3% | 378 |
| Stockton-Lodi MSA | 5.9% | 374 |
| Santa Cruz-Watsonville MSA | 5.7% | 372 |