The Center for Jobs and the Economy has released our initial analysis of the March Employment Report from the California Employment Development Department. For additional information and data about the California economy visit www.centerforjobs.org/ca.
Highlights for policy makers:
- March Data Shows Mixed Results
- California Labor Force
- Recovery Progress: CA Employment vs. Other States
- Nonfarm Jobs
- Recovery Progress: CA Nonfarm Jobs vs. Other States
- Nonfarm Jobs by Region
- Unemployment Rates by Region
- Counties with Double-Digit Unemployment
- Unemployment Rate by Legislative District
March Data Shows Mixed Results
The March data returned to reporting mixed results for the state’s economy. Nonfarm jobs rose 28,000 in the preliminary results for March, while the loss in February was revised 3,300 lower to 6,600. The preliminary average monthly gain for the first quarter of 2024 was 15,800, down sharply from the previous quarter’s average of 38,800 but better than the 5,200 average loss in the first quarter of 2023.
The labor force numbers continued to weaken, but at less significant numbers. Employment reported yet another loss, the 9th in the last 10 months. Employment dipped 8,400 for the month and a total of 128,600 in the current 10-month downward trend. Unemployment also has grown in every month except one since September 2022, for a total increase in this period of 309,500 or 42.8% higher than the recent low in August 2022. The unemployment rate remained at 5.3%, the highest among the states and DC and the highest in California since December 2021.
California Labor Force
California again had the highest unemployment rate among the states and DC.
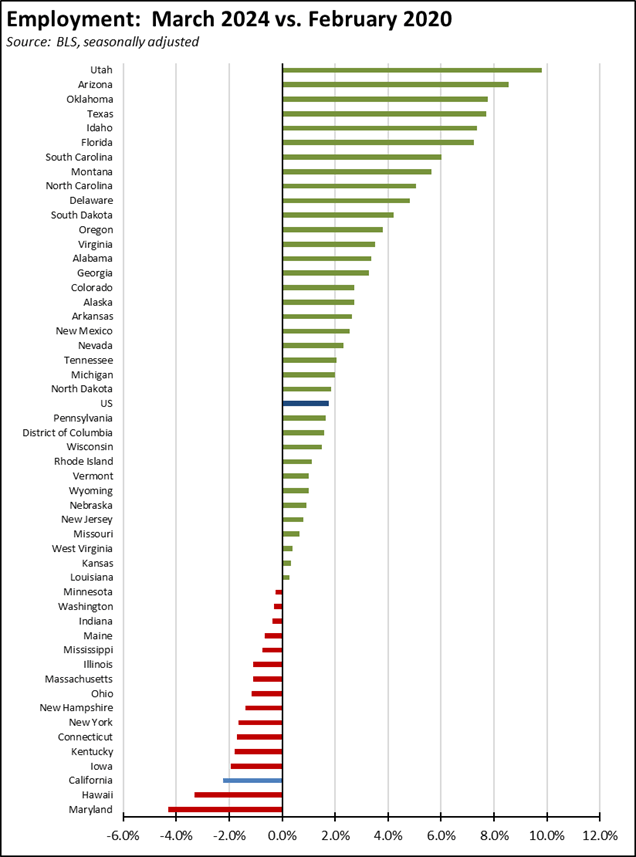
Recovery Progress: CA Employment vs. Other States
Compared to the pre-pandemic peak in February 2020, California’s sustained weak employment recovery remained at the 3rd lowest among the states and DC.
Nonfarm Jobs
Nonfarm wage and salary jobs rose 28,000 in the preliminary results for March, while the loss in February was revised 3,300 lower to 6,600.
For the US as a whole, nonfarm jobs rose 303,000 in March.
The seasonally adjusted numbers for California showed gains in 10 industries and losses in 8. Increases were led by Healthcare & Social Assistance (11,200), Government (6,400), and Administrative & Support & Waste Services (5,300). Losses were led by Manufacturing (-5,300), Wholesale Trade (-2,000), and Accommodation & Food Services (-1,800).
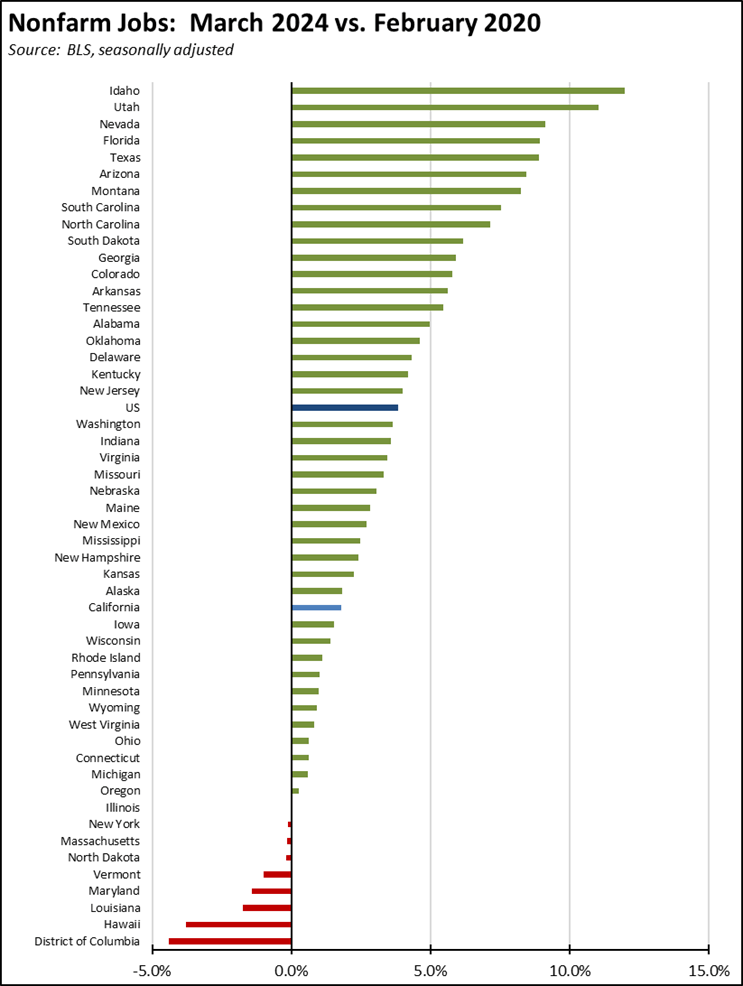
Recovery Progress: CA Nonfarm Jobs vs. Other States
California’s monthly job performance in March was the highest among the states and DC. New York was 2nd highest with a gain of 23,900, followed by Texas with 19,100.
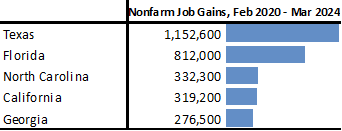
Compared to the pre-pandemic peak, California has now gained a new 319,200 nonfarm jobs, still in 4th place among the states and DC.
Adjusted for size, California dropped to 31st highest, below the US average.
Nonfarm Jobs by Region
Both the budget critical Bay Area and Los Angeles Region posted nonfarm job gains (seasonally adjusted) over the month. Los Angeles, Bay Area, and Central Coast regions, however, remained below their pre-pandemic peaks, with the other regions of the state showing post-recovery gains.
Because the data in the table is seasonally adjusted, the numbers should be considered as the total for the counties in each region rather than the regional number. This job series also is not available for all areas in California.
Unemployment Rates by Region
Looking at employment, no region in the state has yet to pass the pre-pandemic peak. Los Angeles and Bay Area remain the furthest behind.
Unemployment rates (not seasonally adjusted) compared to pre-pandemic February 2020 are shown below.
Counties with Double-Digit Unemployment
The number of counties with an unemployment rate (not seasonally adjusted) at 10% or more dipped to 8. The unadjusted rates ranged from 3.5% in San Mateo to 19.2% in Colusa.
Unemployment Rate by Legislative District
The estimated unemployment rates are shown below for the highest and lowest districts. The full data and methodology are available on the Center’s website.