The Center for Jobs and the Economy has released our initial analysis of the November Employment Report from the California Employment Development Department. For additional information and data about the California economy visit www.centerforjobs.org/ca.
Highlights for policy makers:
- November Data Again Posts Mixed Results
- Recovery Progress: CA Jobs by Wage Level
- California Labor Force
- Recovery Progress: CA Employment vs. Other States
- Nonfarm Jobs
- Recovery Progress: CA Nonfarm Jobs vs. Other States
- Nonfarm Jobs by Region
- Unemployment Rates by Region
- Employment Recovery by Region
- Counties with Double-Digit Unemployment
- MSAs with the Worst Unemployment Rates
November Data Again Posts Mixed Results
Nonfarm jobs showed a gain in November, although coming in at a more restrained 9,300 and the October gains revised down by 5,700 to a still respectable 34,500. Information gained as Motion Picture related jobs returned to pre-strike levels. Tech jobs also reported some gains, counterbalancing the continuing series of layoff announcements coming from this industry. While both showed growth in the unadjusted data, Transportation, Warehousing & Utilities reported only a modest increase in the adjusted series reflecting the general slowdown in trade activity compared to previous years’ seasonal bumps, and Retail Trade posted a loss in the adjusted data that reflects the substantial shift to online sales. Job gains, however, were dominated by the lower wage end, in particular continued expansion of government-paid very low wage jobs in Individual & Family Services.
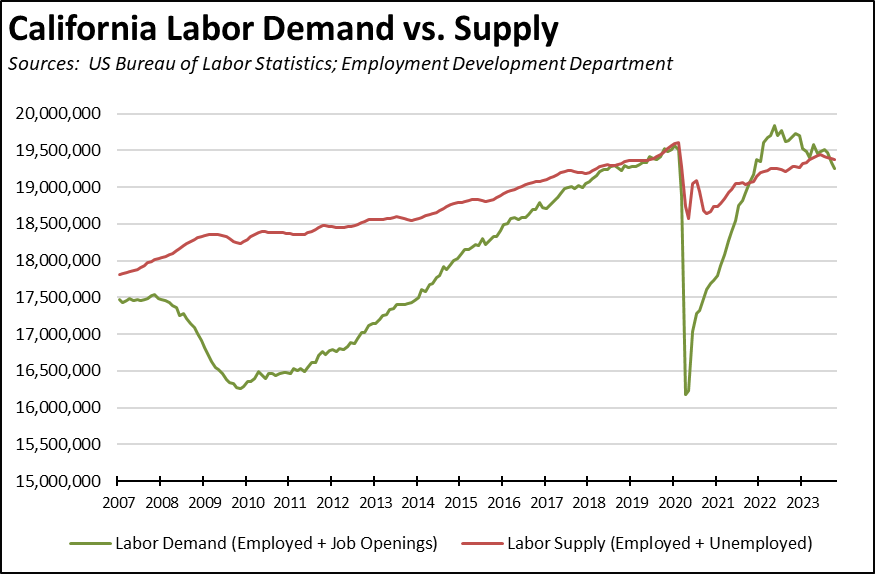
Employment—the number of people working—dropped again for the 5th month in a row, showing a loss of 35,400 for the month and a total drop of 147,700 for the five-month period. Combined with a growing number of unemployed, weakness in the labor force has now essentially eliminated the previous labor shortage conditions that had throttled down the state’s job expansion potential. Labor supply (number of employed and unemployed) has now fallen below labor demand (employed plus job openings), reversing the conditions previously favorable to stronger wage growth to a situation where increasing unemployment becomes more likely.
Recovery Progress: CA Jobs by Wage Level
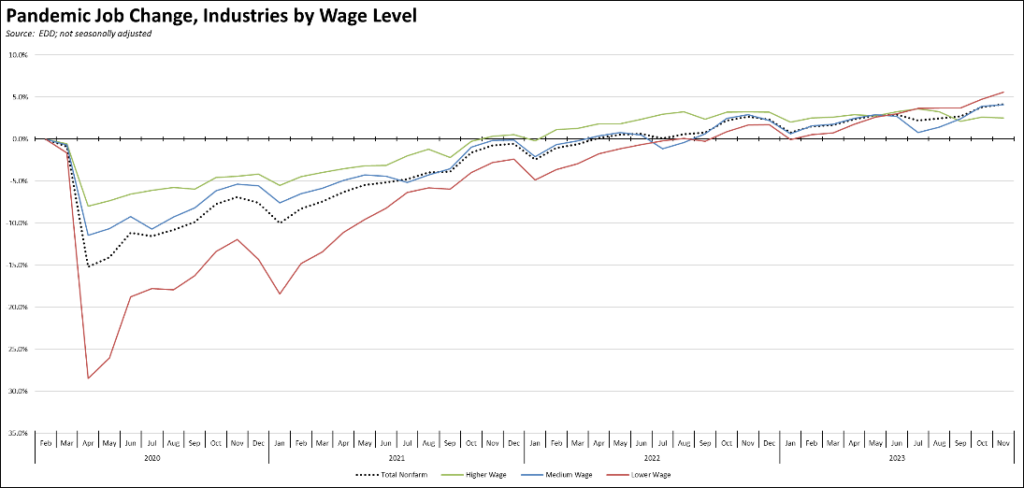
Using the unadjusted series to provide a more detailed look at jobs by industry wage level compared to the pre-pandemic peak, the lower wage industries continue to lead while the higher wage industries have lagged since September. The medium-wage industries remain close to the overall nonfarm jobs trend.
California Labor Force
California’s reported unemployment rate (seasonally adjusted) in November was up 0.1 point to 4.9% as employment continued to lose ground and the number of unemployed also grew. The US rate improved by 0.2 point to 3.7% as both the employment and unemployed numbers reported much stronger positive results.
California again had the 3rd highest unemployment rate, ahead of only Nevada and DC.
Employment dropped 34,400 (seasonally adjusted), accelerating the total drop in employment over the past 5 months to 147,700.
US employment gained 747,000.
California unemployment rose 22,300, while US unemployment dropped 215,000. For the past 12 months, unemployment is up 156,100 in California, while rising only 291,000 in the nation as a whole.
California labor force (seasonally adjusted) was down 13,100, while the labor force participation rate dipped 0.1 point to 62.2%. The US labor force rose 532,000, while the participation rate notched up 0.1 point to 62.8%.
Recovery Progress: CA Employment vs. Other States
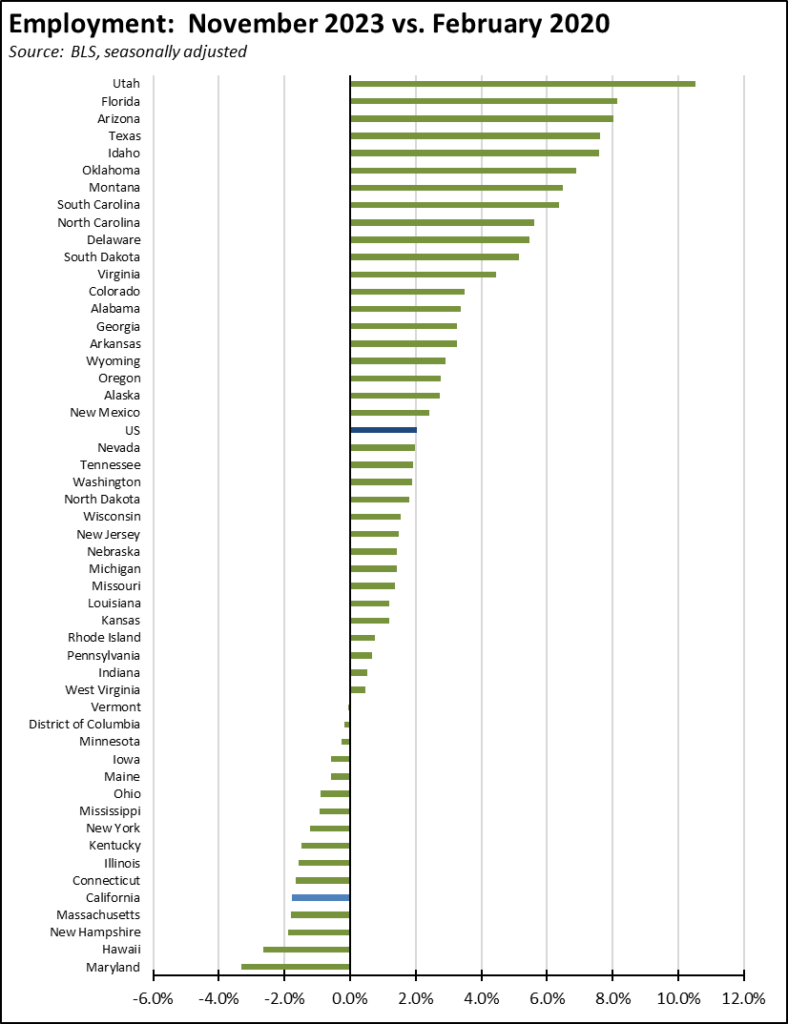
Compared to the pre-pandemic peak in February 2020, California’s sustained weak employment recovery pushed its ranking down to 5th worst among the states and DC.
Nonfarm Jobs
Nonfarm wage and salary jobs were up 9,300 (seasonally adjusted), while the previously reported October gains were revised down to 34,500.
For the US, nonfarm jobs were up 235,000 in November.
The seasonally adjusted numbers for California showed gains in 10 industries, losses in 7, and no change in Management of Companies & Enterprises. Increases were led by Healthcare & Social Assistance (8,300), Accommodation & Food Services (4,700), and Other Services (4,700). Losses were led by Administrative & Support & Waste Management & Remediation Services (-9,500), Finance & Insurance (-3,600), and Retail Trade (-3,600).
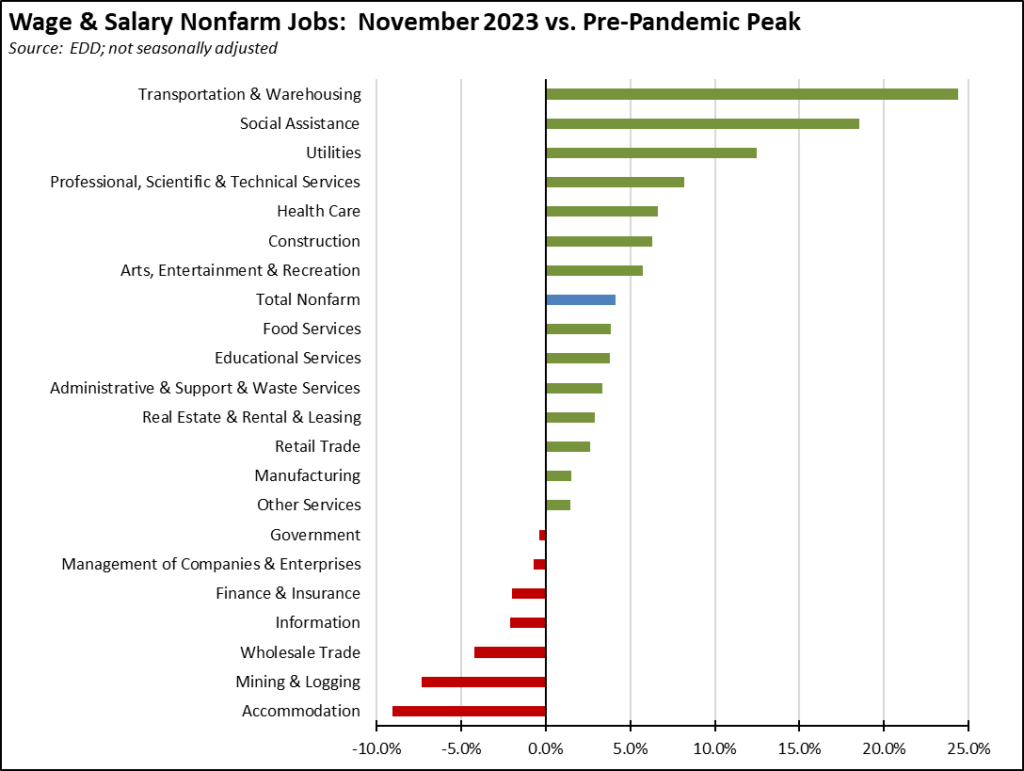
The unadjusted numbers continue to show the same pattern in the more detailed industry breakdown. Blue collar, middle-class wage Transportation & Warehousing forms the base of the state’s recovery, although lower wage Social Assistance—largely composed of government-funded and very low wage In-home Supportive Services (IHSS)—also continues to rise. Weakest recovery remains in the blue collar, higher-wage jobs in Mining & Logging targeted by state policy for elimination and in the lower-wage Accommodation jobs that were heavily impacted by the state shutdown policies.
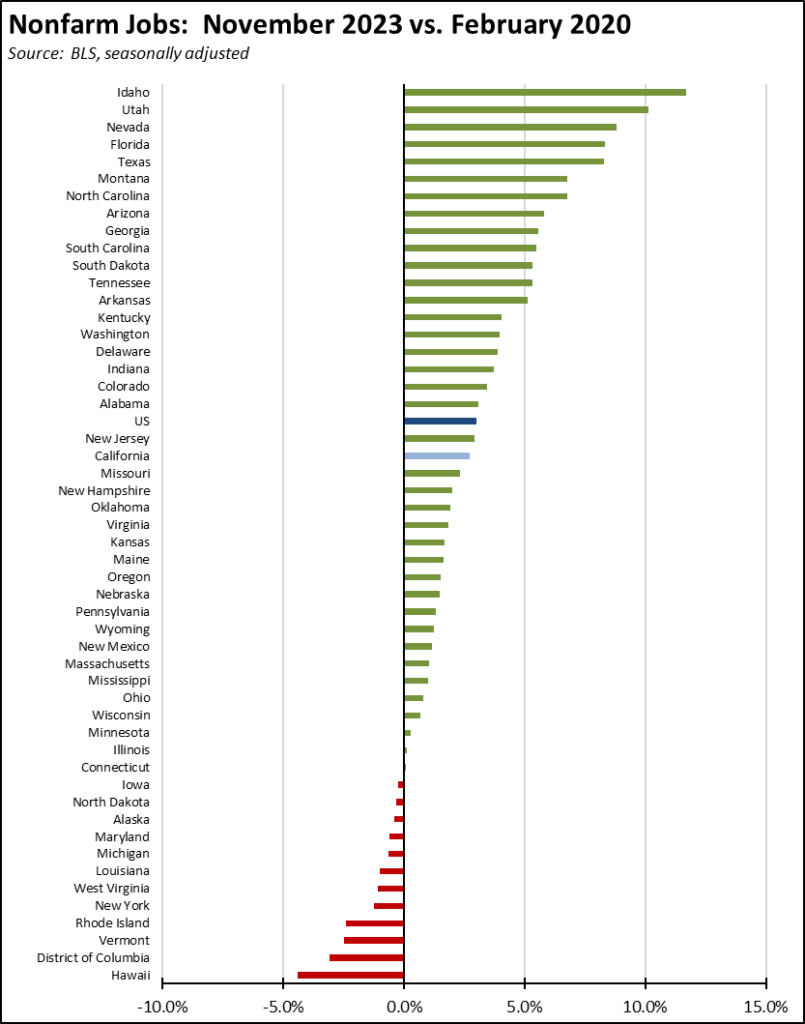
Recovery Progress: CA Nonfarm Jobs vs. Other States
California’s November job performance came in 9th highest among the states. Florida led with 30,900, followed by Texas with 26,800. Compared to the pre-pandemic peak, California has now gained 485,900 nonfarm jobs, still in third behind Texas (1,123,600) and Florida (780,400). Adjusted for size, California again ranked 21st highest, just below the US average.
Nonfarm Jobs by Region
In spite of continuing tech industry layoffs, the Bay Area again posted a positive jobs growth in November, and the Los Angeles Region again showed higher jobs numbers. More critical to the state budget numbers and expected deficit, overall jobs recovery since the pandemic in the budget-driving Bay Area remains weak.
Because the data in the table is seasonally adjusted, the numbers should be considered as the total for the counties in each region rather than the regional number. This job series also is not available for all areas in California.
Unemployment Rates by Region
Unemployment rates (not seasonally adjusted) compared to pre-pandemic February 2020 are shown below.
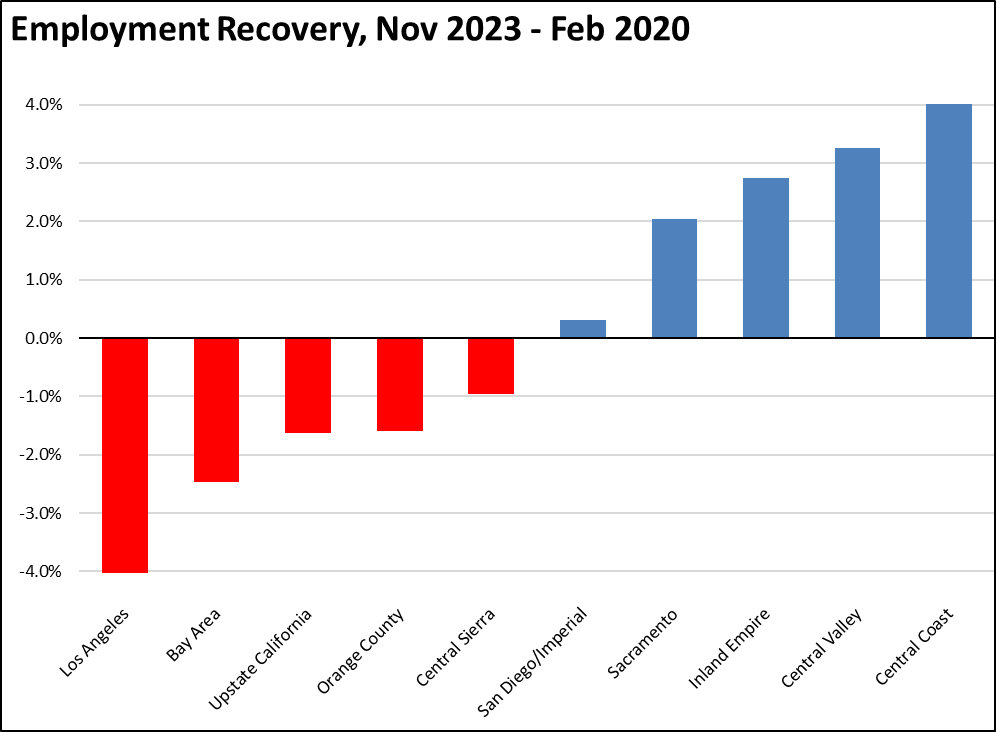
Employment Recovery by Region
Population loss especially in the Los Angeles Region and the Bay Area continue to hold down overall employment levels.
Counties with Double-Digit Unemployment
The number of counties with an unemployment rate (not seasonally adjusted) at 10% or edged up to 3. The unadjusted rates ranged from 3.8% in San Mateo to 18.7% in Imperial.
MSAs with the Worst Unemployment Rates
In October, California contained just over half (13) of the MSAs among the 25 urban areas with the worst unemployment rates, including the worst region of the country in El Centro MSA (Imperial County). Los Angeles-Long Beach-Anaheim MSA fell just on the other side of this group, tying with three other MSAs—including Vallejo-Fairfield MSA—at #350. San Luis Obispo-Paso Robles-Arroyo Grande MSA and Napa MSA were the highest ranked California urban areas, tying with 14 other MSAs at #205 (3.3%).