The Center for Jobs and the Economy has released our initial analysis of the October Employment Report from the California Employment Development Department. For additional information and data about the California economy visit www.centerforjobs.org/ca.
Highlights for policy makers:
- California Labor Force
- Recovery Progress: CA vs. US
- Recovery Progress: CA Jobs by Wage Level
- Recovery Progress: CA Employment vs. Other States
- Nonfarm Jobs
- Recovery Progress: CA Nonfarm Jobs vs. Other States
- Nonfarm Jobs by Region
- Unemployment Rates by Region
- Employment Recovery by Region
- Counties with Double-Digit Unemployment
- MSAs with the Worst Unemployment Rates
California Labor Force
California’s reported unemployment rate (seasonally adjusted) in October was up 0.1 point to 4.8% as employment continued to lose ground. The US rate was also up 0.1 point to 3.9%.
California again had the 3rd highest unemployment rate, ahead of only Nevada and DC.
Employment dropped 28,800 (seasonally adjusted). In the last 4 months, total employment dropped 112,200.
US employment was down 348,000.
California unemployment rose 17,700, while US unemployment rose 146,000.
California labor force (seasonally adjusted) was down 11,100, while the labor force participation rate remained level at 62.3%. The US labor force was down 201,000, while the participation rate dipped 0.1 point to 62.7%.
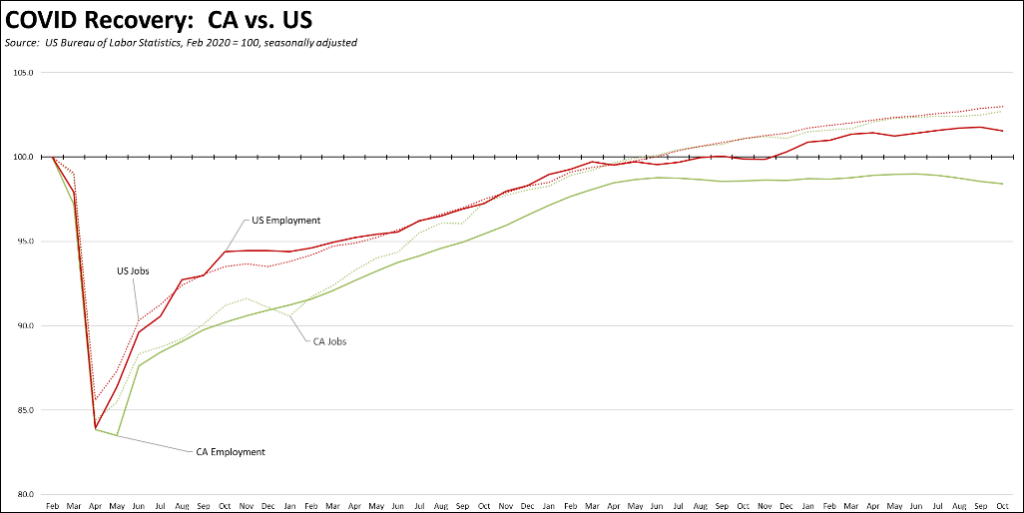
Recovery Progress: CA vs. US
The October data finally reported positive results on the jobs front. Nonfarm jobs (seasonally adjusted) in October were up 40,200, and September’s total was revised upwards by 5,700. These numbers reversed the weakness of the prior three months which combined saw nonfarm jobs up by only 22,000.
The same, however, cannot be said of employment—the number of people working—which came in negative for the fourth month in a row. Since July, total employment has now dropped 112,200, while the unemployment rate has continued to climb.
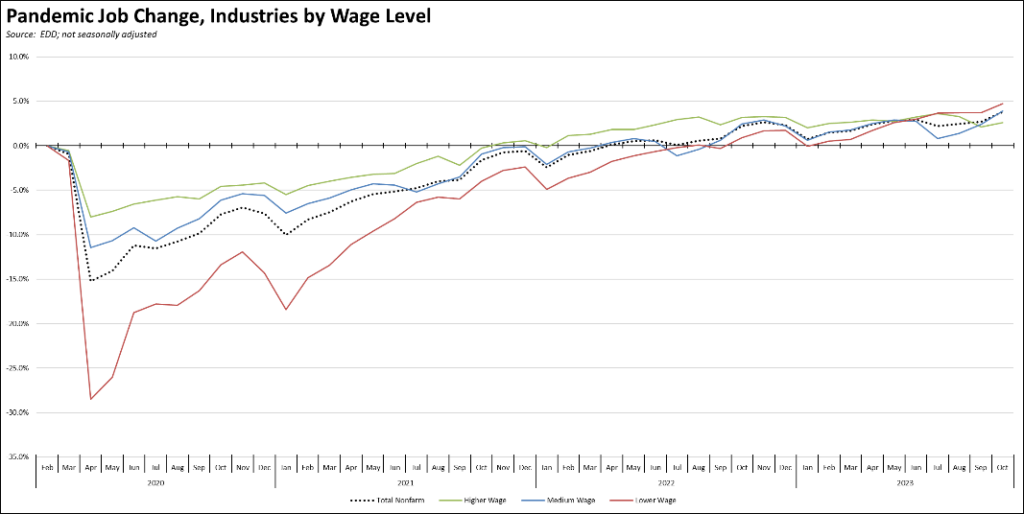
Recovery Progress: CA Jobs by Wage Level
Using the unadjusted series to provide a more detailed look at jobs by industry wage level compared to the pre-pandemic peak, the lower wage industries continue to lead while the higher wage industries now lag the overall pace of recovery.
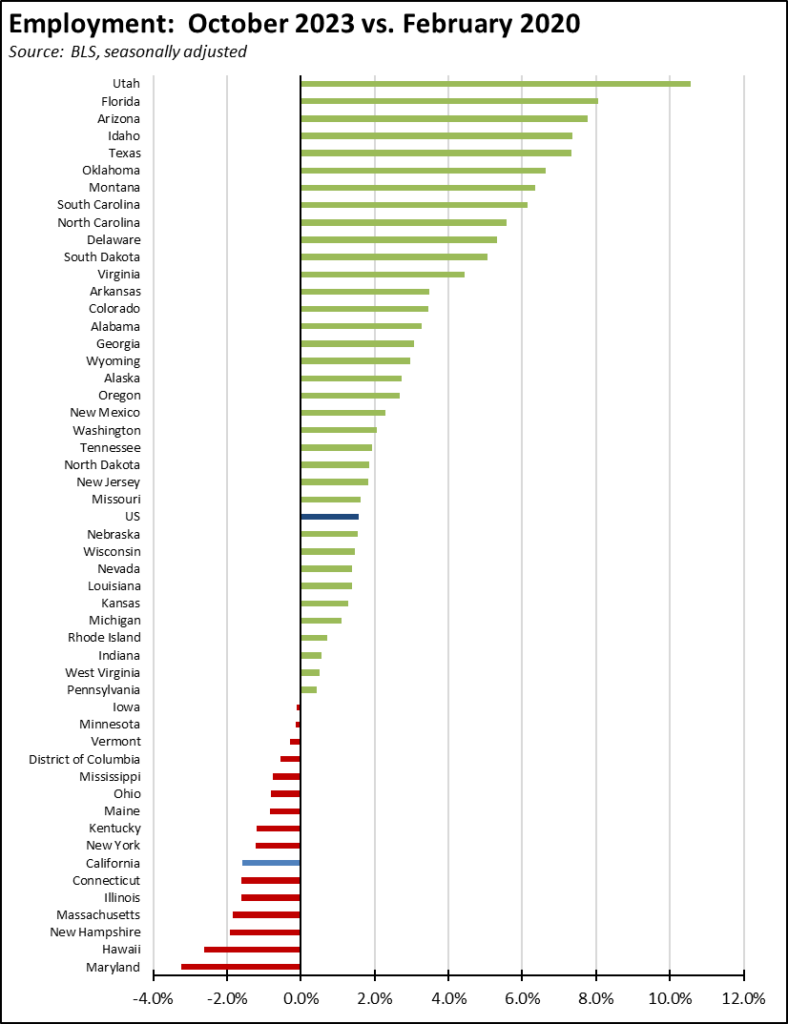
Recovery Progress: CA Employment vs. Other States
Compared to the pre-pandemic peak in February 2020, California’s continued weak employment recovery again posted 7th worst among the states and DC.
Nonfarm Jobs
Nonfarm wage and salary jobs were up 40,200 (seasonally adjusted), while the previously reported September gains were revised up to 14,400.
Nonfarm jobs rose 150,000 in the US in October.
The seasonally adjusted numbers for California showed gains in 14 industries and losses in 4. Increases were led by Healthcare & Social Assistance (13,400), Accommodation & Food Services (5,800), and Transportation, Warehousing & Utilities (4,500). Losses were led by Finance & Insurance (-1,000), Arts, Entertainment, & Recreation (-700), Professional, Scientific & Technical Services (-200), and Private Educational Services (-200).
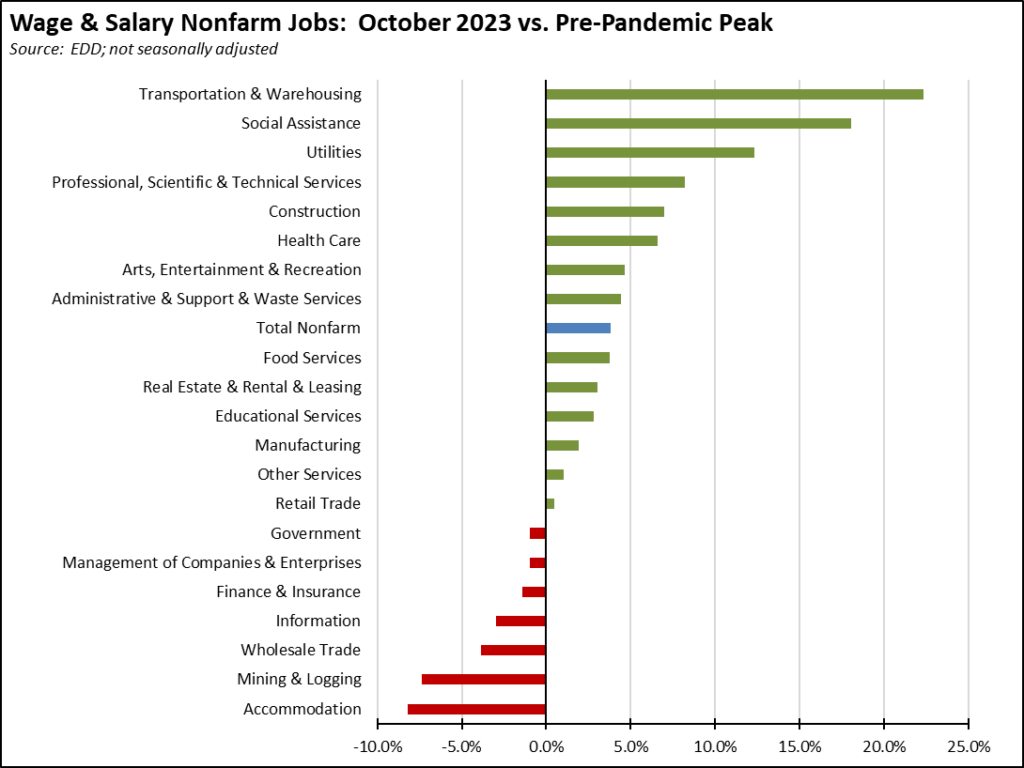
The unadjusted numbers continue to show the same pattern in the more detailed industry breakdown. Blue collar, middle-class wage Transportation & Warehousing continues to be the base of the state’s recovery, although lower wage Social Assistance—largely composed of government-funded and very low wage In-home Supportive Services (IHSS)—also continues to rise. Weakest recovery is in the blue collar, higher-wage jobs in Mining & Logging targeted by state policy for reductions and in the lower-wage Accommodation jobs that were heavily impacted by the state shutdown policies.
Recovery Progress: CA Nonfarm Jobs vs. Other States
California’s stronger October job performance came in first among the states, followed by Florida (28,400) and Washington (7,900). Compared to the pre-pandemic peak, California has now gained 482,300 nonfarm jobs, still in third behind Texas (1,076,900) and Florida (756,400). Adjusted for size, California again ranked 21st highest, just below the US average.
![]()
Nonfarm Jobs by Region
The state budget-critical Bay Area nonfarm job numbers turned positive in September, while Los Angeles Region again experienced stronger growth. Compared to the pre-pandemic high, net jobs growth remains the strongest in the interior regions and San Diego.
Because the data in the table is seasonally adjusted, the numbers should be considered as the total for the counties in each region rather than the regional number. This job series also is not available for all areas in California.
Unemployment Rates by Region
Unemployment rates (not seasonally adjusted) compared to pre-pandemic February 2020 are shown below. The smaller rural regions and Central Valley show stronger recovery based on this metric, while lagging performance in the state’s major population centers contribute to the state’s high overall rate.
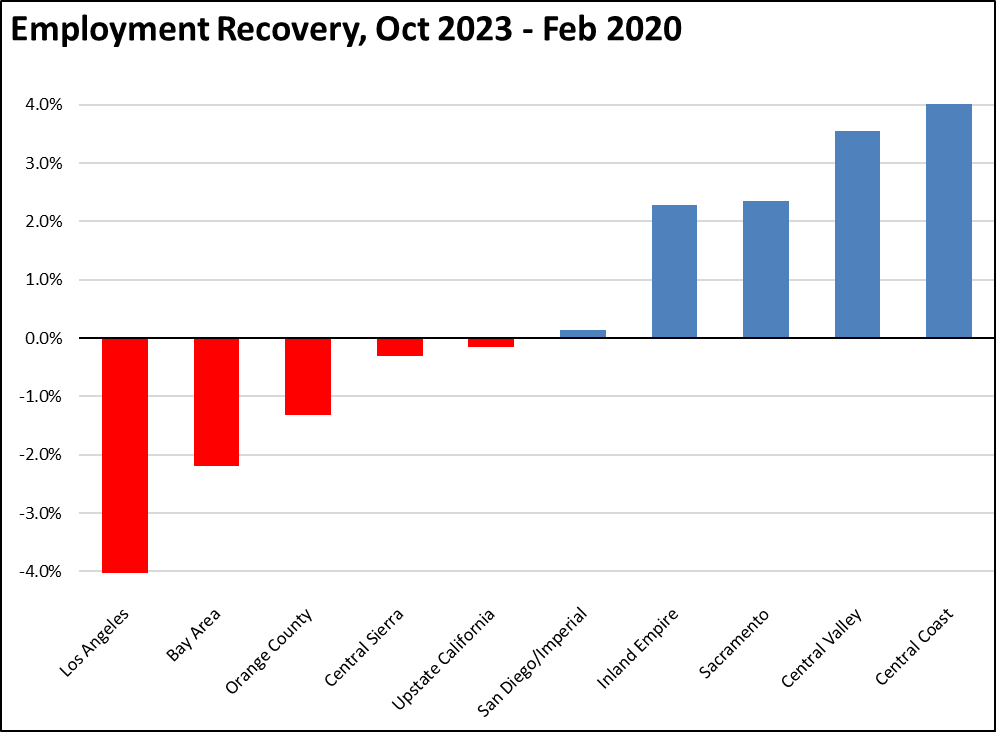
Employment Recovery by Region
The same general pattern is also shown in the employment recovery numbers (not seasonally adjusted). Population loss especially in Los Angeles Region and Bay Area continue to hold down overall employment levels.
Counties with Double-Digit Unemployment
The number of counties with an unemployment rate (not seasonally adjusted) at 10% or remained at 1. The unadjusted rates ranged from 3.2% in San Mateo to 19.3% in Imperial.
MSAs with the Worst Unemployment Rates
In September, California contained 11 of the MSAs among the 25 urban areas with the worst unemployment rates, including the worst region of the country in El Centro MSA (Imperial County) and Los Angeles-Long Beach-Anaheim MSA tying with Brownsville-Harlingen, TX for the 25th worst. Another 3 California MSAs—Redding, Chico, and Riverside-San Bernardino MSAs–fell just on the other side of the worst 24. San Jose-Sunnyvale-Santa Clara MSA moved back into the highest ranked for California, tied at #179 with 11 other MSAs with an unemployment rate of 3.3%.