The Center for Jobs and the Economy has released our initial analysis of the September Employment Report from the California Employment Development Department. For additional information and data about the California economy visit www.centerforjobs.org/ca.
Highlights for policy makers:
- Recovery Progress: CA vs. US
- Recovery Progress: CA Jobs by Wage Level
- California Labor Force
- Recovery Progress: CA Employment vs. Other States
- Nonfarm Jobs by Region
- Recovery Progress: CA Nonfarm Jobs vs. Other States
- JOB OPENINGS
- Nonfarm Jobs by Region
- Unemployment Rates by Region
- Employment Recovery by Region
- Counties with Double-Digit Unemployment
- MSAs with the Worst Unemployment Rates
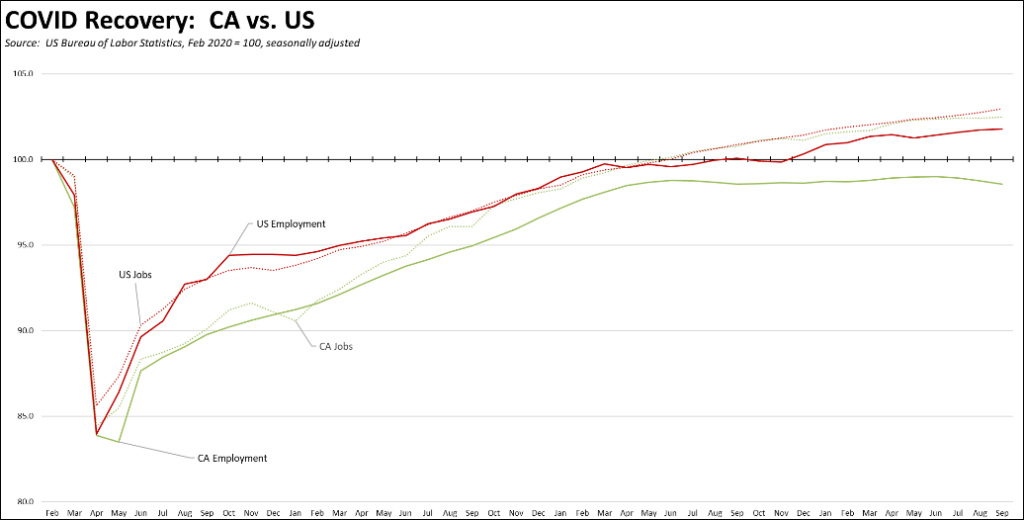
Recovery Progress: CA vs. US
The September data overall shows slowing in the state economy. Nonfarm jobs (seasonally adjusted) posted a gain of only 8,700, while August’s gains were nearly erased with a downward revision of 19,000 to only 3,200.
Employment—the number of people working—dropped for the third month in a row with a loss of 36,290 and coming in at the lowest level since April 2022. The state’s emphasis on benefits expansion rather than policies to foster stronger employment growth continues to undermine the labor supply required for stronger jobs growth and consequently more lasting solutions to income inequality.
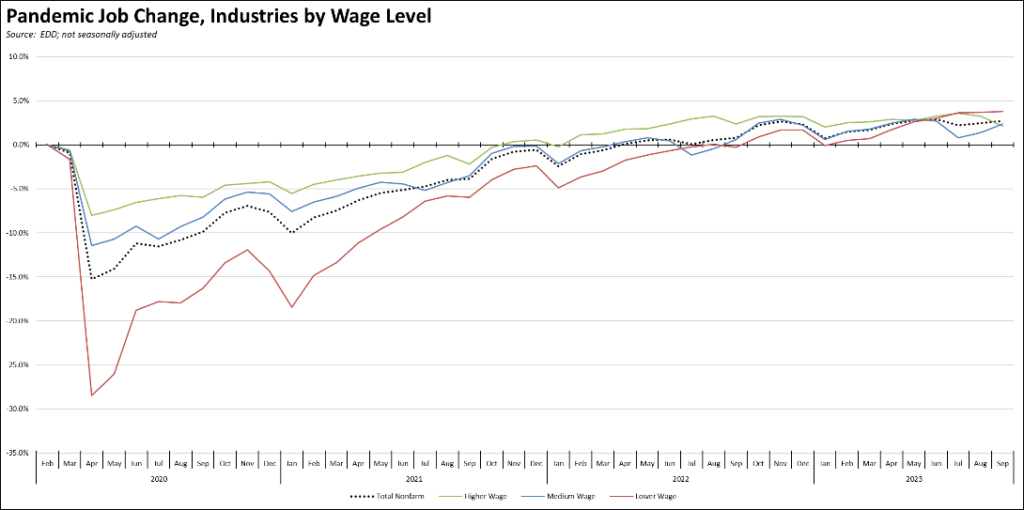
Recovery Progress: CA Jobs by Wage Level
Using the unadjusted series to provide a more detailed look at jobs by industry wage level, the medium wage industries showed the strongest growth, while higher wage industries were in retreat.
California Labor Force
California’s reported unemployment rate (seasonally adjusted) in September was up 0.2 point to 4.7%. The US rate was unchanged at 3.8%.
California again had the 3rd highest unemployment rate, ahead of only Nevada and DC.
Employment dropped 36,300 (seasonally adjusted). In the last 3 months, total employment was down 83,700.
US employment was little changed with a gain of 86,000 in September.
California unemployment rose 18,600, while US unemployment was up by only 5,000.
California labor force numbers (seasonally adjusted) dropped 17,700, while the labor force participation rate dipped another 0.1 point to 62.3%. The US labor force was up marginally at 90,000, while the participation rate was unchanged at 62.8%.
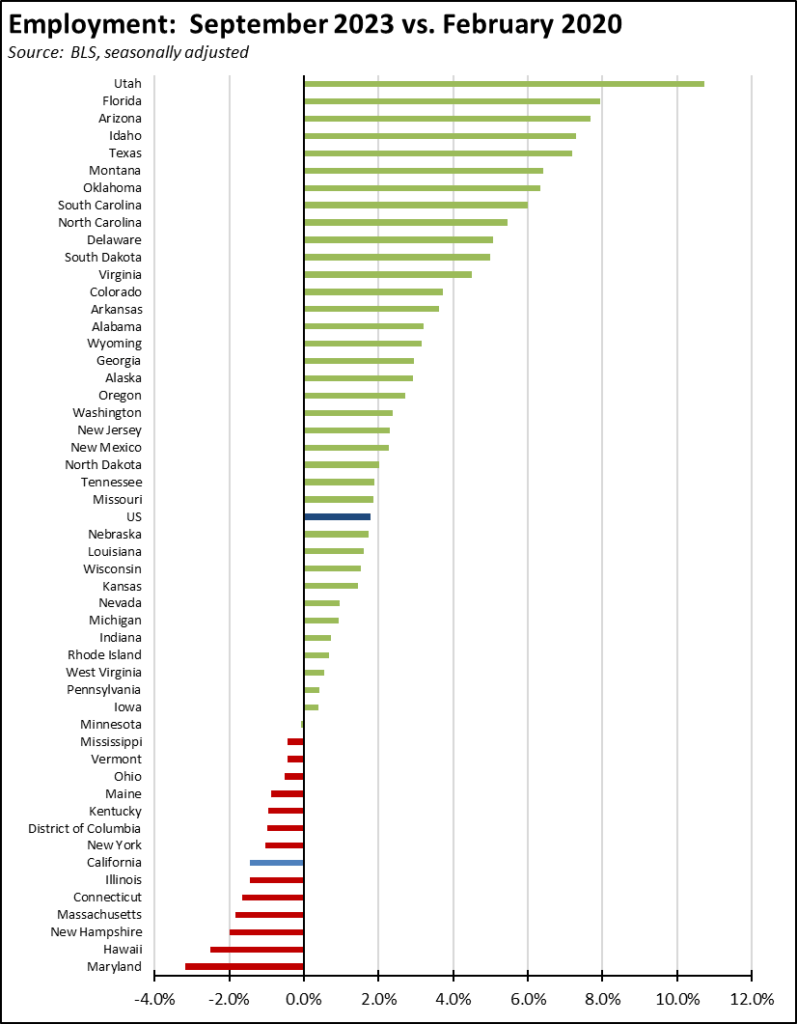
Recovery Progress: CA Employment vs. Other States
Compared to the pre-pandemic peak in February 2020, California’s continued weak employment recovery again posted 7th worst among the states and DC.
Nonfarm Jobs by Region
Nonfarm wage and salary jobs were up 8,700 (seasonally adjusted), while the previously reported August gains were revised down by 19,000.
Nonfarm jobs nationally were up 336,000 in September.
The seasonally adjusted numbers for California showed gains in 7 industries, losses in 10, and no change in Private Educational Services. Increases were led by Healthcare & Social Assistance (18,200), Accommodation & Food Services (12,100), and Retail Trade (3,100). Losses were led by Information (-7,300) as tech layoffs have increased, Professional, Scientific & Technical Services (-5,900) and Administrative & Support & Waste Management Services (-5,500).
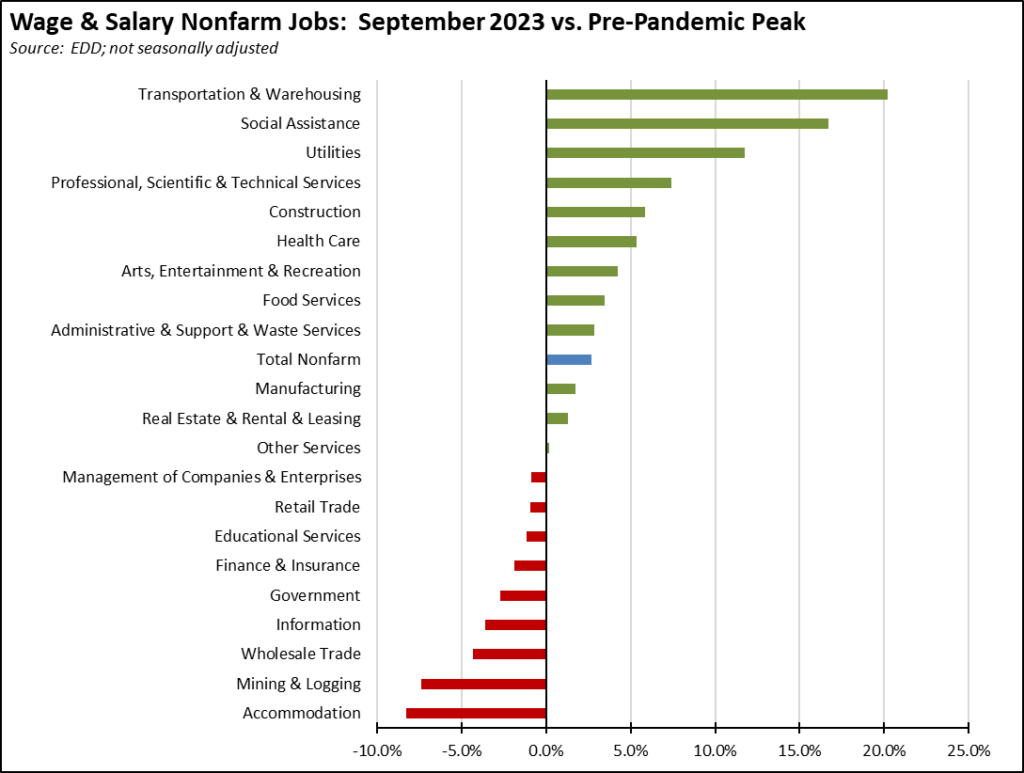
Using the unadjusted numbers to show a more detailed industry breakdown, blue collar, middle-class wage Transportation & Warehousing continues to show the strongest recovery compared to the pre-pandemic peak. The second highest contributor is lower wage Social Assistance—largely composed of government-funded and very low wage In-home Supportive Services (IHSS). Weakest recovery continues to be the blue collar, higher-wage jobs in Mining & Logging targeted by state policy for reductions and in the lower-wage Accommodation jobs that were heavily impacted by the state shutdown policies.
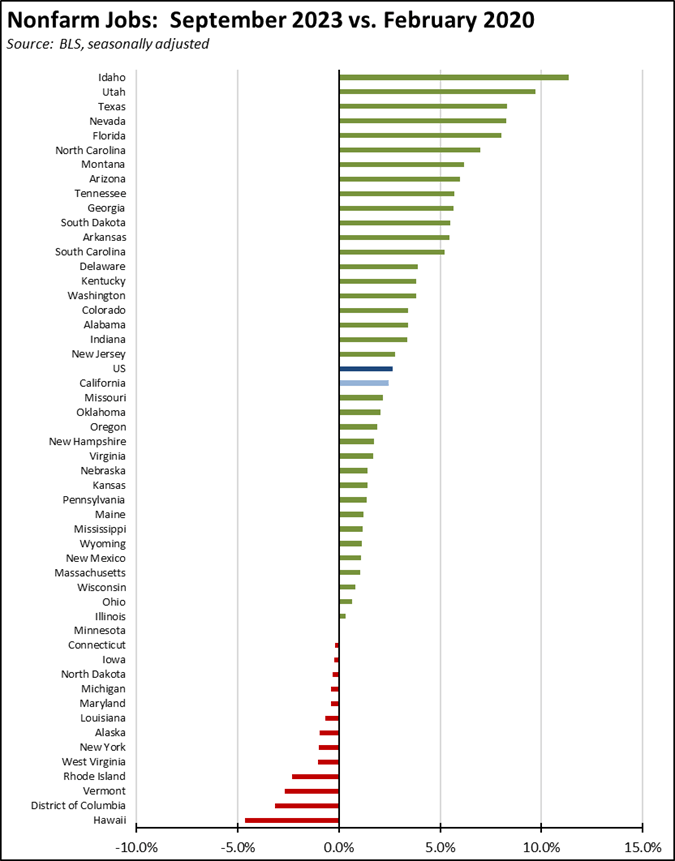
Recovery Progress: CA Nonfarm Jobs vs. Other States
California’s September job performance ranked 9th among the states which were led by Texas with a gain of 61,400, New York with 21,700, and Florida at 19,600. Compared to the pre-pandemic peak, California has now gained 436,400 nonfarm jobs, coming in third behind Texas (1,078,100) and Florida (728,800). Adjusted for size, California again ranked 21st highest, just marginally below the US average.
JOB OPENINGS
Continued weakness in the labor force numbers saw California unfilled job openings rise by 36,000 at the end of August. Nationally, job openings rose 690,000 to 9.6 million.
The number of quits continued dropping as workers react to uncertainty in the economy, reaching its lowest level since August 2020 at 279,000. Hires were down 109,000 from July to 511,000.
Nonfarm Jobs by Region
The statewide nonfarm job numbers were driven in part by weakness in the critical Bay Area results, which posted a loss of 5,200. The interior regions show the largest net job gains since the pre-pandemic peak, while stronger jobs growth in September continued to push the Los Angeles Region more into positive territory.
Because the data in the table is seasonally adjusted, the numbers should be considered as the total for the counties in each region rather than the regional number. This job series also is not available for all areas in California.
Unemployment Rates by Region
Unemployment rates (not seasonally adjusted) compared to pre-pandemic February 2020 are shown below. The Bay Area had the lowest rate in September but still has not matched its pre-pandemic performance.
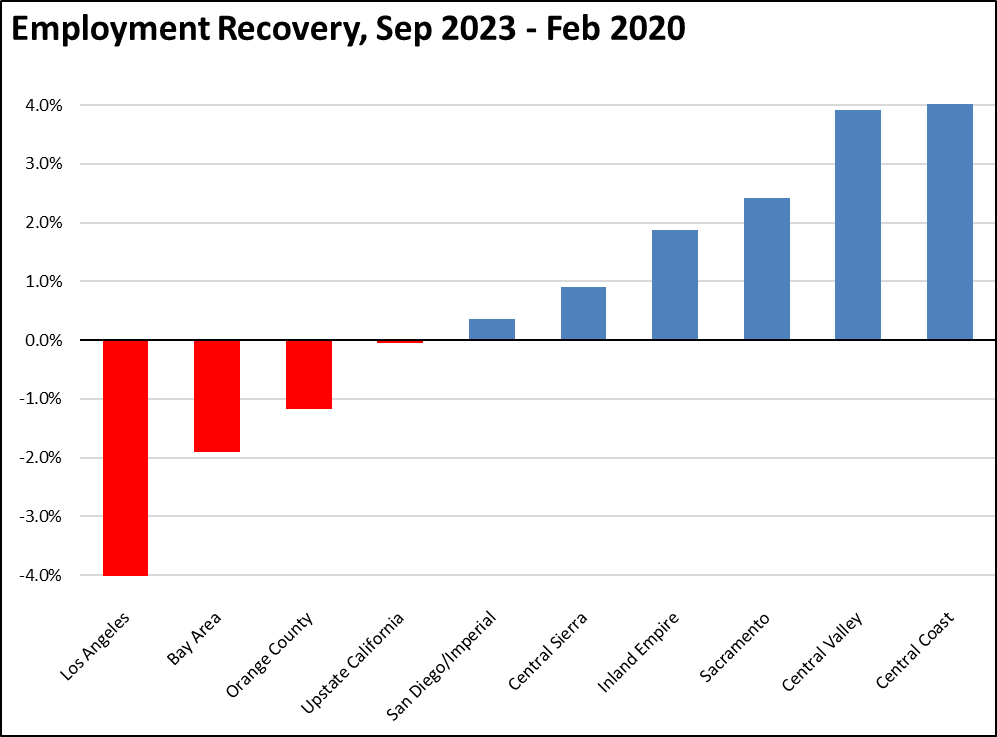
Employment Recovery by Region
The same general pattern is also shown in the employment recovery numbers (not seasonally adjusted). Weakness remaining in the Los Angeles Region continues to hold down the statewide performance, while the interior regions experience stronger results.
Counties with Double-Digit Unemployment
The number of counties with an unemployment rate (not seasonally adjusted) at 10% or more dipped to 1. The unadjusted rates ranged from 3.3% in San Mateo to 19.7% in Imperial.
MSAs with the Worst Unemployment Rates
In August, California contained 11 of the MSAs among the 25 urban areas with the worst unemployment rates, including the worst region of the country in El Centro MSA (Imperial County). As the labor force numbers remain weak, Los Angeles-Long Beach-Anaheim MSA returned to this category. Napa MSA was the highest ranked in California, tied at #171 with 15 other MSAs with an unemployment rate of 3.6%.