Highlights for policy makers:
- March 2023 Jobs Report
- Recovery Progress : CA vs. US
- Recovery Progress: CA Jobs by Wage Level
- California Labor Force
- Recovery Progress: CA Employment vs. Other States
- Nonfarm Jobs
- Recovery Progress: CA Nonfarm Jobs vs. Other States
- JOB OPENINGS
- Unemployment Rates by Region
- Employment Recovery by Region
- Counties with Double-Digit Unemployment
- MSAs with the Worst Unemployment Rates
March 2023 Jobs Report
The Center for Jobs and the Economy has released our initial analysis of the January Employment Report from the California Employment Development Department. For additional information and data about the California economy visit www.centerforjobs.org/ca.
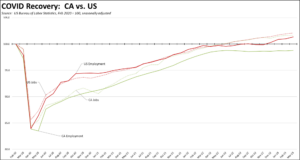
Recovery Progress : CA vs. US
The March data generally showed a slowing in the numbers. Nonfarm jobs (seasonally adjusted) showed a gain of only 8,700 in March, with another sharp downward revision to the previous month’s number to 21,800. Putting aside December’s loss, the March jobs number was the lowest gain since September 2021. Employment had a somewhat stronger gain of 14,700, but the total still remains 228,000 (1.3%) below the pre-pandemic peak in February 2020. Even with the March uptick, California employment has remained essentially unchanged since last June, putting pressure on the state’s ability to expand jobs going forward.
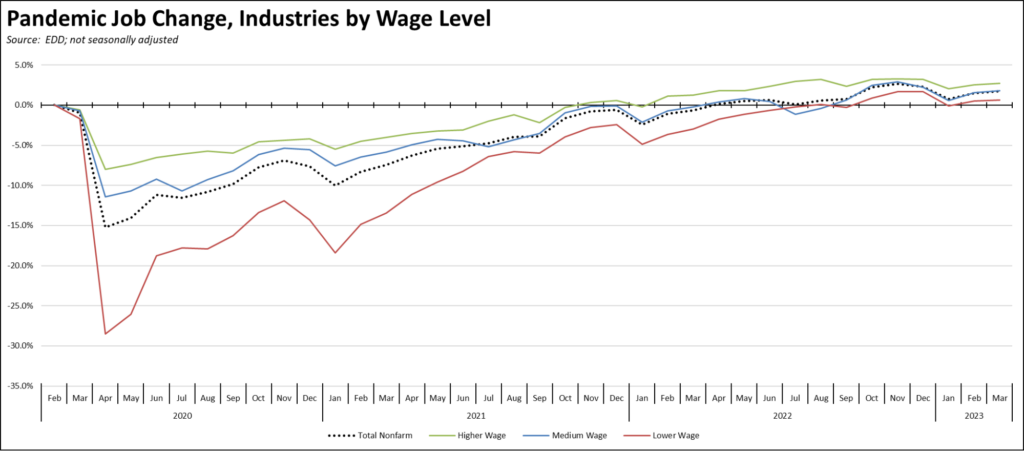
Recovery Progress: CA Jobs by Wage Level
Using the unadjusted series to provide a more detailed look at jobs by industry wage level, all three wage groupings remain above the pre-pandemic peak. Higher wage industries continue to show the strongest recovery, and have begun to recover from the dips that began to show in the first quarter. Lower wage industries again show the weakest recovery, but the totals are more affected by seasonal factors than the other two groupings.
California Labor Force
California’s reported unemployment rate (seasonally adjusted) in March was unchanged at 4.4%. The US rate improved by 0.1 point to 3.5%.
California tied with Delaware, Illinois, and Oregon for the 4th highest unemployment rate among the states and DC.
Employment was up 14,700 (seasonally adjusted), bringing the state back to just shy of the employment number last June, while US employment rose by 577,000.
California unemployment rose 17,900, while US unemployment was down by 97,000.
California labor force numbers (seasonally adjusted) saw a positive gain of 32,700, pushing the labor force participation rate up 0.1 point to 62.3%. The US overall saw somewhat stronger gains of 480,000, also raising the participation rate 0.1 point to 62.6%.
Recovery Progress: CA Employment vs. Other States
Compared to the pre-pandemic peak in February 2020, California’s weak employment recovery again placed it 41st highest among the states and DC.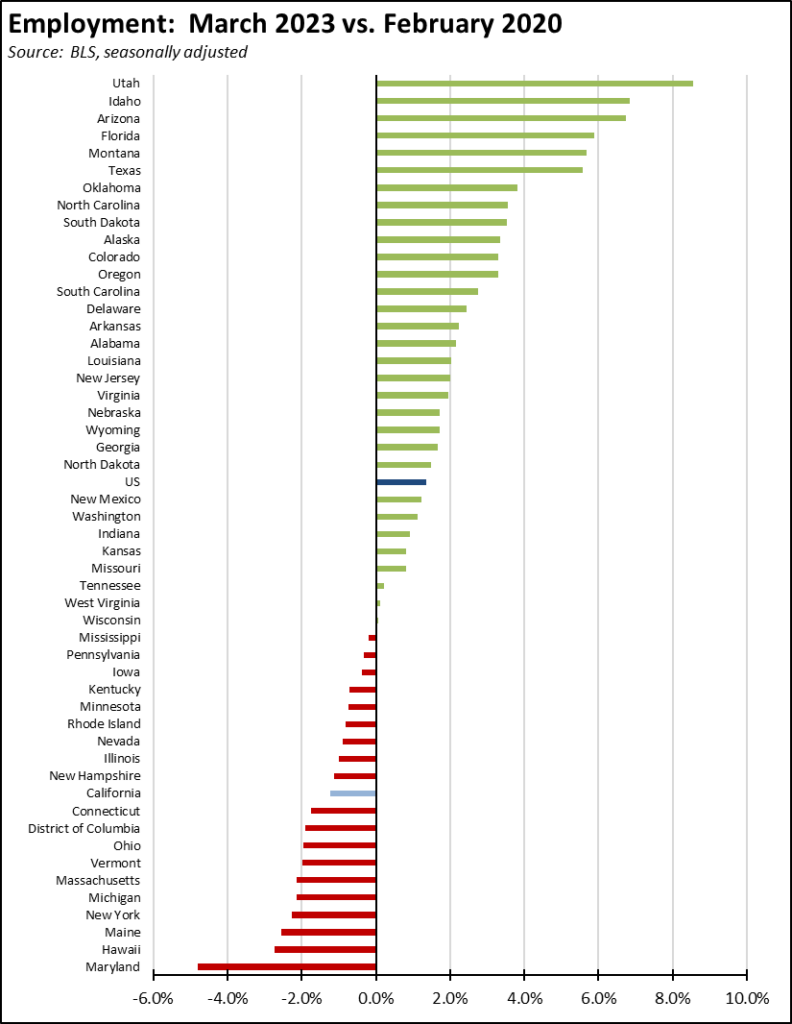
Nonfarm Jobs
Nonfarm wage and salary jobs were up 8,700 (seasonally adjusted), while the previously reported February gains were revised down by 10,500 to 21,800.
Nonfarm jobs nationally were up relatively stronger at 236,000 in March.
The seasonally adjusted numbers for California showed gains in 6 industries and losses in 12 industries, with the increases led by Information (7,800), Health Care & Social Assistance (7,400), and Government (6,900). Losses were led by Construction (-8,200), Administrative and Support and Waste Services (-5,000), and Real Estate & Rental & Leasing (-2,400).
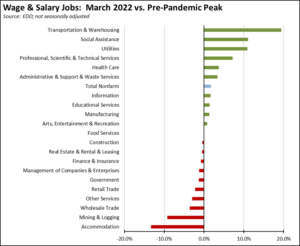
Using the unadjusted numbers to show a more detailed industry breakdown, blue collar, middle-class wage Transportation & Warehousing continues to show the strongest recovery compared to the pre-pandemic peak. This industry is followed by Social Assistance—largely composed of government-funded In-home Supportive Services (IHSS)—and utilities. Weakest recovery continues to be the blue collar, higher-wage jobs in Mining & Logging targeted by state policy for reductions and in lower-wage Accommodation.
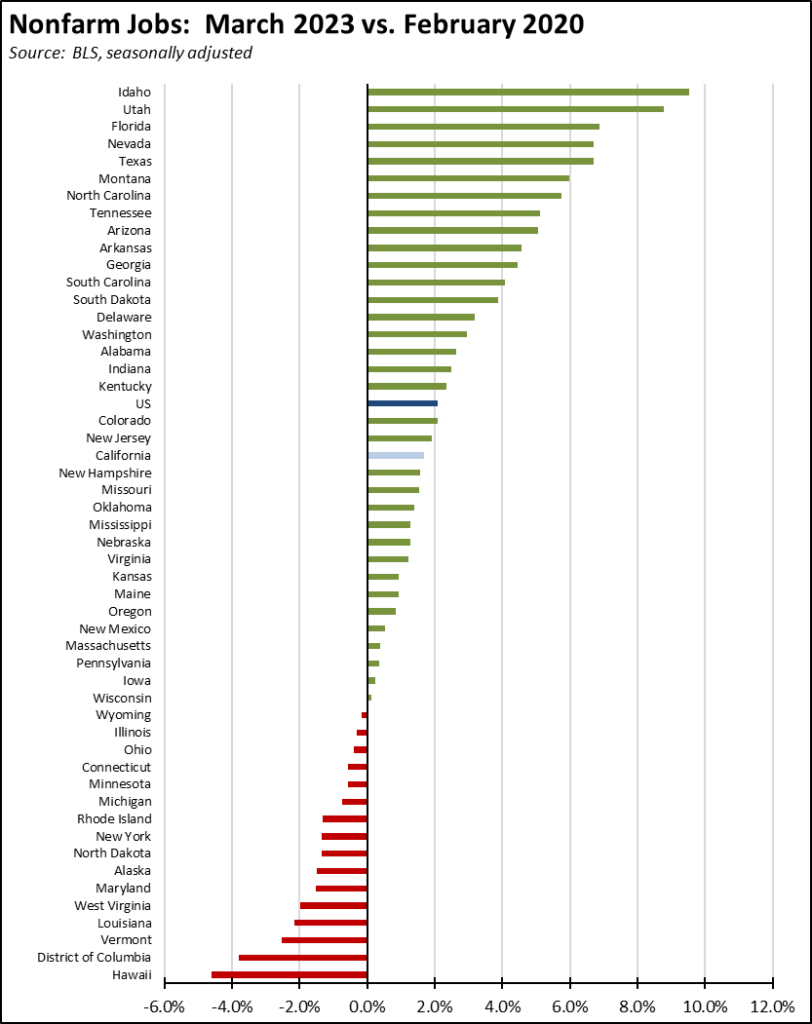
Recovery Progress: CA Nonfarm Jobs vs. Other States
On a comparative basis, California’s 8,700 jobs gain was 8th highest among the states and DC, which were led by Texas (28,600), New York (18,100), and Massachusetts (16,300). Compared to the pre-pandemic peak in February 2020, California (295,200) again was third, behind Texas (867,900) and Florida (624,000) but still ahead of North Carolina (265,700). On a comparative basis, California’s recovery rate remained 21st highest among the states. Sixteen states and DC remained below their pre-pandemic peaks.
JOB OPENINGS
California unfilled job openings at the end of February continued dropping to 0.964 million, or a total drop of 275,000 since November. While unfilled job openings remain high and represent a potential source of growth for both state incomes and tax revenues, the reductions over the prior 3 months reflect businesses in the state pulling back on their hiring plans. Nationally, job openings dropped 632,000 to 9.931 million.
Unemployment Rates by Region
Unemployment rates (not seasonally adjusted) compared to pre-pandemic February 2020 are shown below.
Figure Source: California Employment Development Department
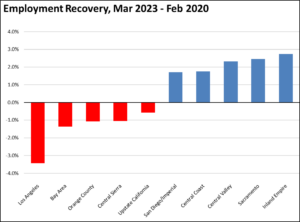
Employment Recovery by Region
Los Angeles Region continues to lag the rest of the state in recovery to the pre-pandemic peak employment levels (not seasonally adjusted), while most other regions showed some improvement in the March numbers.
Counties with Double-Digit Unemployment
The number of counties with an unemployment rate (not seasonally adjusted) at 10% or more remained at 5. The unadjusted rates ranged from 2.8% in San Mateo to 19.2% in Colusa.
MSAs with the Worst Unemployment Rates
The number of California MSAs among the 25 regions with the worst unemployment rates in February edged down from 12 to 11. Los Angeles-Long Beach-Anaheim MSA dipped to #305 in a tie with 6 other MSAs in other states.
|
MSA |
May Unemp. Rate |
Rank (out of 389) |
| El Centro MSA | 16.0% | 389 |
| Visalia-Porterville MSA | 10.0% | 387 |
| Merced MSA | 9.3% | 386 |
| Bakersfield MSA | 8.6% | 385 |
| Hanford-Corcoran MSA | 8.0% | 384 |
| Fresno MSA | 7.5% | 383 |
| Madera MSA | 7.3% | 382 |
| Yuba City MSA | 7.2% | 381 |
| Modesto MSA | 6.4% | 380 |
| Salinas MSA | 6.3% | 378 |
| Stockton-Lodi MSA | 5.9% | 374 |
| Santa Cruz-Watsonville MSA | 5.7% | 372 |