Highlights for policy makers:
- Unemployment Rate Holds at 7.3%; Total Employment Climbs 83,400
- Labor Force Participation Rate Remains at 1976 Levels
- 1/5 of Total Employed in Part Time Work
- Nonfarm Jobs Decrease 9,800
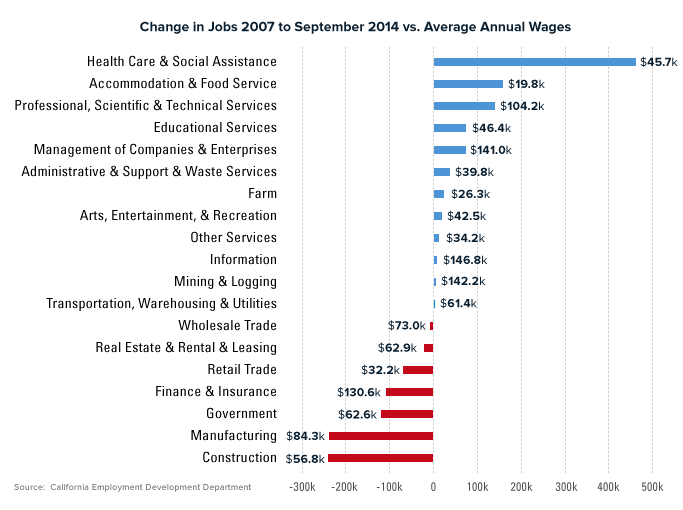
- 7 Industries Remain Below 2007 Pre-Recession Job Levels; 12 Above
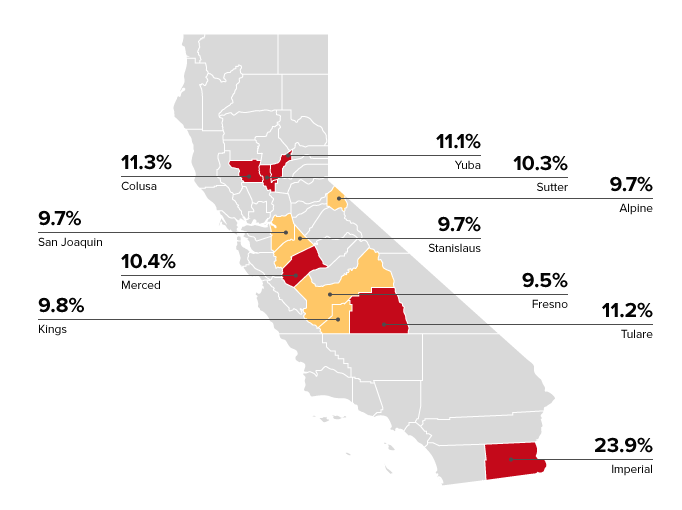
- 6 Counties Remain in Double-Digit Unemployment, Improved from 11 in August
- Two-Tier Economy Persists
Unemployment Rate Improves to 7.3%; Total Employment Climbs 83,400
The Labor Force data for September 2014 (seasonally adjusted; California preliminary) is shown below, along with the change from the prior month:
The related not seasonally adjusted numbers (California preliminary), with the change from September 2013:
California Employment Development Department’s (EDD) latest release shows on a seasonally adjusted basis, total employment grew by 83,400, while the number of unemployed dropped by 14,200. California’s seasonally adjusted unemployment rate declined slightly to 7.3%. The unadjusted rate dropped 0.6 points from August 2014 to 6.9% in September 2014, the lowest since June 2008.
By comparison, total US employment grew 0.2% (seasonally adjusted increase of 232,000), while the number of unemployed decreased even more sharply by 3.4% (seasonally adjusted decrease of 329,000).
California’s seasonally adjusted unemployment rate now stands 24% higher than the national rate. California was tied with Nevada and Tennessee for the 4th highest unemployment rate.
Between September 2013 and September 2014, Bureau of Labor Statistics (BLS) data shows the total number of employed increased by 390,662 (not seasonally adjusted). This increase was the highest among the states, ahead of Texas (311,962) and Florida (301,482).
Labor Force Participation Rate Remains at 1976 Levels
The state’s seasonally adjusted labor force participation 62.1% is marginally improved from August, but still remains at a level last seen in 1976
1/5 of Total Employed in Part Time Work
The percentage of part time workers remained at 20.1% of total employment, with 7.1% working part time for economic reasons (primarily the lack of full time jobs).
Nonfarm Jobs Decrease 9,800
EDD reported that between August and September 2014, seasonally adjusted nonfarm payroll jobs decreased by 9,800. Not seasonally adjusted, nonfarm payroll jobs grew by 68,100.
Looking at the not seasonally adjusted numbers, the change in nonfarm payroll jobs from August 2014 saw the largest increases in Government (62,500) and Educational Services (16,400) as students returned to school, Administrative & Support & Waste Services (11,100), and Transportation, Warehousing & Utilities (3,900) as trade related to the holiday season begins picking up. Biggest declines were in Other Services (-5,700), continued drops in Finance & Insurance (-2,100), and Manufacturing (-1,700). Overall, the unadjusted Total Nonfarm payroll jobs increased 68,100 from August, dominated by the seasonal increases in school-related jobs.
7 Industries Remain Below 2007 Pre-Recession Job Levels; 12 Above

Comparing the number of jobs by industry in September 2014 (seasonally adjusted), 7 industries remain below the 2007 pre-recession levels and 12 are above. As indicated in the figure above, growth has been primarily in the lower wage and higher wage industries. Significant job growth in industries paying above $50,000 a year average wage has been limited to Professional, Scientific & Technical Services and Management of Companies & Enterprises. All other industries in this wage category remain near or significantly below the 2007 average employment levels.
6 Counties Remain in Double-Digit Unemployment, Improved from 11 in August

Two-Tier Economy Persists
Unemployment rates and employment (all data is not seasonally adjusted) continue to vary widely across the state, with the spread between regions remaining essentially the same at 1.9.
By County:
Ratio of Highest to Lowest Rate: 6.13
By Legislative District:
Ratio of Highest to Lowest Rate: Senate 2.90
Ratio of Highest to Lowest Rate: Assembly 3.99
