Highlights for policy makers:
- Unemployment Dips to Record Low of 4.0%; Employment Up 38,000
- Labor Force Participation Rate Level at 62.0%
- Employment Growth Ranking—California Ranked 50th
- Nonfarm Jobs Up 21,300 for Month; California Remains Ranked #1 for 12-month Gain
- Jobs Change by Industry
- Structural Shifts in State’s Economy
- Unemployment Rates by Region
- Unemployment Rates by Legislative District
- Employment Growth by Region
- MSAs with the Worst Unemployment Rates
- Chart of the Month: State Level JOLTS Data
Unemployment Dips to Record Low of 4.0%; Employment Up 38,000
EDD reported total employment (seasonally adjusted; September preliminary) was up 38,000 from the revised August numbers, while the number of unemployed dropped 17,400. Unemployment rate dipped to a record low of 4.0%. The unadjusted rate was down 0.2 point from the year earlier to 3.5%, matching May’s rate level as the lowest in the current series stretching back to 1976. The improvement in the unemployment rate comes from the labor force essentially remaining static, but with a shift to the employed.
California improved slightly to the 15th highest unemployment rate among the states.
Total US employment saw a seasonally adjusted gain of 391,000, with the number of unemployed down by 275,000. The unemployment rate reached a 50-year low of 3.5%. Improvement in the national unemployment rate came amid continuing strong gains in both the number of employed and continuing growth of the total labor force.
Figure Sources: California Employment Development Department; US Bureau of Labor Statistics
Labor Force Participation Rate Level at 62.0%
California’s seasonally adjusted labor force participation rate continued to match the historic low by remaining at 62.0% for the third month in a row. Nationally, the participation rate also remained level but at 63.2%. The state continues to experience lower than average participation rates in spite of having a relatively younger population than the rest of the US.
For the 12 months ending September 2019, the seasonally adjusted data shows the California labor force shrank by 62,500 workers (-0.3% growth) compared to the rest of the US gain of 2.0 million (1.4%).
The continuing stall out in labor force growth has significant implications for the California economy. The increasing difficulty of finding qualified workers, and in some cases any workers, puts California businesses at a competitive disadvantage to other states where the current expansion continues to draw workers back into the labor force. At the same time, this situation produces caseload demands on state and local welfare and other social assistance budgets well above where they should be given the current stage of the extended recovery.
Employment Growth Ranking—California Ranked 50th
In another sign of the economy’s slowing, the total number of persons employed (seasonally adjusted) over the 12 months ending in September shrank by 39,500. California improved slightly to the 50th highest rank with Texas leading with an additional 209,000 persons employed over this period, and Florida in second place with a gain of 161,800.
Based on percentage growth, California had a 0.2% contraction in employment, below the average for the rest of the US with a gain of 1.6%.
Figure Source: US Bureau of Labor Statistics
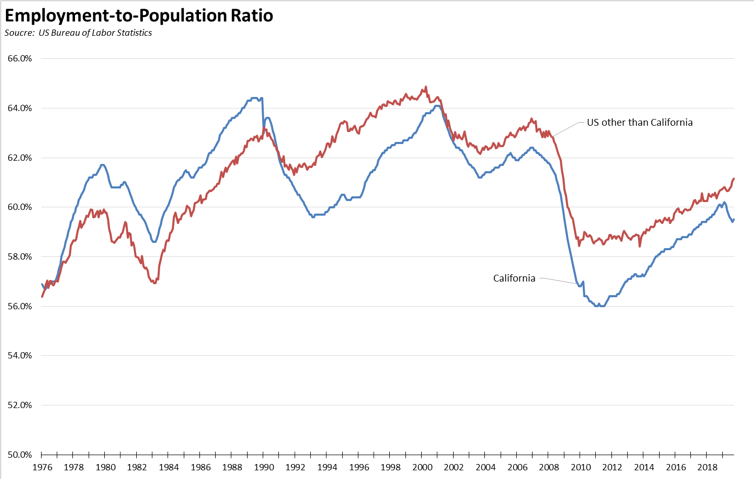
In addition to labor force participation rates, another way to measure labor force engagement is through the employment-to-population (civilian population, age 16 and over) ratio. Among other issues, this statistic has been used to measure the gain of women and minority workers over the years, but in the current circumstances can be used to indicate the ability to maintain jobs growth based on the pool of active workers.
As shown in the chart below, California achieved a higher level of growth prior to the 1990s recession in no small part to a much higher share of its working age population actually engaged in work. This relationship reversed during that recovery, but the two rates closed again at the beginning of the 2000s. The rates again diverged at that point, and the gap deepened during the most recent recession. And this gap continues even though the state has a relatively younger population—in the latest 2018 American Community Survey data, California was the 6th youngest state when measured by median age, 36.7 years compared to the other states that range from 31.0 to 45.1 years.
Similar to the labor force data, the employment ratio has dropped over the past seven months, indicating that while the economy continues to produce jobs, the population is not providing new workers to take them.
Factors leading to this situation may include the major increase in social assistance spending begun at the start of the 2000s, continuing separation in particular of lower education men from the availability of blue collar middle class wage jobs, and the continuing effect of minimum wage increases on the sharp drop in youth employment along with the early acquisition of workplace skills associated with much higher lifetime earnings potential.
Nonfarm Jobs Up 21,300 for Month; California Remains Ranked #1 for 12-month Gain
Nonfarm jobs (seasonally adjusted) were up 21,300 as August’s gains were revised to 32,000 from the previously reported 34,500.
For the 12 months ending September, total jobs growth was 320,000, keeping the state in 1st place behind Texas which gained 300,300 jobs in this period, with Florida in third at 224,700.
Adjusting for population size, California came in at 13th among the states, with a 12-month jobs growth rate of 1.9% compared to the rest of the US at 1.4%.
Figure Sources: California Employment Development Department; US Bureau of Labor Statistics
Jobs Change by Industry
In the unadjusted numbers that allow a more detailed look at industry shifts, hiring saw increases in all but 3 industries over the year.
Gains in payroll jobs were led by Government ($70.1k average annual wages), Administration & Support & Waste Services ($45.4k), and Professional, Scientific & Technical Services ($122.5k).
Declines were in Retail Trade ($36.7k), Wholesale Trade ($78.3k), and Other Services ($40.7k).
All wage data is from the most current 4-quarter average from the Quarterly Census of Employment & Wages.
| Not Seasonally Adjusted Payroll Jobs (1,000) | 19-Sep | 12-month change |
|---|---|---|
| Total Farm | 484.7 | 11.8 |
| Mining & Logging | 23.8 | 0.1 |
| Construction | 916.9 | 33.6 |
| Manufacturing | 1,354.0 | 12.5 |
| Wholesale Trade | 697.2 | -1.4 |
| Retail Trade | 1,666.1 | -8.0 |
| Utilities | 57.2 | 0.3 |
| Transportation & Warehousing | 627.9 | 12.5 |
| Information | 559.7 | 15.1 |
| Finance & Insurance | 541.4 | 2.3 |
| Real Estate & Rental & Leasing | 298.5 | 5.0 |
| Professional, Scientific & Technical Services | 1,319.3 | 41.0 |
| Management of Companies & Enterprises | 257.4 | 3.1 |
| Administrative & Support & Waste Services | 1,194.2 | 43.2 |
| Educational Services | 379.0 | 11.1 |
| Health Care | 1,589.1 | 40.5 |
| Social Assistance | 846.3 | 33.3 |
| Arts, Entertainment & Recreation | 324.2 | 10.1 |
| Accommodation | 238.9 | 5.8 |
| Food Services | 1,470.7 | 25.4 |
| Other Services | 572.8 | -1.1 |
| Government | 2,584.7 | 43.4 |
| Total Nonfarm | 17,519.3 | 327.8 |
| Total Wage & Salary | 18,004.0 | 339.6 |
Figure Source: California Employment Development Department
Structural Shifts in State’s Economy
Comparing current job numbers to the pre-recession levels in 2007 illustrates the structural shift in the state’s economy, with the primary jobs growth occurring in the higher and lower wage industries.
Jobs growth within the traditional middle class wage—especially blue collar industries such as Manufacturing, Mining & Logging, and Utilities—continues to lag. After stronger gains during the recovery, both Wholesale and Retail Trade have continued to show weakness, reflecting competitive pressures from nontraditional channels at the same time these industries have been weakened by state policies producing higher operating costs. Finance & Insurance also remains in the negative column as companies have moved back office and other operations out of the state.
Construction, however, remains in the gain column at 2,900 above the 2007 peak but still 49,400 below the all-time peak in 2006. Residential Building Construction still accounts for the bulk of the remaining gap, with the September 2019 job levels 18,100 below their 2007 peak and 25,100 below the all-time peak in 2006.
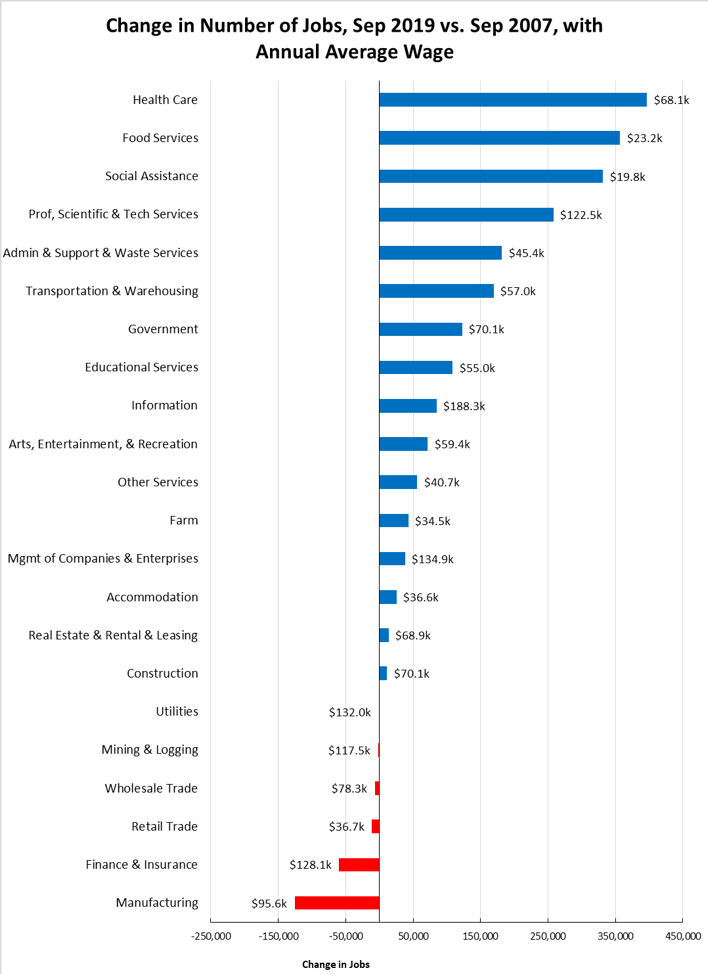
Figure Source: California Employment Development Department
Unemployment Rates by Region
| wdt_ID | Region | Unemployment Rates |
|---|---|---|
| 1 | California | 3.5 |
| 2 | Bay Area | 2.2 |
| 3 | Orange County | 2.4 |
| 4 | Sacramento | 3.0 |
| 5 | Central Coast | 3.0 |
| 6 | Central Sierra | 3.1 |
| 7 | San Diego/Imperial | 3.5 |
| 8 | Inland Empire | 3.6 |
| 9 | Upstate California | 3.8 |
| 10 | Los Angeles | 4.3 |
| 11 | Central Valley | 5.5 |
Figure Source: California Employment Development Department
Unemployment Rates by Legislative District
Lowest
| wdt_ID | Congressional District | Unemployment Rate |
|---|---|---|
| 1 | CD12 (Pelosi-D) | 1.7 |
| 2 | CD18 (Eshoo-D) | 1.7 |
| 3 | CD14 (Speier-D) | 1.9 |
| 4 | CD17 (Khanna-D) | 2.0 |
| 5 | CD15 (Swalwell-D) | 2.0 |
| 6 | CD52 (Peters-D) | 2.1 |
| 7 | CD49 (Levin-D) | 2.1 |
| 8 | CD45 (Porter-D) | 2.2 |
| 9 | CD48 (Rouda-D) | 2.2 |
| 10 | CD02 (Huffman-D) | 2.3 |
| wdt_ID | Senate District | Unemployment Rate |
|---|---|---|
| 1 | SD13 (Hill-D) | 1.6 |
| 2 | SD11 (Wiener-D) | 1.9 |
| 3 | SD36 (Bates-R) | 2.1 |
| 4 | SD37 (Moorlach-R) | 2.2 |
| 5 | SD39 (Atkins-D) | 2.2 |
| 6 | SD10 (Wieckowski-D) | 2.2 |
| 7 | SD15 (Beall-D) | 2.3 |
| 8 | SD07 (Glazer-D) | 2.3 |
| 9 | SD02 (McGuire-D) | 2.4 |
| 10 | SD38 (Jones-R) | 2.6 |
| wdt_ID | Assembly District | Unemployment Rate |
|---|---|---|
| 1 | AD22 (Mullin-D) | 1.5 |
| 2 | AD16 (Bauer-Kahan-D) | 1.6 |
| 3 | AD24 (Berman-D) | 1.7 |
| 4 | AD17 (Chiu-D) | 1.8 |
| 5 | AD28 (Low-D) | 1.9 |
| 6 | AD19 (Ting-D) | 1.9 |
| 7 | AD25 (Chu-D) | 2.0 |
| 8 | AD78 (Gloria-D) | 2.1 |
| 9 | AD73 (Brough-R) | 2.1 |
| 10 | AD10 (Levine-D) | 2.1 |
Highest
| wdt_ID | Congressional District | Unemployment Rate |
|---|---|---|
| 1 | CD34 (Gomez-D) | 4.8 |
| 2 | CD29 (Cardenas-D) | 4.8 |
| 3 | CD43 (Waters-D) | 5.1 |
| 4 | CD40 (Roybal-Allard-D) | 5.2 |
| 5 | CD22 (Nunes-R) | 5.3 |
| 6 | CD23 (McCarthy-R) | 5.4 |
| 7 | CD16 (Costa-D) | 6.0 |
| 8 | CD44 (Barragan-D) | 6.1 |
| 9 | CD21 (Cox-D) | 6.9 |
| 10 | CD51 (Vargas-D) | 8.2 |
| wdt_ID | Senate District | Unemployment Rate |
|---|---|---|
| 1 | SD14 (Hurtado-D) | 7.8 |
| 2 | SD40 (Hueso-D) | 6.8 |
| 3 | SD35 (Bradford-D) | 5.5 |
| 4 | SD30 (Mitchell-D) | 5.3 |
| 5 | SD33 (vacant) | 5.0 |
| 6 | SD16 (Grove-R) | 5.2 |
| 7 | SD24 (Durazo-D) | 5.0 |
| 8 | SD12 (Caballero-D) | 4.8 |
| 9 | SD21 (Wilk-R) | 4.7 |
| 10 | SD18 (Hertzberg-D) | 4.7 |
| wdt_ID | Assembly District | Unemployment Rate |
|---|---|---|
| 1 | AD63 (Rendon-D) | 5.3 |
| 2 | AD51 (Carrillo-D) | 5.5 |
| 3 | AD36 (Lackey-R) | 5.5 |
| 4 | AD21 (Gray-D) | 5.5 |
| 5 | AD59 (Jones-Sawyer-D) | 5.9 |
| 6 | AD64 (Gipson-D) | 6.1 |
| 7 | AD31 (Arambula-D) | 6.4 |
| 8 | AD32 (Salas-D) | 7.1 |
| 9 | AD26 (Mathis-R) | 7.4 |
| 10 | AD56 (Garcia-D) | 10.0 |
Employment Growth by Region
Containing 19.5% of the state’s population, the Bay Area has accounted for 39.2% of net employment growth compared to pre-recession levels. Los Angeles Region, with 29.0% of the population, accounted for only 15.8% of net employment gains, while Inland Empire continues to rank the second highest.
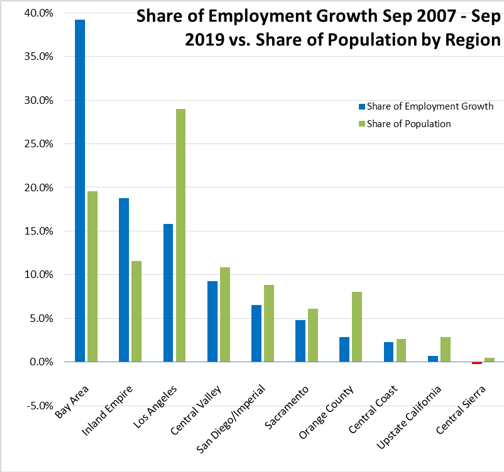
Figure Sources: California Employment Development Department; Department of Finance
MSAs with the Worst Unemployment Rates
Of the 20 Metropolitan Statistical Areas (MSAs) with the worst unemployment rates in August 2018, 8 are in California, including El Centro MSA (Imperial County) which continues with Great Depression-era levels of unemployment that are 13 times worse than in San Mateo, the county with the lowest unemployment rate.
| wdt_ID | MSA | Unemp. | Rank (out of 389) |
|---|---|---|---|
| 1 | El Centro MSA | 22.1 | 388 |
| 2 | Visalia-Porterville MSA | 9.2 | 387 |
| 3 | Bakersfield MSA | 7.4 | 386 |
| 4 | Merced MSA | 7.2 | 385 |
| 5 | Hanford-Corcoran MSA | 7.0 | 384 |
| 6 | Fresno MSA | 6.6 | 381 |
| 7 | Madera MSA | 6.5 | 378 |
| 8 | Yuba City MSA | 6.0 | 372 |
Figure Source: US Bureau of Labor Statistics, July 2018 data
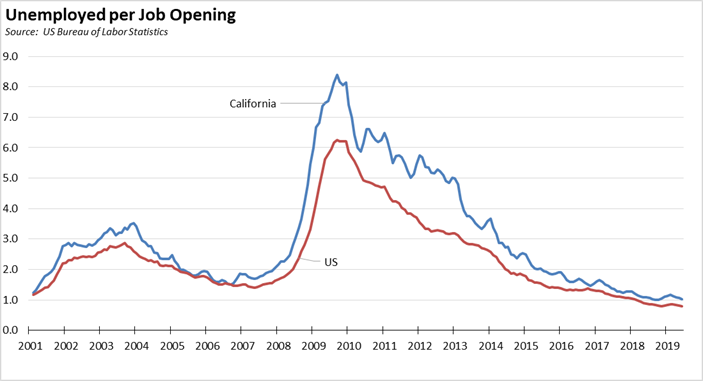
Chart of the Month: State Level JOLTS Data
One of the more frequently watched indicators on the national level is the Job Openings and Labor Turnover Survey (JOLTS) data released monthly by the US Bureau of Labor Statistics. This data is used to show some of the underlying dynamics within the country’s job market. This data is particularly useful in assessing the degree to which the economy is entering a labor shortage or surplus period including both by totals and by required skill levels, along with assessing the relative importance of why workers are leaving jobs by comparing separations for both layoffs and voluntary quits.
This data previously was only available at the national and regional levels. Recently released experimental data now makes it available for the states. The state data is reported as 3-month moving averages, and will be updated quarterly. The national data is available by industry. The state data will be limited to total nonfarm results.
Transforming the US data into 3-month moving averages as well, the number of unemployed per job opening show considerable labor tightening at both the California and US levels. Throughout much of 2018 and the second quarter of 2019, the US levels were at their historic lows of only 0.8 unemployed worker for every vacant job, while California with its relatively higher number of unemployed and stalling labor force numbers reached 1.0 unemployed workers per job opening in almost all of the second half of 2018 and in the most recent data for June 2019.
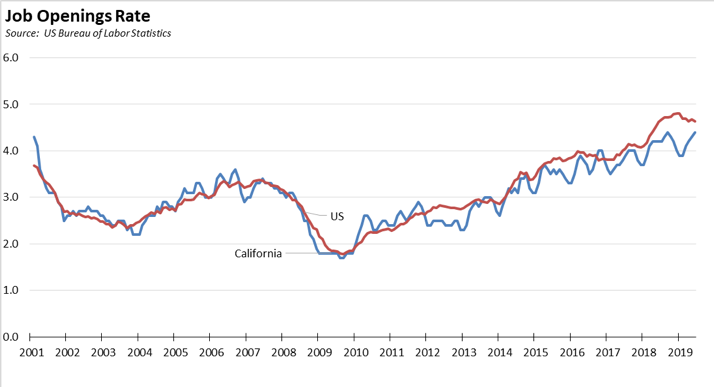
The Job Openings Rates remain high and generally on an uptrend, although the US rate moderated somewhat in the second quarter of this year. While the US and California rates tracked closely both prior to and during the Great Recession, there has been more variability during the recovery period, with the US as a whole pulling ahead since 2018 as the California economy began to slow particularly as the result of a leveling off in its labor force numbers. While California continues to increase its job vacancies, the labor force is not necessarily providing the workers to fill them.
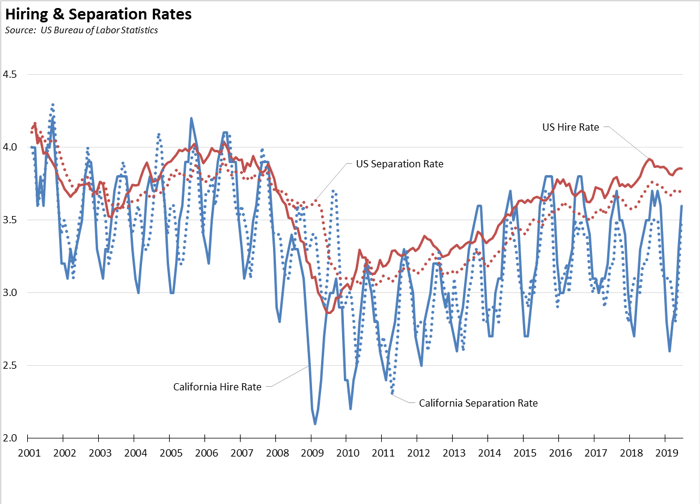
A comparison of the Hiring and Separation Rates shows considerable more labor force churn on the national level, with the California rates again reflecting the leveling out in the labor force numbers.
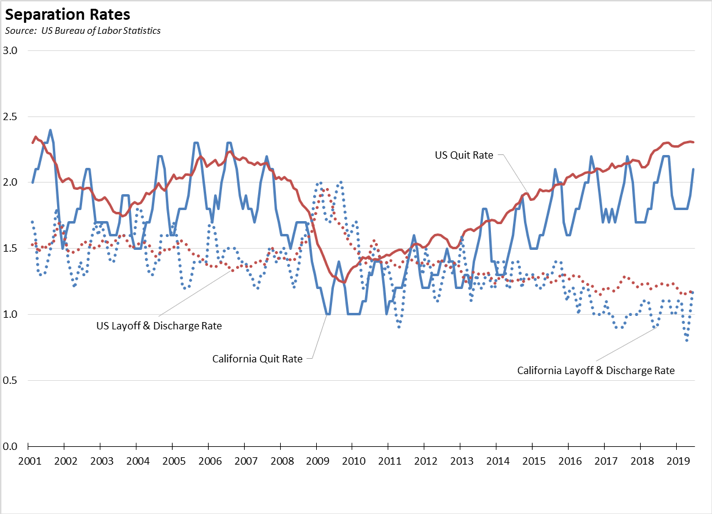
The Separation Rates show comparable trends, but with workers in California (Quit Rate) showing less certainty in being able to find better jobs than those at the national level. At the same time, California employers have also shown a lower rate of involuntary separations, keeping the workers they have although the most recent data for June shows a jump up to the national level.
Definitions:
Job Openings. Covers all job vacancies remaining at the end of each month, excluding those that will be filled internally, through layoff recalls, or means such as temp agencies or contractors. Job openings rate is calculated by dividing the number of job openings by the sum of Nonfarm employment and job openings for each month.
Job Hires. Covers the number of hires at any time within a month regardless of work status, again with the exclusions as under Job Openings. Job hires rate is calculated by dividing the number of hires by Nonfarm employment for each month.
Job Separations. Separations covers the number of job terminations at any time within a month regardless of work status, again with the exclusions as under Job Openings but also excluding any strikes. The data is further broken down into voluntary quits, involuntary layoffs and discharges, and other separations including for retirement, transfer to other locations, deaths, and disability. All separation rates are calculated by dividing the number of separations by Nonfarm employment for each month.