Highlights for policy makers:
- COVID-19 and the State Economy
- Unemployment Rate Improves; Employment Up 47,300
- Labor Force Participation Rate Ticks Up to 59.8%
- Employment Growth Ranking
- Nonfarm Jobs Up 96.0k
- Jobs Change by Industry
- Unemployment Rates by Region (not seasonally adjusted)
- Unemployment Rates by Legislative District (not seasonally adjusted)
- How Far Back Has the Economy in Each County Been Pushed?
- Employment Share by Region
- MSAs with the Worst Unemployment Rates: Los Angeles Sinks to 6th Worst in Nation
COVID-19 and the State Economy
While positive, the September numbers show recovery continuing at the relatively slow pace of the past few months. As measured by employment, California’s monthly growth was somewhat better than the rest of the US. As measured by jobs, the monthly growth rates were more similar.
September Numbers in Context: Technical Issues. The monthly numbers continue to be affected by technical factors arising from the current crisis conditions, but with the overall effect diminishing in significance as the surveys have been adjusted. Response rates for both surveys were up compared to the beginning months of the crisis, with the household survey near the 2019 levels and the establishment survey somewhat below. The effect of misclassifying unemployed persons continues to respond to changes in the survey methods, with the results in September at worse increasing the reported unadjusted unemployment rate by 0.4 point.
September Numbers in Context: Survey Timing. The surveys behind the labor force and jobs estimates are done the week of the 12th in each month. Since February, the reported numbers consequently have been overshadowed frequently by rapidly shifting conditions. The pause in processing unemployment insurance claims eliminated one of the main, more current indicators showing the trend in these changes, but resumed reporting will likely fill in this gap.
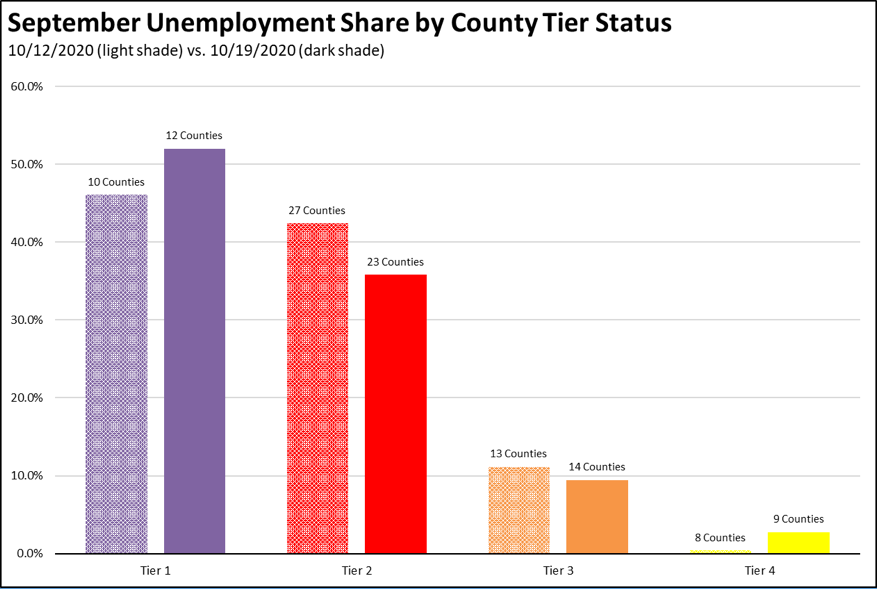
Further recovery progress in both the jobs and employment numbers now will largely be determined by the changing tier classifications of the counties under the state’s Blueprint for a Safer Economy. Restrictions on activities and business openings vary by tier, with Tier 1 being the most restrictive. Barring any further changes by the state to the criteria and structure of this approach, the Blueprint can also be used as a guidepost for the recovery potential within the state economy.
The following chart is update to the one in our earlier report this week, incorporating the tier revisions announced October 19. The most restrictive, Tier 1 classification now covers 52.0% of unemployed workers in September. Combined, the top two tiers cover 87.8% of the unemployed workers. While the Blueprint has been crafted by taking into consideration equity issues related to public health, this chart illustrates the economic equity issues as well particularly in light of the fact that unemployment continues to be concentrated heavily among lower wage workers.
In contrast, state income tax withholding since March continues to run 2.4% above the comparable period in 2019, an indication that the higher wage jobs subject to state income tax remain less affected by the closure orders. In another indication of the disparate economic effect of the closures, a recent report by Pitchbook indicates that nationally, venture capital deal activity in the first 3 quarters is running 6% ahead the comparable period in 2019 measured by value, with the number of VC mega-deals ($100 million and over) already near the 2019 total.
September Numbers in Context: Labor Force Stabilizes.
The unemployment numbers, however, only reflect the labor situation for workers counted within the labor force. Based on the seasonally unadjusted numbers, there are another 745,000 workers who for various reasons have left. The numbers reflected above in the chart account for only about three-quarters whose jobs and incomes have been affected by the current crisis.
While the California labor force numbers previously showed a much steeper drop than the rest of the country since February, the September numbers finally produced a small uptick for the state. The overall labor force loss and the participation rate, however, remain well below the rest of the US.
September Numbers in Context: Employment by Industry.
The September numbers again are affected by changes in the Government jobs, as many temporary Census jobs came to an end and as district decisions on school reopenings continue to be in flux.
Comparing the situation in September with the numbers from a year ago, industries more heavily affected by the closures continue to show the greatest contractions, with industries having higher telecommuting potential showing more resiliency in the current situation. “Employment” is the number of persons age 16 and over working, including wage & salary jobs, self-employment, and non-paid family workers in the civilian workforce. “Jobs” are the number of wage & salary jobs, with individual workers holding one or more of these jobs.
Source: US Bureau of Labor Statistics
Job numbers were below the 2019 levels in all but 2 industries, with the greatest contraction in lower wage Leisure & Hospitality where jobs are still down by about a third during what is typically the highest activity period for this industry. Within this broader category, Arts, Entertainment & Recreation continue to show job losses at close to half, with Amusement Parks and Arcades being the source of about a fifth of that continuing jobs deficit.
Unemployment Rate Improves; Employment Up 47,300
EDD reported that employment (seasonally adjusted; September preliminary) growth slowed substantially in September to 47,300 above the revised August numbers, while the number of unemployed dropped by 27,900. The reported unemployment rate improved 0.2 point to 11.0%. The unadjusted rate was up 7.2 points from the year earlier to 10.8%.
California rose to the 3rd highest unemployment rate among the states.
Total US employment saw a seasonally adjusted gain of 275,000, with the number of unemployed dropping by 970,000. The reported unemployment rate dropped 0.5 point to 7.9%.
Figure Sources: California Employment Development Department; US Bureau of Labor Statistics
Labor Force Participation Rate Ticks Up to 59.8%
California’s seasonally adjusted labor force participation rate rose by 0.1 point to 59.8%. Nationally, the participation rate dipped 0.3 point to 61.4%.
For the 12 months ending September 2020, the seasonally adjusted data shows the California labor force was down 781,400 workers (-4.0% loss) compared to the rest of the US loss of 3,126,600 (-2.2%).
The reported unemployment rates also have to be viewed in the context that large numbers of workers no longer are in the labor force. Accounting for these workers, the unemployment rate would be 14.6% rather than the reported 11.0%.
Employment Growth Ranking
The total number of persons employed (seasonally adjusted) over the 12 months ending in September was still down 2,082,300. California had the lowest level among the states in terms of absolute employment loss over the year. New York showed a loss of 896,000, Florida at 725,300, and Texas at 607,600.
Adjusted to account for differences in the size of each state economy, California over the year showed an 11.1% contraction, far deeper than for the rest of the US with a loss of 6.2%. Ranked among the states, California had the 2nd worst loss rate.
Figure Source: US Bureau of Labor Statistics
Nonfarm Jobs Up 96.0k
Nonfarm jobs (seasonally adjusted) rose 96,000, down from the revised gains in August at 133,800.
Nonfarm jobs were down 1,488,900 over the year. Adjusting for population, California loss rate remained the 44th worst among the states. The 12-month jobs loss rate was -8.5% compared to the rest of the US at -6.1%.
Figure Sources: California Employment Development
Department; US Bureau of Labor Statistics
Jobs Change by Industry
In the unadjusted numbers that allow a more detailed look at industry shifts, all but 2 industries continued to post job losses over the 12-month period. Utilities as an essential service and Finance & Insurance with a high incidence of telework opportunities again were positive.
Industries showing the greatest contractions over the year were led by Food Services, Arts, Entertainment & Recreation, and Government as temporary Census positions expired.
| Not Seasonally Adjusted Payroll Jobs (1,000) | September 2020 | 12-month change | Nonfarm Growth Rank | % 12-month Change | Avg. Annual Wage |
|---|---|---|---|---|---|
| Total Farm | 379.2 | -96.6 | -20.3% | $35.5k | |
| Mining & Logging | 21.9 | -1.1 | 3 | -4.8% | $119.5k |
| Construction | 860.0 | -45.2 | 11 | -5.0% | $72.5k |
| Manufacturing | 1,233.0 | -99.0 | 16 | -7.4% | $97.1k |
| Wholesale Trade | 655.0 | -36.3 | 8 | -5.3% | $80.4k |
| Retail Trade | 1,523.9 | -112.8 | 17 | -6.9% | $37.7k |
| Utilities | 57.1 | 0.4 | 2 | 0.7% | $137.0k |
| Transportation & Warehousing | 630.1 | -24.4 | 6 | -3.7% | $62.0k |
| Information | 516.0 | -53.4 | 13 | -9.4% | $188.7k |
| Finance & Insurance | 549.3 | 11.3 | 1 | 2.1% | $133.0k |
| Real Estate & Rental & Leasing | 288.2 | -14.8 | 5 | -4.9% | $71.2k |
| Professional, Scientific & Technical Services | 1,298.8 | -33.2 | 7 | -2.5% | $126.8k |
| Management of Companies & Enterprises | 241.6 | -12.5 | 4 | -4.9% | $135.1k |
| Administrative & Support & Waste Services | 1,056.4 | -92.2 | 14 | -8.0% | $47.3k |
| Educational Services | 336.0 | -39.2 | 9 | -10.4% | $56.0k |
| Health Care | 1,536.9 | -47.4 | 12 | -2.0% | $69.6k |
| Social Assistance | 801.7 | -44.7 | 10 | -5.3% | $20.9k |
| Arts, Entertainment & Recreation | 185.3 | -141.9 | 20 | -43.4% | $60.0k |
| Accommodation | 142.7 | -95.7 | 15 | -40.1% | $39.7k |
| Food Services | 1,126.8 | -346.0 | 21 | -23.5% | $24.1k |
| Other Services | 463.3 | -114.6 | 18 | -19.8% | $41.9k |
| Government | 2,443.6 | -128.4 | 19 | -5.0% | $72.0k |
| Total Nonfarm | 15,967.6 | -1,471.1 | -8.4% | ||
| Total Wage & Salary | 16,346.8 | -1,567.7 | -8.8% | ||
Figure Source: California Employment Development Department;
Wages based on most recent Quarterly Census of Employment & Wages
Unemployment Rates by Region (not seasonally adjusted)
Regions with jobs providing greater telework options—both due to the nature of the jobs and under the state’s regulations—including the Bay Area, Orange County, and Sacramento saw somewhat lower unemployment rates. The Central Valley and Los Angeles with a higher concentration of lower wage jobs affected more strongly by the state-ordered closures had much rates above the state average.
| wdt_ID | Region | Unemployment Rates |
|---|---|---|
| 2 | California | 10.8 |
| 6 | Bay Area | 8.1 |
| 10 | Central Coast | 8.2 |
| 14 | Upstate California | 8.5 |
| 18 | Central Sierra | 8.6 |
| 22 | Sacramento | 8.8 |
| 26 | Orange County | 9.0 |
| 30 | San Diego/Imperial | 9.6 |
| 34 | Inland Empire | 10.4 |
| 38 | Central Valley | 11.1 |
| 39 | Los Angeles | 14.3 |
Figure Source: California Employment Development Department
Unemployment Rates by Legislative District (not seasonally adjusted)
Lowest
| wdt_ID | Congressional District | Unemployment Rate |
|---|---|---|
| 2 | CD18 (Eshoo-D) | 5.8 |
| 3 | CD17 (Khanna-D) | 6.9 |
| 4 | CD02 (Huffman-D) | 7.1 |
| 5 | CD24 (Carbajal-D) | 7.3 |
| 6 | CD52 (Peters-D) | 7.2 |
| 7 | CD49 (Levin-D) | 7.2 |
| 9 | CD04 (McClintock-R) | 7.5 |
| 10 | CD15 (Swalwell-D) | 7.9 |
| 12 | CD12 (Pelosi-D) | 8.0 |
| 13 | CD14 (Speier-D) | 8.0 |
| wdt_ID | Senate District | Unemployment Rate |
|---|---|---|
| 2 | SD13 (Hill-D) | 6.4 |
| 3 | SD01 (Dahle-R) | 7.1 |
| 4 | SD02 (McGuire-D) | 7.4 |
| 5 | SD15 (Beall-D) | 7.5 |
| 6 | SD39 (Atkins-D) | 7.5 |
| 7 | SD10 (Wieckowski-D) | 7.8 |
| 8 | SD36 (Bates-R) | 7.5 |
| 9 | SD17 (Monning-D) | 8.0 |
| 10 | SD03 (Dodd-D) | 8.2 |
| 11 | SD19 (Jackson-D) | 8.2 |
| wdt_ID | Assembly District | Unemployment Rate |
|---|---|---|
| 2 | AD28 (Low-D) | 6.0 |
| 3 | AD16 (Bauer-Kahan-D) | 6.3 |
| 4 | AD22 (Mullin-D) | 6.5 |
| 5 | AD24 (Berman-D) | 6.3 |
| 6 | AD78 (Gloria-D) | 7.0 |
| 7 | AD10 (Levine-D) | 6.9 |
| 8 | AD25 (Chu-D) | 6.9 |
| 9 | AD06 (Kiley-R) | 6.6 |
| 10 | AD04 (Aguiar-Curry-D) | 7.3 |
| 11 | AD77 (Maienschein-R) | 7.3 |
Highest
| wdt_ID | Congressional District | Unemployment Rate |
|---|---|---|
| 2 | CD30 (Sherman-D) | 14.2 |
| 3 | CD28 (Schiff-D) | 15.0 |
| 4 | CD32 (Napolitano-D) | 15.0 |
| 5 | CD29 (Cardenas-D) | 15.8 |
| 6 | CD51 (Vargas-D) | 15.7 |
| 7 | CD37 (Bass-D) | 15.2 |
| 9 | CD43 (Waters-D) | 16.0 |
| 10 | CD34 (Gomez-D) | 16.2 |
| 12 | CD40 (Roybal-Allard-D) | 17.6 |
| 13 | CD44 (Barragan-D) | 19.7 |
| wdt_ID | Senate District | Unemployment Rate |
|---|---|---|
| 2 | SD32 (Archuleta-D) | 12.9 |
| 3 | SD22 (Rubio-D) | 13.8 |
| 4 | SD40 (Hueso-D) | 14.3 |
| 5 | SD18 (Hertzberg-D) | 15.9 |
| 6 | SD21 (Wilk-R) | 15.3 |
| 7 | SD14 (Hurtado-D) | 14.4 |
| 9 | SD24 (Durazo-D) | 16.6 |
| 10 | SD33 (Gonzalez-D) | 17.0 |
| 12 | SD30 (Mitchell-D) | 17.0 |
| 13 | SD35 (Bradford-D) | 17.3 |
| wdt_ID | Assembly District | Unemployment Rate |
|---|---|---|
| 2 | AD43 (Friedman-D) | 15.2 |
| 3 | AD48 (Rubio-D) | 15.4 |
| 4 | AD56 (Garcia-D) | 15.5 |
| 5 | AD46 (Nazarian-D) | 17.4 |
| 6 | AD36 (Lackey-R) | 17.4 |
| 7 | AD62 (Burke-D) | 15.6 |
| 9 | AD63 (Rendon-D) | 18.4 |
| 10 | AD51 (Carrillo-D) | 18.7 |
| 12 | AD64 (Gipson-D) | 19.0 |
| 13 | AD59 (Jones-Sawyer-D) | 19.5 |
How Far Back Has the Economy in Each County Been Pushed?
As an indication of the severity of the current economic downturn, the following chart illustrates how much economic ground each county has lost using employment levels as the measure. Based on annual averages, the chart below indicates the last year each county saw the September employment numbers. Because the current series only goes back to 1990 for most counties, several of the entries indicate “Before 1990.” Los Angeles County is the exception, with data going back to 1976. The “Change” column indicates the change from April, the month reflecting the effects of the initial round of closures.
| wdt_ID | County | Last Year Employment Equal To or Less Than April | Last Year Employment Equal to or Less Than September | Change |
|---|---|---|---|---|
| 2 | Alameda County | 2009 | 2012 | 3 |
| 3 | Alpine County | 2009 | 2009 | 0 |
| 4 | Amador County | 1997 | 2012 | 15 |
| 5 | Butte County | 1998 | 1999 | 1 |
| 6 | Calaveras County | 2012 | 2014 | 2 |
| 7 | Colusa County | 1999 | 2006 | 7 |
| 8 | Contra Costa County | 1997 | 2011 | 14 |
| 9 | Del Norte County | 1992 | Before 1990 | |
| 10 | El Dorado County | 1999 | 2014 | 15 |
| 11 | Fresno County | 2012 | 2015 | 3 |
| County | Last Year Employment Equal To or Less Than April | Last Year Employment Equal to or Less Than September | Change |
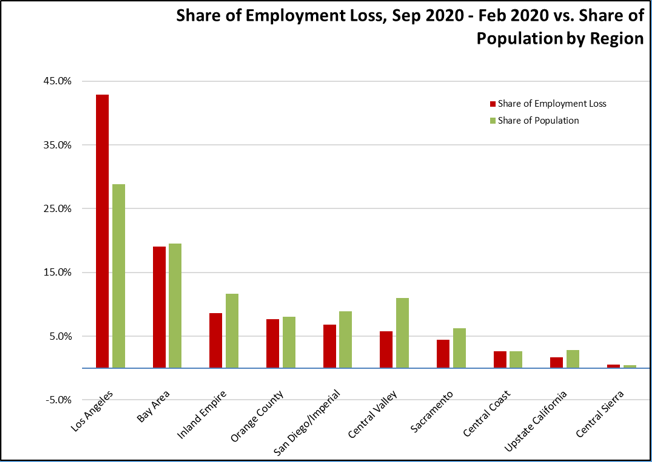
Employment Share by Region
The following chart compares change in employment (compared to pre-COVID February 2020) vs. population share as a measure of the disparate economic effects from the social distancing measures. Los Angeles Region, which experienced relatively greater job creation in lower income, population-serving and tourism industries during the recently ended expansion period, has to date sustained a commensurate far greater relative and absolute employment loss in the current economic downturn. Regions such as the Bay Area and San Diego with a greater incidence of jobs amenable to telework have been slightly less impacted. Regions such as the Central Valley and Inland Empire with a higher degree of essential businesses but also effects from seasonal factors have shown somewhat greater resiliency.
MSAs with the Worst Unemployment Rates: Los Angeles Sinks to 6th Worst in Nation
The number of California MSAs among the 20 regions with the worst unemployment rates in August rose to 5. As a result of a pattern of jobs growth in recent years that concentrated on the hardest-hit lower wage, population-serving and tourism service industries in Los Angeles County, Los Angeles-Long Beach-Anaheim MSA (Los Angeles and Orange Counties) sank to the 6th worst in the nation.
| wdt_ID | MSA | August Unemployment Rate | US Rank out of 389 |
|---|---|---|---|
| 1 | El Centro MSA | 22.9 | 389 |
| 2 | Los Angeles-Long Beach-Anaheim MSA | 15.0 | 384 |
| 3 | Visalia-Porterville MSA | 13.1 | 381 |
| 4 | Bakersfield MSA | 13.1 | 381 |
| 5 | Stockton-Lodi MSA | 11.9 | 375 |