The Center for Jobs and the Economy has released our initial analysis of the September Employment Report from the California Employment Development Department.
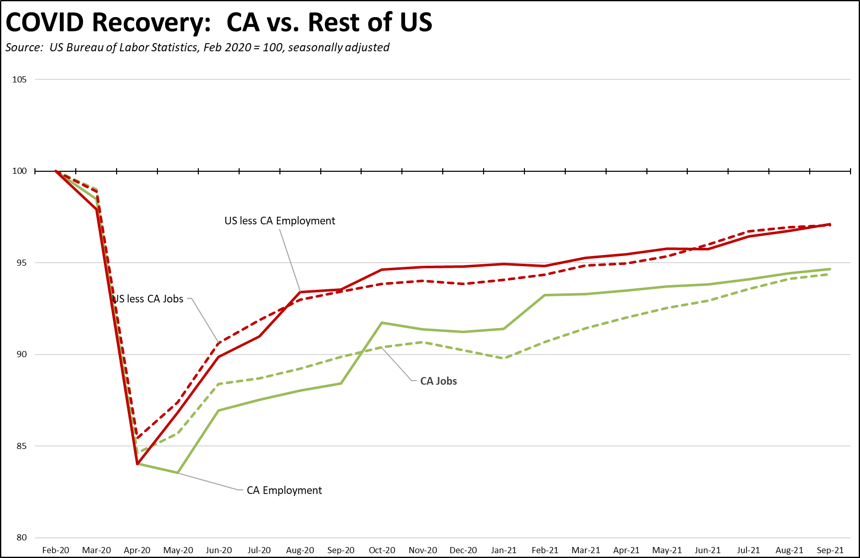
While the September job and employment numbers were again positive, they indicate a slowing in the recovery, keeping California’s performance behind much of the rest of the country.
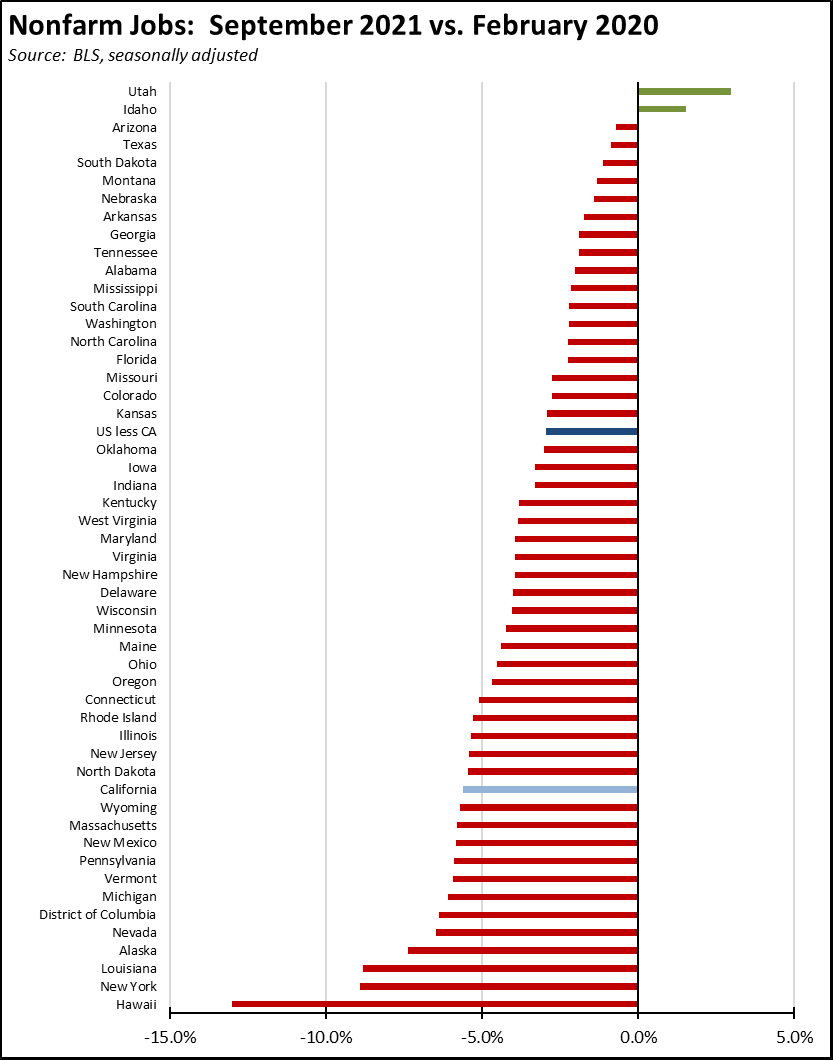
Viewed by state, California rose to 13th lowest in its current recovery level compared to the pre-pandemic job level, while the number of states moving into a growth phase remained at 2.
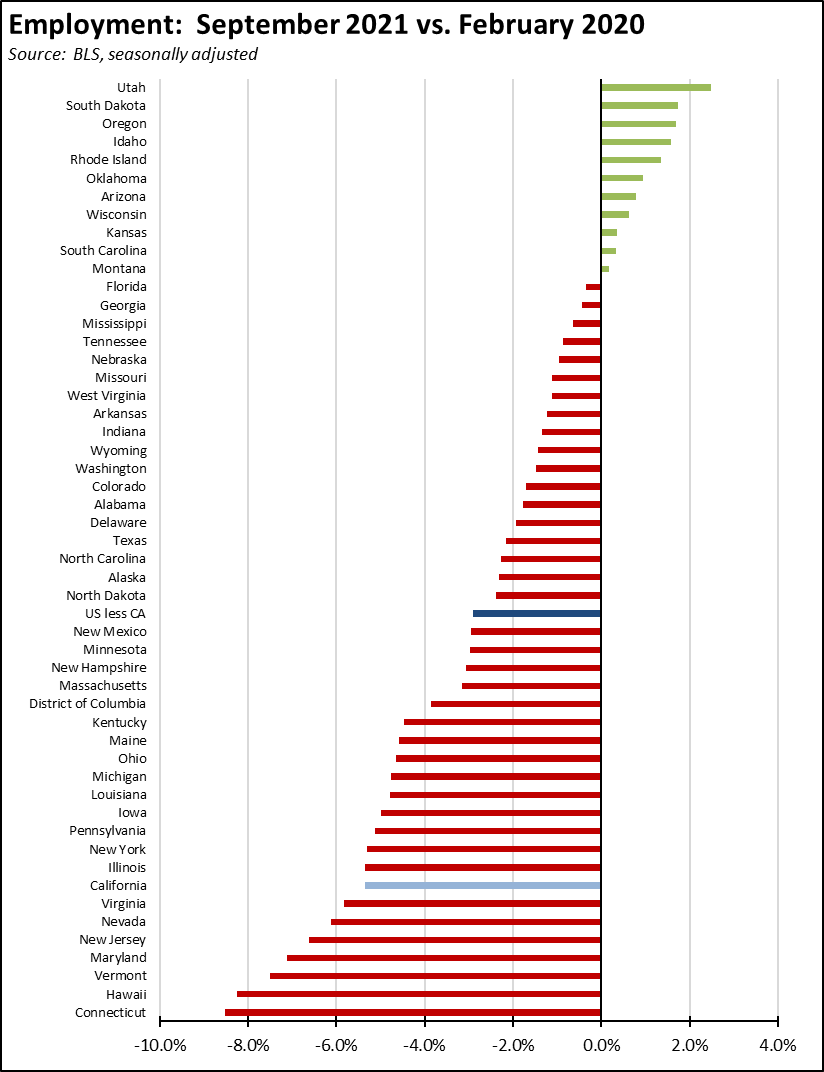
Measured by employment, 11 states have now moved to growth while California dipped to the 8th lowest.
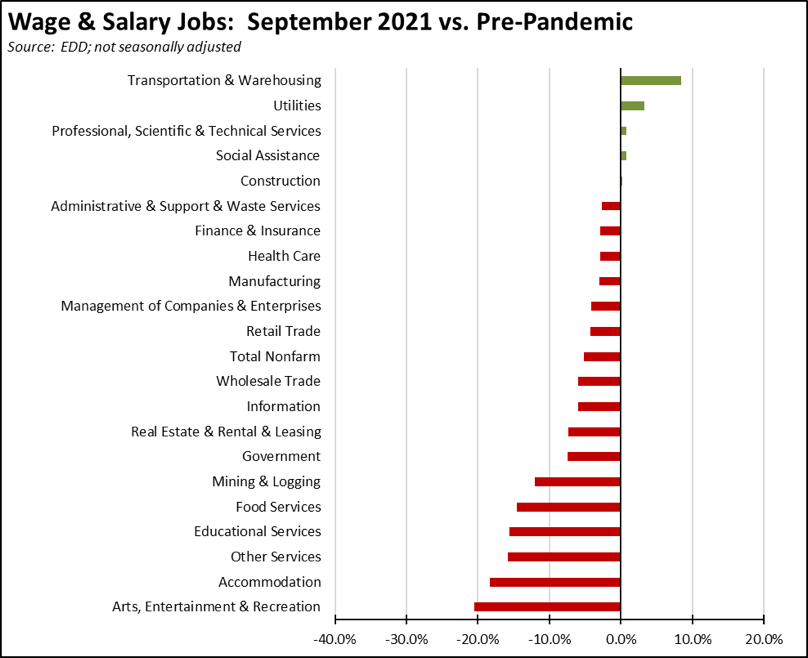
Most parts of the state’s economy remain in the recovery stage. Following the September losses in Finance & Insurance, the current data shows 5 industries have moved to the growth stage, although Construction was up by only 1,400 jobs. The bulk of the state’s industries still face a prolonged period of regaining lost ground, and some—as reflected the most current Department of Finance projections—are likely to never recover to prior levels as the result of work, sales channel, and technology changes accelerated by the pandemic shutdowns.
CA Unemployment Rate
Rate
California’s reported unemployment rate (seasonally adjusted) in September remains unchanged at 7.5 %. California, however, in a tie with Nevada dropped to the worst unemployment rate among the states.
The September numbers show little change in the number of unemployed, down 12,800. Employment rose 43,200, and the total labor force rose only 30,500, raising the labor force participation rate from 61.0% to 61.1%.
US Unemployment Rate
Rate
The reported national numbers show US unemployment rate (seasonally adjusted) improving 0.4 point to 4.8%, the best since March 2020 at the beginnings of the pandemic. Employment was up more strongly at 526,000, while unemployment dropped 710,000. The labor force was down 183,000, with the participation rate dipping 0.1 point to 61.6%.
Nonfarm Jobs
Change
Nonfarm wage and salary jobs rose 47,400 (seasonally adjusted) in September, while the gains in August were revised down by 9,600 to 94,700. Nonfarm jobs nationally were up 194,000.
California’s job gains ranked third, behind Texas with an increase of 95,800 and Florida with 84,500.
As of the September numbers, California has regained 64% of the nonfarm jobs lost to the state shutdowns. The rest of the states combined were further along in recovery, having regained 80% of the jobs lost in the pandemic period.
California job increases were led by Accommodation & Food Services (12,500), Arts, Entertainment & Recreation (10,800), and Professional, Scientific & Technical Services (7,300). Losses were in 4 industries, led by Other Services (-3,700), Wholesale Trade (-2,600), and Finance & Insurance (-1,100).
Job Openings
at the end of the month
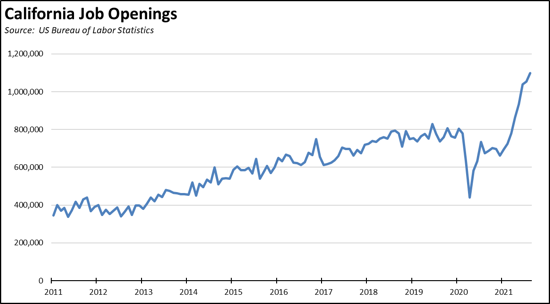
US Bureau of Labor Statistics has now begun monthly estimates by state for the Job Openings & Labor Turnover Survey (JOLTS). In August, the number of job openings unfilled at the end of August rose 45,000 to 1.099 million, the highest of any state.
To put this number in perspective, the 1.099 million is 6% more than what was needed in August to return to the pre-pandemic jobs number. The jobs are there for the state to fully recover. The workers are not.
Similar to the results reported over the past several months for the nation, unfilled job openings have been rising sharply in California as well. This situation reflects the extent to which labor shortages remain a constraint on how quickly the recovery can proceed in the state, as jobs are available but the workers to fill them are not.
For both the US and California, the current rise in job openings began in January 2021, but has been steeper in the rest of the US—California in August represented 10.5% of total openings compared to 11.5% of total jobs. This situation indicates both the US and California recoveries retain considerable potential to grow once workers become available, but that potential growth within the state remains somewhat lower than the overall average.
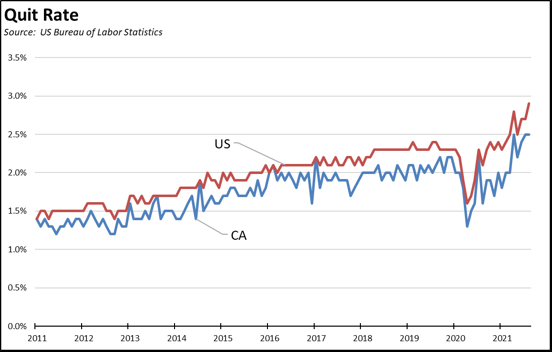
Similarly, the JOLTS data has indicated that jobs expansion is not only being held back by a worker shortage, but as well by a growing issue with retaining workers as the quit rate has risen.
This factor similarly has affected both the state and national numbers, but to a lesser extent in California. This outcome is consistent with our previous research indicating that lower income California workers tend to be risk averse. Even when higher wage opportunities become available, the high and growing costs of living in the state substantially raise the stakes from making a wrong job decision. These workers, consequently, are more likely to stay with existing jobs where they feel some employment security that will at least cover their monthly bills, rather than taking a new job even with higher pay. The costs of living otherwise mean they can fall permanently behind if a new job turns out to be less certain.
Wages
Average Hourly Wage,
Private Workers
For the 12 months ending September, the average hourly wage for private-sector workers grew by 4.9%. Average weekly hours worked dipped 0.9%, resulting in a combined 4.0% increase in average weekly earnings.
While this rate is above the 3.8% annual average experienced 2014-2019, workers in the current circumstances are losing ground due to the rising costs of living in the state. In the most recent results, inflation as measured by the California CPI was running at an annual rate of 4.7% as of August.
Counties with Double-Digit Unemployment
Unemployment
Above 10%
The number of counties with an unemployment rate at 10% or above dropped to 1. The unadjusted rates ranged from 3.6% in Marin to 18.1% in Imperial.
On an MSA basis in August, California again contained 11 of the 25 MSAs with the worst unemployment rates in the country, ranging from Modesto MSA at 8.0% (#367 out of 389) to El Centro MSA at 19.4% (worst in the country at #389).
Los Angeles-Long Beach-Anaheim MSA was at 8.8% (3-way tie for #379).
The highest ranked California region was San Jose-Sunnyvale-Santa Clara MSA at 4.1% (#201), meaning 200 urban areas in the country were performing better than California.
