Highlights for policy makers:
- COVID-19 and the State Economy
- Change in Number of Businesses During the Pandemic Period
- Teleworking Remains High but Down from Pandemic Highs
COVID-19 and the State Economy
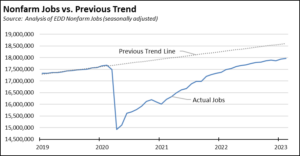
Since the pandemic period low point in April 2020, the state has experienced nonfarm job (seasonally adjusted) additions through February totaling 3.052 million. While this level has been called “the biggest hiring spree in the nation,” it was preceded by a spree of another kind that saw the loss of 2.755 million jobs as the result of state-ordered closures and shifting state policies throughout this period. Claims of creating 3 million jobs have to be tempered by the fact that 90% of them were eliminated by state actions in the first place. Restoring them was not due to dynamism in the state’s economy, but instead the result of getting rid of the state policies that had kept them closed.
In terms of actual job creation, February’s nonfarm jobs are only 297,000 higher (1.7% higher) than the prior peak in February 2020. While significant, this number should be viewed from a number of different perspectives.
First, the latest numbers indicate that the state’s job policies in this period essentially lost two years’ worth of economic expansion. Comparing the reported numbers to the previous trend line, February’s job results in the absence of the pandemic would have been reached two years earlier, around February 2021. The trend line, however, does overstate actual job creation in the state just prior to the pandemic. As indicated previously by Department of Finance, the California job numbers in this period—and continuing—were not fully reflective of jobs creation but instead contained a significant component of jobs reclassification as the result of AB 5 (2019) and its mandated shift from self-employment to wage and salary jobs. California job creation even at this point was not as strong as the numbers seemed to indicate. Measuring recovery instead by a return to trend, California is unlikely to reach this point for quite some time due to several issues as discussed below.
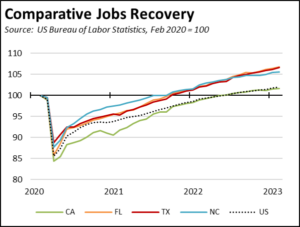
Second, California’s results have not been nearly as strong as those experienced by other states that chose to relax the pandemic job restrictions much earlier. Measured in absolute terms, California’s 297,000 gain as of February comes in a distant third behind Texas (860,600) and Florida (614,300) and continues to run close to fourth ranked North Carolina (258,700).
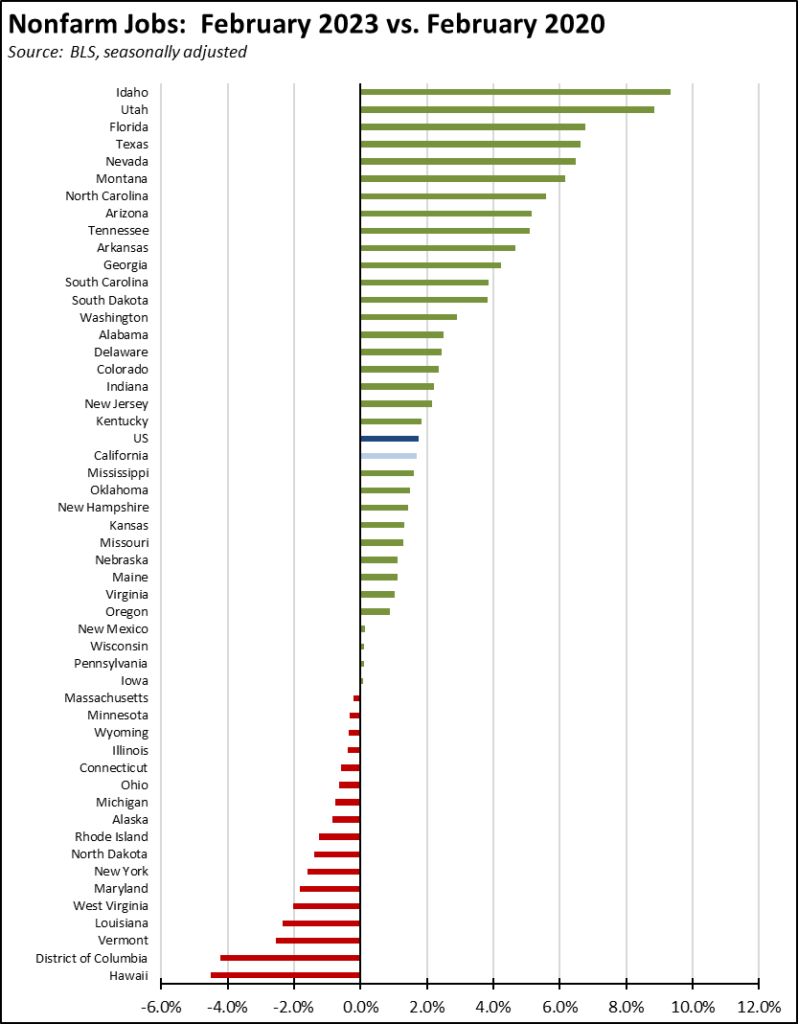
In relative terms, California’s 1.7% growth since its prior peak is eclipsed by 20 other states, ranging from Kentucky at 1.9% to Texas (6.6%), Florida (6.8%), Utah (8.8%), and Idaho (9.3%).
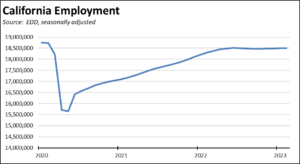
Third, California has only added jobs. The state has not been able to put people back to work. Total employment in February was still 1.3% below the pre-pandemic peak. The total number of workers employed essentially has stagnated since May 2022, in part due to the state’s elimination of self-employment opportunities under AB 5 and the likely continuing net migration out of the state.
California retains the potential for much stronger jobs growth, but expansion continues to be hindered by a lack of housing workers can afford near their jobs, state policies that continue to drive up the cost of energy—including recent passage of yet another tax that will add to the state’s highest-in-the-nation fuel costs both directly and through investment disincentives that likely will contribute to the current constrained supply issues—and a continuing labor shortage as reflected above in the employment numbers. Overall, combining unfilled job openings with the labor force data, total labor demand has exceeded the available supply since last November.
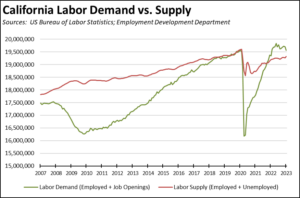
The labor gap began to show some closure in January, but not necessarily for the right reasons. Unfilled job openings reached their peak level of 1.345 million last May. Since then, total labor force through January grew by 66,300 workers (0.3%). The number of job openings, however, dropped much more steeply by 289,000 (21.5%) as the tech industry and other companies began to dial back on their hiring plans.
Change in Number of Businesses During the Pandemic Period
Most of the jobs data is reported at the establishment level, where a business may operate one or more establishments in the state and elsewhere. Data on the number of firms is more limited and generally reported with a greater lag, with the most current results available for the first quarter of 2022. The numbers discussed below also reflect the net changes in each quarter, incorporating the background flows of firms opening and closing and changing size categories as the result of layoffs or expansions. This background flow is captured in another series contained in the Center’s Indicators—the Business Employment Dynamics data—but again is available only for establishments and not firms.
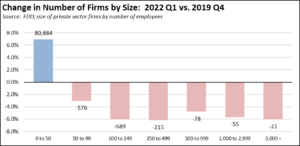
Comparing the most recent 2022 Q1 results to the prior peak in this series (2019 Q4), California in general saw a loss in the number of larger firms across all size categories while many workers turned to starting their own small businesses. Looking at the change in firms by employment size, only the smallest (0 to 50 employees) private sector firm category grew in this period, expanding by 80,884 (6.9%) since the peak in 2019 Q4. Within this size category, almost all of the growth (74,786) was in the smallest size component of 0 to 4 employees. All of the larger size groups saw a loss of private sector firms in the state.
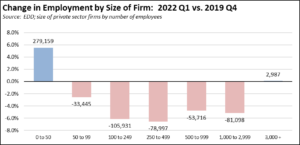
Small businesses also produced nearly all of the jobs expansion in this period as well. Firms with 0 to 50 employees generated 279,159 net jobs by this point, while all the larger size categories continued to show net job losses with the exception of the largest firms (3,000 and more employees) which showed essentially a break-even level at a gain of only 2,987 jobs.
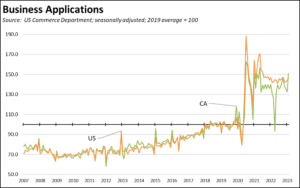
The critical jobs role played by small businesses during the pandemic period is also reflected in the continued strength being shown in new business applications. While new business applications in California began to lag the overall US numbers in June 2021 likely in part due to the continuously shifting state pandemic policies, they have remained well above the 2019 average throughout most of the pandemic period as workers sought alternative income opportunities. California applications have returned near to the US trend in the latest months.
While an industry break-down is available only at the national level, most new business applications to date through the pandemic period (March 2020 to February 2022) have been for Retail Trade (15.3%), Professional Services (12.2%), Construction (10.9%), and Accommodation and Food Services (9.0%). Those business applications indicating planned employment have followed a similar pattern, with the highest industries being Retail Trade (13.2%), Accommodation and Food Services (12.3%), Construction (10.7%), and Professional Services (10.2%).
Teleworking Remains High but Down from Pandemic Highs
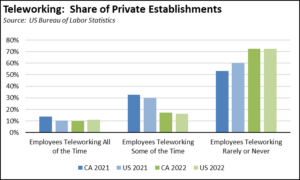
In the latest Business Response Survey from US Bureau of Labor Statistics, teleworking in 2022 remained a heightened aspect of the workplace compared to the pre-pandemic period but at somewhat reduced levels from 2021.
Looking at the establishment numbers, 27.4% of all private sector establishments in California enabled their workers to telecommute all or some of the time in 2022 compared to 46.7% in 2021 (US at 27.5% in 2022 and 39.9% in 2021). This policy, however, is more prevalent at larger companies. Measured by share of private sector employment, 37.3% of California workers in 2022 had access to telework compared to 56.2% in 2021 (US at 35.2% and 50.2%).
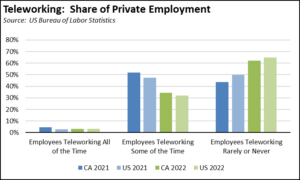
In 2021, California had the 7th highest share of private sector workers with access to telework. In 2022, California came in at 18th highest.
To put these numbers in perspective, our previous analysis of the occupational data indicated that up to 40% of all California wage and salary workers would be able to do their jobs fully while working from home, while a large share of other workers including those in lower and middle wage jobs would be able to do so at least part of the time. At a scoping level of analysis, the 40% alone would produce climate change emission reductions of 26.3 MMTCO2e by 2030, in sharp contrast to the other VMT (vehicle miles traveled) measures the state has pursued for over 4 decades with no meaningful emissions effect. The primary constraint—as indicated in the declines shown in the recent survey results—has been California unique labor laws and regulations that put private sector employers at risk for pursuing these measures more broadly even as they are being embraced for public sector workers.